

Abstract
During ribosome translocation, the elongation factor EF‐G undergoes large conformational change while maintaining its contact with the moving tRNA. We previously measured a power stroke accompanying EF‐G catalysis, which was consistent with structural studies. However, the role of power stroke in translocation fidelity remains unclear. Here, we report quantitative measurements of the power strokes of structurally modified EF‐Gs by using two different techniques and reveal the correlation between power stroke and translocation efficiency and fidelity. We discovered that the reduced power stroke only lowered the percentage of translocation but did not introduce translocation error. The established force ‐structure–function correlation for EF‐G indicates that power stroke drives ribosomal translocation, but the mRNA reading frame is probably maintained by ribosome itself. Furthermore, the microscope detection method reported here can be simply implemented for other biochemical applications.
Keywords: antibiotics, crosslinked EF-G, force-induced remnant magnetization spectroscopy, power stroke, ribosomal translocation, translocation fidelity
Power stroke: The ribosome translocase EF‐G generates substantial power stroke during translocation when its conformational change is not restricted. A short crosslinker restricting the conformational change will reduce this force by nearly 30 pN. The reduced power stroke decreases the translocation efficiency but does not introduce translocation error.

Introduction
The ribosome translates mRNA into peptides processively. In contrast to many transport motor proteins with fluctuating step sizes, it moves on the mRNA by exactly 3 nt per step.1 Otherwise the codon contents will be altered, which is accumulative to all downstream codons and results in incorrect peptides. Therefore, ribosomal translocation on the mRNA is unique and vital to cell survival. The translocation process can be described as the following steps. First, the peptide elongation cycle starts with the aminoacyl tRNA binding to the ribosomal A‐site. Then the amino acid forms a peptide bond with the peptidyl chain that is held at the P‐site tRNA. Consequently, the peptidyl chain becomes one amino acid longer and is transferred to the A‐site tRNA. Then the tRNAs move from the P‐ and A‐sites to the E‐ and P‐sites, respectively, leaving a vacant A‐site for the next cycle. Overall, translocation involves large‐scale ribosome conformational changes and extensive tRNA–ribosome interaction reorganization.
The mechanism for the precise control of the translocation step is unclear. The ribosome can translocate spontaneously at a slow rate of approximately 5×10⁻⁴ s−1.2 With GTP hydrolysis and in the presence of translocase EF‐G, the rate is improved by approximately 50 000‐fold to 25 s−1, which is comparable with the rate of protein synthesis in vivo. There are two possible mechanisms for EF‐G catalysis: the Brownian motor model and the power stroke model.3 The key difference between the two models is whether a substantial mechanical force, termed as power stroke, is generated. In the Brownian motor model, EF‐G utilizes the GTP energy to bind tightly to the A‐site after the A‐site tRNA diffuses to the P‐site. The driving force is thermal fluctuation and no mechanical force is generated. In the power stroke model, however, the EF‐G generates a burst of mechanical force through GTP hydrolysis that pushes the A‐site tRNA to move towards the P‐site. The ribosome structure trapped with both the A‐site tRNA and EF‐G showed that although the P‐site tRNA moved by the same distance as the ribosome inter‐subunit ratcheting and head swiveling would have generated, the A‐site tRNA moved more and maintained tight contact with EF‐G. This intermediate state was consistent with an active power stroke model.4 Another structural study revealed an unusually compact EF‐G structure bound with the pre‐translocation ribosome.5 Compared to the extended conformation on the post‐translocation ribosome, the catalytic domain IV of EF‐G had to move by approximately 100 Å during translocation. This large conformational change is also consistent with the power stroke model because average thermal fluctuations can only lead to small movements (<1 Å) due to the large viscous dragging force of solution.6 In addition, thermal energy‐driven movements of 100 Å are unlikely to be compatible with the 25 s−1 turnover rate of EF‐G. However, structural studies alone cannot provide the amplitude of power stroke.
Three different methods have been attempted to quantify the power stroke and produced different results, none of which have established a correlation among power stroke, EF‐G structural changes, and function.7, 8, 9 By using a series of DNA–mRNA duplexes as force rulers, we determined the EF‐G power stroke to be (89±11) pN.7 The critical dissociation forces of the duplexes were obtained by force‐induced remnant magnetization spectroscopy (FIRMS).10 Because shear rupture of DNA duplexes into separate single strands exhibited cooperative dissociation with a sharp transition, they have been used as reference systems for force measurements.11, 12, 13 Liu and co‐workers used optical tweezers and determined the power stroke to be approximately 13 pN.8 Chen and colleagues used an indirect method to deduce the power stroke.9 However, it remains unknown whether the EF‐G force plays a role in controlling the precise 3 nt stepping of the ribosome, or whether the force can be varied by structural modifications or other factors. In addition, because different techniques produced inconsistent force values, a more straightforward detection method will benefit the precise quantification of power stroke and other forces generated in the cell.
Here, we report that the EF‐G power stroke can be changed by internal crosslinking and antibiotics binding. We also report a new microscope‐based technique to measure the power stroke, which is more straightforward and easier to implement than the previous magnetic‐based approach. Both techniques produced similar results. Furthermore, we reveal for the first time that a smaller power stroke only induced a lower translocation yield and did not affect translocation fidelity. These new discoveries confirmed the substantial power stroke accompanying EF‐G catalysis that we previously determined and indicated that the precise mRNA translocation is achieved by the ribosome itself.
Results
Preparation and functional assay of crosslinked EF‐G
Two cysteines were introduced at the Phe411 and Tyr535 positions (Escherichia coli sequence) to the cysteine‐less EF‐G sequence in pET24b.14 The distances between these two residues were 18.3 and 34.8 Å in the pre‐ and post‐translocation complexes, respectively, according to the recent structures of 4WPO/4WQF (Figure 1 A).5 Earlier ribosome‐bound EF‐G (2WRI) and free EF‐G (2BM0) structures indicated the distances between these two residues were 17.5 and 37.4 Å, respectively (Figure S1 in the Supporting Information).15, 16 The bifunctional crosslinkers were maleimide‐(PEG)n‐maleimide, with lengths of 27 for n=6 and 43 Å for n=11. After the coupling reaction with the two cysteine residues, the crosslinker (PEG)6 would restrict the extended EF‐G conformation, whereas (PEG)11 would not. The crosslinked EF‐G was distinguishable from the un‐crosslinked ones by 5 % PAGE (polyacrylamide gel electrophoresis) after being enriched by four different methods (Figure 1 B–E, in each band doublet, top band: crosslinked; bottom band: un‐crosslinked). Figure 1 B shows the enrichment by using continuous elution electrophoresis (Bio‐Rad Model 491). The proteins separated on a cylindrical gel were eluted out of the gel and pumped out from the small reservoir confined by a dialysis membrane. The fractions were concentrated and analyzed by using PAGE. The bottom band was eluted out first, followed by the mixture of both bands, and finally the top band was eluted. Because of the very close R f values of these proteins (0.74 for un‐crosslinked and 0.77 for the crosslinked), every 10 h/gel separation only yielded less than 200 pmol of pure protein. We improved the efficiency through batches of MiniGel separation followed by manual incision and electro‐elution (Bio‐Rad Model 422, Figure 1 C). Alternatively, to avoid sodium dodecyl sulfate (SDS) in the PAGE gels, the crosslinked EF‐G was purified by chemical reactions with sulfhydryl reactive beads, such as maleimide‐coated magnetic beads (Figure 1 D) and iodoacetyl gel (Figure 1 E). Because the crosslinked EF‐G could not react with the beads, it was eluted out of the matrix free of un‐crosslinked EF‐G. Crosslinked EF‐G purified with magnetic beads reached more than 90 % purity without any SDS, which was used for the biophysical measurements in this work.
Figure 1.
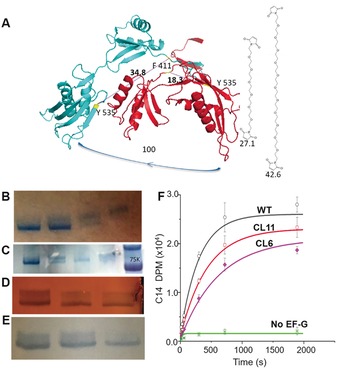
Design, purification, and activity assay of crosslinked EF‐Gs. A) Crosslinking residues F411 and Y535 (bacterial numbering). B) Separation by continuous elution electrophoresis. Lanes 1 and 4: pure lower and upper bands, respectively; lanes 2 and 3: the transitions from one component to the other. Lanes are numbered from left to right. C) Purification by MiniGel and hand‐incision, followed by Bio‐Rad Model 422 elution. Lanes 1 and 3: purified CL EF‐G with different quantities; lane 2: mixture of un‐crosslinked and crosslinked; lane 4: purified un‐crosslinked EF‐G; lane 5: marker. D) Purification by activated thiol Sepharose 4B. Lanes 1–3 were analyzed after 1 h, 4 h, and overnight incubation time with the beads, respectively. The final purity was approximately 70 %. E) Purification by maleimide‐activated magnetic beads. Lanes 1–3 were analyzed after 1, 2, and 3 h of incubation time, respectively. The final purity was >90 %. F) Radioactivity measurements by the poly(Phe) assay for the WT and two crosslinked EF‐Gs.
The proper crosslinking was verified by mass spectrometry after PAGE separation and in‐gel tryptic digestion (Figure S2). The activities of these EF‐Gs were measured with the conventional Poly(Phe) assay.17 Figure 1 F shows that in the fast phase of Poly(Phe) synthesis, the rates were in the order of WT>CL11>CL6 (the (PEG)n crosslinked EF‐Gs were denoted as CL6 and CL11 for n=6 and 11, respectively). Extrapolation of the slow phase of the traces suggested that the asymptotic plateaus reached less level for the crosslinked EF‐Gs than that of the WT, indicating that other properties of the EF‐G changed in addition to the effect on kinetics. These experiments demonstrated that conformational restriction would diminish but not completely inhibit the EF‐G catalysis on the Poly(Phe) synthesis.
DNA–mRNA force rulers to determine the power stroke
The experimental approach for detecting the power stroke is shown in Figure 2 A. A series of DNA–mRNA duplexes with 11–17 bp were constructed and immobilized on the surface by biotin–streptavidin interaction, to serve as the force rulers.7 Magnetic beads were conjugated with the ribosome complex on the 5′‐end of the mRNA through an excessively long (19 bp) duplex between the DNA on the beads and the mRNA. The power stroke generated by EF‐G would dissociate the ruler DNA–mRNA duplex if it exceeded the critical force of the duplex, which would result in a significant decrease in the magnetic signal of the sample. Otherwise there would be no significant signal change because the magnetic beads would remain immobilized on the surface. The magnetic signal was detected by an atomic magnetometer reported previously.7
Figure 2.

Magnetic method for measuring the power stroke of crosslinked EF‐Gs. A) Schematic of using DNA–mRNA duplexes as force rulers and magnetic labeling to determine the power stroke. The equal and opposite forces are reminiscent to myosin–actin interaction. B) Plot of remnant magnetic beads versus duplex length for CL11. C) Plot of remnant magnetic beads versus duplex length for CL6. D) Overlay of the EF‐G structures before and after translocation to indicate the extraordinary conformational changes. Red: domain IV; blue: the rest domains.
The critical forces of the DNA–mRNA rulers were determined by FIRMS, in which a centrifugal force was applied to induce dissociation.10 The dissociation was indicated by a sharp decrease in the magnetic signal when the centrifugal force reached the duplex's critical force. Typical FIRMS results for the 13–17 bp duplexes have been obtained previously, which cover the force range of this work. Shown in Figure S3 A, the experimental data were fitted with the prevalent Bell's formula [Eqs. (1), (2)], in which one transition state was postulated.18, 19, 20
| (1) |
| (2) |
In this model, the work of applying a shearing force (f) for a distance (δ) contributes to lower the activation energy barrier (G ≠); k is the dissociation rate constant. The equations were deduced by assuming a linear relationship of both terms with respect to the bp number of the duplex (denoted as n). The terms n 0 and n 1 were implemented to account for the offset from zero in linear regression fitting. These equations predicted the duplex dissociation to be abrupt, regardless of the force exertion time. The fitted G ≠ and δ were 3.44 kcal mol−1 and 0.15 nm, respectively, which were within two‐fold variation compared with abundant literature estimations.21, 22, 23, 24, 25, 26 Therefore, our experimental data agreed well with the theoretical model for force‐induced dissociation.
The time dependence of the mRNA–DNA dissociation obeys a single‐exponential decay [Eq. (3)]:
| (3) |
Here, D 0 and Dt are the initial duplex population and population at time t, respectively. Because time is a parameter in the kinetics fitting, the effect of centrifugal duration was simulated on the experimental data of the 15 bp duplex dissociation. As shown in Figure S3 A, the best fit of the experimental data yielded a A×t value of 1011 for 5 min centrifugal time. This value varied from 109 to 1013 when a hypothetic centrifugal time changed from 0.05 to 500 min. The four orders of magnitude variation in force duration only led to ±8 pN variation in the dissociation force (Figure S3 B). And the dissociation remained as a sharp transition. Therefore, the DNA–mRNA duplexes are robust force rulers for determining the power stroke. In addition, the relationship between critical force and bp value follows an approximately linear function. As shown in Figure S3 C, the relationship of force to n showed a linear relationship (R 2=0.987), which was consistent with the literature.27
Magnetic measurements of the power stroke of crosslinked EF‐Gs
The ribosome pre‐translocation complex, which carried vacant tRNAfmet and ML‐tRNALeu at the P‐ and A‐sites, respectively, was tethered to the surface through the DNA–mRNA duplex at the 3′‐end of the mRNA. Translocation was induced by addition of EF‐G⋅GTP to a final concentration of 2 μm and incubated at 37 °C for 20 min. Only one round of power stroke was generated because no free tRNAs and other necessary components were present.
Upon GTP hydrolysis with CL11 and CL6, the EF‐Gs exerted force on the A‐site tRNA, which chelated to the mRNA via codon–anticodon interaction.4, 16 This force moved the two tRNAs and the mRNA together towards the 5′‐end of the mRNA. Although the actual geometry differed, these interactions and motions were reminiscent to the myosin or kinesin motors moving on their tracks while carrying the polystyrene beads.28, 29 EF‐G, ribosome, and mRNA resembled myosin, polystyrene bead, and actin filaments, respectively. The binding of EF‐G to the ribosome resembled the interaction of myosin and the bead. In addition, the tilting of the myosin lever arm resembled the large conformational change of EF‐G domain IV.
Whereas the actin filaments were deposited on the surface, the mRNA was suspended in the solution and tethered to the surface through an mRNA–DNA duplex as shown in Figure 2 A. The EF‐G power stroke exerted on the tRNA also sheared the mRNA–DNA duplex, as indicated by the arrows in Figure 2 A. This is like the force myosin exerted on its track while moving the bead along the actin filament. The mRNA–DNA duplex will dissociate if the force exceeds its critical force. Consequently, the ribosome complex will be detached from the surface, causing the magnetic signal to decrease as described before.7 On the other hand, the EF‐G‐bound ribosome experiences equal opposite force from the tRNA, and moves toward the 3′‐end of the mRNA, similar to the bead movement in the myosin experiments.
When the length of the DNA–mRNA force ruler is varied, longer force rulers will be dissociated to a less percentage in comparison to the shorter ones, resulting in higher remnant magnetic beads. As shown in Figure 2 B for CL11, the largest n with a substantial signal decrease was 16, indicating the power stroke to be in between the critical forces of the 16 and 17 bp duplexes. This result was similar to that of WT EF‐G that we studied previously using the same method.7 To systematically reveal the power stroke, we used the onset of the slope for the signal decrease (the green dashed lines in Figure 2 B), a method commonly used in mechanical and thermal analyses.30, 31 This approach yielded that n=16.5 was the starting point of duplex dissociation by CL11. Therefore, the power stroke of CL11 was determined to be 90±8 pN, the same as that of WT EF‐G.7 The uncertainty was estimated as half of the force difference between n=16 and 17. This result showed that the (PEG)11 linker did not significantly affect the EF‐G power stroke.
For CL6, however, the first decrease occurred at n=14; no significant change was observed for n=15, 16, and 17 (Figure 2 C). This result showed that the power stroke of CL6 was significantly reduced compared to CL11 and WT. The force value should be between 52 and 62 pN according to the rupture forces of the 14 and 15 bp duplexes, respectively. Analysis of the onset of slope gave n=14.7 (Figure 2 C, green dashed lines). Therefore, the power stroke of CL6 was (59±5) pN. This result indicated that because the short (PEG)6 linker restricted the extension between the EF‐G domains III and IV (Figure 2 D), the power stroke was significantly reduced.
Microscope detection of EF‐G power stroke
Our method of using force rulers to determine power stroke can also be combined with a microscope instead of an atomic magnetometer. The microscopic images are more straightforward for visualizing the effect of power stroke. This method is also simpler to implement compared to the magnetic‐based method, because it does not involve highly specialized sensors. To facilitate particle counting, the concentration of the magnetic beads was reduced to of that in magnetic detection. The number of magnetic beads before and after the exertion of power stroke was counted by using ImageJ,32 instead of being detected as an overall magnetic signal by the atomic magnetometer. Figure 3 shows the microscope images of the sample surfaces of different DNA–mRNA rulers for CL6, CL11, and WT EF‐G. For each sample, images before and after the addition of the corresponding EF‐G were taken by using a 20× objective. The images shown in Figure 3 were of the whole images. The dimensions of each whole image were 0.518×0.416 mm2. The images showed that for CL6, the bead density clearly dropped for up to n=14, whereas for CL11 and WT, up to n=16 was dissociated. The particle disappearance here was the same as the magnetic signal decrease in the magnetic detection method. The visual difference in the images was sufficient to reveal the order of power stroke for the three EF‐Gs.
Figure 3.
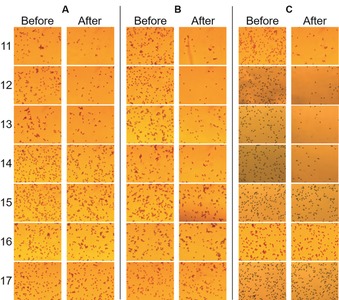
Microscope images for determining the power stroke of crosslinked and wild‐type EF‐Gs. A) CL6, B) CL11, C) WT EF‐G, 11–17: base pair number of the DNA–mRNA rulers.
Particle counting was performed on six images for every sample. The positions of the six field‐of‐views are indicated in Figure S4. The remaining percentages of the beads are plotted in Figure 4, which is scaled to 100 % for no change in particle counts and to 0 % for the maximum particle loss. This normalization procedure did not affect the onset of the signal decrease. A control experiment was also performed, in which EF‐G was absent (black trace in Figure 4). No obvious particle decrease was observed, confirming the particle losses in the samples with EF‐G were mainly due to their respective power stroke. By using the same protocol as in the magnetic detection, we obtained the onsets of signal decrease to be 14.8, 16.7, and 16.3, for CL6, CL11, and WT, respectively. They corresponded to force values of (60±6), (93±8), and (87±8) pN, respectively. Therefore, the results by microscope detection were in excellent agreement with those by magnetic detection. The advantage of magnetic detection is that it measures the whole sample, thus it has a much larger field‐of‐view than microscope detection.
Figure 4.
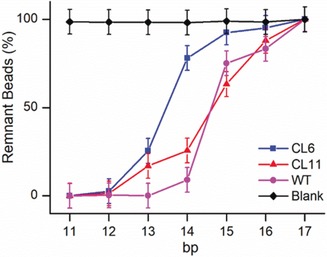
Results of particle counting for the microscope detection of the EF‐G power stroke. Blank was the control with no EF‐G.
To further validate the microscope detection method, we carried out experiments to measure the effect of a ribosome complex being reversely immobilized. In this case, the 5′‐end of the mRNA in the pre‐translocation complex was hybridized with the DNA on the surface. Because of the direction of the power stroke, no bead dissociation should be observed even for a weak ruler. Figure S5 shows the images obtained by using a 12 bp ruler. Particle counting showed no significant change in immobilized beads between before and after adding WT EF‐G, consistent with both the expectation and our previous FIRMS result.7
Modulation of power stroke with fusidic acid
The power stroke may also be affected by other factors. Fusidic acid has been known to bind near the GTP binding pocket of EF‐G to prevent its dissociation for the ribosome.33 The effect of fusidic acid binding on the EF‐G power stroke is shown in Figure 5. The plot was obtained by using the microscope method, with representative images for 12 and 15 bp DNA force rulers. For comparison, EF‐G without fusidic acid was also shown. The complete set of images are shown in Figure S6. The data indicated that significant bead loss was observed for n=14 rulers. The onset of slope was analyzed to be n=15.0, corresponding to a power stroke of (62±5) pN. Therefore, the power stroke of EF‐G bound with fusidic acid was much weaker than of the WT. For comparison, magnetic detection was also performed (Figure S7). The same onset of slope within error, n=15.2, was obtained. Therefore, both microscopic and magnetic detections yielded the same results.
Figure 5.

Reduced power stroke of EF‐G bound with fusidic acid. A) Plot of remnant magnetic beads versus duplex base pairs. WT EF‐G without fusidic acid is also shown for comparison. FA: fusidic acid. B, C) Representative microscope images after the power stroke for the 12 (B) and 15 bp rulers (C).
Role of mechanical force in translocation
We investigated the effect of reduced power strokes on translocation by identifying the exact ribosome movement on the mRNA. The probing scheme is shown in Figure 6 A, which has been used in our previous publications.34, 35 Briefly, the ribosome position was revealed by the number of bp between the exposed mRNA and the probing DNA; the number of bp was deduced from the critical force of the duplexes obtained by FIRMS. In these experiments, the magnetic signal decreasing was induced by the centrifugal force. Single‐nucleotide resolution has been routinely achieved. The pre‐translocation complex (Pre) was indicated by the 15 bp duplex (at ≈62 pN); the post‐translocation complex (Post) was indicated by the 12 bp duplex (at ≈25 pN). The 3 bp difference was caused by the normal translocation step in which three more nucleotides on the mRNA would be covered by the ribosome in the Post and could no longer hybridize with the probing DNA (Figure 6 A, bottom). If frameshifting occurred, we would observe a 13 bp duplex for −1 frameshifting, or a 14 bp duplex for −2 frameshifting, as we have demonstrated in previous publications.34, 35 The results of the ribosome positions and their corresponding percentages are shown in Figure 6 B. The data showed that both WT and CL11 led to complete translocation because only Post was present. For CL6 and fusidic acid‐bound EF‐G, however, only (55±5) % and (53±5) % translocation occurred, respectively. The rest remained as unreacted Pre. Furthermore, no frameshifting (<5 %) was observed in all four experiments, because no 13 or 14 bp duplexes were observed (at the positions indicated by the green dashed lines). The results implied that decrease of EF‐G force reduced the translocation speed but did not interfere with translocation fidelity. Our observations agree with the hypothesis that the ribosome rRNA residues acted as “paws” to maintain the mRNA reading frames.36
Figure 6.
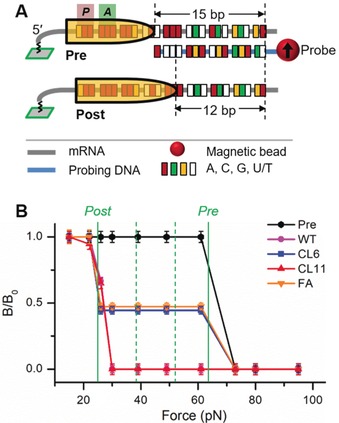
Translocation efficiency probed by FIRMS. A) Probing scheme for translocation of the same ribosome complex as in the power stroke experiments. B) Translocation products for different EF‐Gs. The two solid lines indicate the positions of Post and Pre, respectively. The two dashed green lines indicate the expected positions of “−1” (left) and “−2” (right) frameshifting products. Both were absent in the results.
Discussion
A noninvasive force measurement method with microscope detection is developed
In summary, we have extended the noninvasive force measurement with magnetic detection to a more adaptable microscope detection. The mRNA is tethered to the surface through a DNA–mRNA duplex. The power stroke exerted on the tRNA2–mRNA complex is transduced to shear the DNA–mRNA duplex. Because the ribosome complex is able to move freely in the solution, our force measurement is noninvasive with no additional forces, in contrast to optical tweezers that required applying a force on motor proteins.8 We have confirmed the previously measured EF‐G force with the new method and measured two internal crosslinked EF‐G mutants. Based on Equation (1), a spectrum of force and catalytic rate will reveal the transition‐state distance, which will be obtained in the future. Combined with the currently abundant high‐resolution structures, the value of the transition state distance will shed light to the translocation mechanism.
Force is the sole factor to induce the mRNA–DNA duplex dissociation
The DNA–mRNA duplex paired at the mRNA 3′‐exit site with 15 bp length. After one round of translocation, this duplex was unzipped by 3 bp by the ribosome. Based on the calibration (Figure S3 C), the rupture force would vary from approximately 60 to 25 pN. This force was sufficient to resist thermal fluctuation, which would keep the magnetic signal unchanged in the absence of force. On the other hand, duplex formed three nucleotides away from the mRNA exit site still dissociated under the power stroke, although in this case the mRNA–DNA duplex did not change.7 This experiment showed that force was the sole factor that generated the signal decrease in both magnetic and microscope methods.
Large‐distance Brownian motion has very low probability
In theory, both the Brownian diffusion and power stroke models are compatible with the processive movement of ribosome on the mRNA. Considering an average thermal energy of k B T (≈ mv 2), the most probable traveling distance d of EF‐G under dragging force will be less than 1 Å based on Equation (4), 6
| (4) |
in which kB is the Boltzmann constant, T is temperature, m is the molecular mass, and γ is Stoke's friction coefficient. To achieve 100‐fold longer distance (100 Å), the energy needs to be 10 000‐fold higher, which is about e −10 000 probability based on the Boltzmann distribution [Eq. (5)]:
| (5) |
in which pi is the relative population of molecules at energy level Ei at temperature T. Therefore, the very large conformational change of EF‐G is less likely to be driven by thermal energy and more compatible with a force‐driven process. X‐ray structures indicated a displacement of more than 100 Å movement of domain IV (Figure 1 A), and 37 Å (Figure S1), respectively. Because both results substantially exceeded the average value from Brownian diffusion, the more plausible interpretation would be the power stroke model. Our previous study has provided direct quantification of power stroke that was consistent with the structural results.4, 5 In this report, the correlation of the force magnitude to the conformational change is revealed, which further confirms the power stroke model.
The crosslinked EF‐G with decreased catalytic activity is due to less force generation
As shown in Figure 1 F, conformational restriction of EF‐G compromised the ribosome's capability of synthesizing poly(Phe) peptides, but this assay alone could not reveal the mechanism of the decreased activity. Our force measurements with both magnetic and microscope detections indicate that the conformational restriction led to less force, therefore limited the ribosome translocation. Similarly, the reduced power stroke is probably also the inhibition mechanism of fusidic acid.
Less force does not cause translocation mistake
It is interesting that the less force magnitude in CL6 did not cause frameshifting. Instead, only less percentage of translocation was observed. This result agreed with the structural and kinetic studies in the literature. The structural studies showed dynamic interactions of rRNA residues C1397 and A1503 with the mRNA residues before and during mRNA translocation.4, 31 These residues were hypothesized to be the “paws” to maintain the precise 3 nt mRNA movement. Meanwhile, kinetic studies indicated that the EF‐G caused a rate‐limiting ribosome unlocking step preceding mRNA translocation.37 These results implied that the role of EF‐G was to overcome the activation energy barrier between the pre‐ and post‐translocation states. The consequence is to accelerate the reaction rate, but it does not directly determine the translocation stepping size. Based on this knowledge, our power stroke measurements imply that the force is probably utilized to decrease the activation barrier for a rate limiting intermediate state. It remains unclear how to correlate this transition state to the structures. More investigation on this aspect will be needed in the future to reveal the detailed role of force in ribosomal translocation.
Experimental Section
Materials: Bis‐maleimide‐(PEG)6 and ‐(PEG)11 were purchased from BroadPharm. Act Thiol Sepharose 4B was purchased from GE Healthcare Life Sciences. Maleimide mag beads were purchased from Ocean NanoTech. Streptavidin‐conjugated magnetic beads, Dynabeads M‐280, were purchased from Thermo Fisher. All other reagents were from Sigma.
The FPLC binding buffer contains: Tris (50 mm, pH 7.5) and NaCl (300 mm). The FPLC elution buffer is the same as the binding buffer except with 1 m of imidazole. The protein storage buffer contains: Tris (20 mm, pH 7.5), MgCl2 (10 mm), ethylenediaminetetraacetic acid (EDTA, 0.5 mm), 2‐mercaptoethanol (BME, 4 mm), KCl (40 mm). The PBS (pH 7.4) buffer contains: NaCl (137 mm), KCl (2.7 mm), Na2HPO4 (8 mm), and KH2PO4 (2 mm). The electroelution upper tank buffer contains: Tris (375 mm), glycine (192 mm), and SDS (0.2 %). The lower tank buffer contains: MOPS‐pH 7.2 (50 mm) and EDTA (1 mm). MOPS: 3‐(N‐morpholino)propanesulfonic acid. The TAM10 buffer contains: Tris (20 mm, pH 7.5), Mg(OAc)2 (10 mm), NH4Cl (30 mm), KCl (70 mm), EDTA (5 mm), BME (7 mm), and Tween 20 (0.05 %).
The bi‐cys mutants were introduced via the “GeneArt Site‐Directed Mutagenesis PLUS” kit (Thermo Fisher). The F411C‐Y535C double mutated EF‐G was transformed and expressed in BL21(DE3)pLysE cell (Thermo Fisher), and purified with the “HisTrap HP 5 mL” column on an Akta Purifier FPLC instrument with imidazole gradients (GE Healthcare Life Sciences). The His‐tagged protein eluted around 200 mm imidazole.
Sequences of mRNA and probing DNAs: All nucleic acids were purchased from Integrated DNA Technologies. The mRNA sequence was 3′‐CUC AAG UCG UCA UCU AAA UGC AAA AUU GUA AAA AUA AAG GAA AAA UUA AAU UAA AUU AAU UGU CAA C/TEGBio/‐5′. TEG: an 18‐atom spacer; Bio: biotin (Integrated DNA Technologies). The bold section was complementary to the ruler DNAs; the italic section was covered by the ribosome during power stroke measurement; the underscored section was used to hybridize with the DNA on the magnetic beads. The ruler DNAs were 5′‐/BioTEG/CTC AAG TGC AGT AGA TTT‐3′, 5′‐/BioTEG/CTC AAG AGC AGT AGA TTT‐3′, 5′‐/BioTEG/CTC AAC AGC AGT AGA TTT‐3′, 5′‐/BioTEG/CTC ATC AGC AGT AGA TTT‐3′, 5′‐/BioTEG/CTC TTC AGC AGT AGA TTT‐3′, 5′‐/BioTEG/CTG TTC AGC AGT AGA TTT‐3′, and 5′‐/BioTEG/CAG TTC AGC AGT AGA TTT‐3′. They would form 11–17 bp duplexes with the exposed mRNA, respectively. The bold nucleotides were complementary to the bold ones on the mRNA. The DNA used for conjugating the magnetic beads with the 5′‐end of the mRNA was 5′‐TTA ATT TAA TTA ACA GTT GT30/TEGBio/‐3′. The underscored nucleotides were complementary to the underscored ones on the mRNA. To study translocation efficiency, the probing DNA was 5′‐/BioTEG/GGG CTC ATC AGC AGT AGA TTT A‐3′.
Electrophoresis: For Tris‐Gly PAGE or native gel electrophoresis, we used the Bio‐Rad Mini‐PROTEAN Tetra Cell, Model 491 Prep Cell, Mini‐PROTEAN 3 Multi‐Casting Chamber, or hand cast system. The electroelution was conducted with the Bio‐Rad Model 422 Electro‐Eluter. All the PAGE reagents were from Bio‐Rad. The Novex Sharp Pre‐stained Protein Standard and Precision Plus Protein Kaleidoscope Prestained Protein Standard were from Thermo Fisher and Bio‐Rad, respectively.
EF‐G mutants and crosslinking: The cysteine‐less EF‐G cloned in pET24b was introduced with two cysteine mutations at the Phe411 and Tyr535 (E. coli sequence) positions by using the “GeneArt Site‐Directed Mutagenesis PLUS” kit (Thermo Fisher). The F411C‐Y535C double mutated EF‐G was transformed and expressed in BL21(DE3)pLysE cell (Thermo Fisher), and purified with the “Histrap HP 5ml” column on an Akta Purifier FPLC instrument with gradients (GE Healthcare Life Sciences). The His‐tagged protein eluted around 200 mm imidazole. The protein was concentrated with AmiconUltra centrifugal filters (Millipore), and buffer‐exchanged into the storage buffer via Nap25 desalting column (GE Healthcare Life Sciences). The protein concentration was measured at 260 nm with extinction coefficient of 600 000 cm−1 m −1.
The first step of the crosslinking reaction was to reduce the disulfhydryl groups via twofold of tris(2‐carboxyethyl)phosphine hydrochloride (TCEP) at room temperature for 30 min. Higher TECP amount would cause protein precipitation. Then TCEP was removed by buffer exchange with PBS buffer containing no free thiol group. The bis‐maleimide functionalized crosslinkers were dissolved in dimethyl sulfoxide (DMSO) to form 20 mm stock solution. Then it was added at twofold excess to the protein and reacted for 1 h. The excess crosslinker was then removed by Nap10 desalting column (GE Healthcare Life Sciences) with PBS, and the reaction mixture was subject to either PAGE, Sepharose gel, or magnetic beads purifications.
Preparative separation of CL EF‐G with PAGE: CL EF‐G and un‐crosslinked EF‐G were separated with Bio‐Rad Model 491. Because of the very close R f values of the two bands, only 300–400 pmol of total protein was loaded. The eluted fractions (6 mL/fraction) were concentrated and ran on analytical PAGE. After approximately 10 h, the two bands were eluted with reasonable separation. The separated aliquots were pooled and concentrated. The CL EF‐G fraction was ≈70 % purity, while the un‐crosslinked EF‐G was ≈80 % purity. Because of the long running time, this direct elution method was not practical to generate large amount of pure CL EF‐G.
We then tried electroelution after manually incising the protein bands. The MiniGel running time was ten times less than the Bio‐Rad 491 cylindrical gel (45 min at 200 V). The protein was eluted into 400 μL volume that was sealed with dialysis membrane, using Bio‐Rad Model 422. The elution was approximately 3 h with 10 mA per elution tube. Each elution process consumed incised bands from 12 MiniGels running in parallel, and produced ≈200 pmol of CL EF‐G. The SDS was removed by using the lower tank buffer without SDS followed by buffer exchange to protein storage buffer. Although this method was tedious and difficult to scale up, it was sufficient for mass spectrometry analysis and power stroke study.
Preparative separation of CL EF‐G with gel binding: Two cysteine‐binding gels were used. For act thiol gel binding: 0.25 g of the dried Sepharose powder was swelled with PBS buffer to 1 mL. More buffer was added to transfer the slurry into a Bio‐Rad Mini Bio‐Spin Column. The liquid phase was drained at 100 rpm for 30–60 s in a micro centrifuge. Faster or longer spinning could dry the matrix, which should be avoided. The gel was washed with approximately 5 mL buffer, or until the elution read near 0 at 260 nm on a spectrophotometer. 1 nmol of protein mixture in less than 400 μL was loaded on the column. After the solution completely entered the gel bed, the column was capped at both ends. The binding was incubated at 30 °C for varied durations, and the protein was eluted with 5 mL of PBS buffer. The elution was concentrated to 100–200 μL, and volume of 10× protein storage buffer was added. The protein concentration was measured with a spectrophotometer at 260 nm, and the purity was checked with PAGE. For magnetic beads binding: 50 mg of dried magnetic beads were washed with PBS buffer. The beads were pulled down with a magnetic separator (Thermo Fisher). The supernatant was drained. The washing step was repeated until the spectrometer reading was zero. 1 nmol of the protein mixture in 400 μL was incubated with the beads at room temperature for varied durations. The beads were separated via the magnetic separator. volume of 10× protein storage buffer was added and the protein was concentrated to 100–200 μL. The concentration was measured with the spectrophotometer and the purity was checked with PAGE.
Tryptic digestion and mass spectrometry analysis: CL EF‐G was confirmed by mass spectrometry after tryptic digestion of the incised lower band using In‐Gel Tryptic Digestion Kit (Thermo Fisher). Analysis was carried out on an HPLC‐MS apparatus at the Mass Spectrometry Laboratory at the University of Houston. The HPLC instrument was NanoElute (Bruker). The mass spectrometer was timsTOF Pro (Bruker), with PASEF default method. The data analysis software was Peaks Studio 8.5. The sample concentration of CL6 was approximately 0.11 μg/40 μL.
Formation of ribosome complexes: All the mixtures were in TAM10 buffer. Three mixtures were prepared: the ribosome mix, Tu0G mix, Leu mix. The ribosome mix contains ribosome (1 μm), each of IF1, IF2, IF3 at 1.5 μm, mRNA coding for “ML” at the first two codons (2 μm), charged fMet‐tRNAfMet (4 μm), and GTP (4 mm). The Tu0G mix contained EF‐Tu (6 μm), GTP (4 mm), PEP (4 mm), and pyruvate kinase (0.02 mg mL−1). The Leu mix contained Tris (100 mm, pH 7.5), MgAc2 (20 mm), EDTA (1 mm), ATP (4 mm), BME (7 mm), total synthetase (0.1 mg mL−1), total tRNA (50 A260 mL−1), and leucine (0.25 mm). These mixtures were incubated at 37 °C for 25 min. The ML‐Pre complex was formed by incubating the ribosome mix, Tu0G mix and Leu mix in the volume ratio of 1:2:2, at 37 °C for 2 min. The resulting ribosome complex was added on 1.1 m sucrose cushion and purified by ultra‐centrifuge.
Poly(Phe) assay: Three mixtures were made. 1) The IC mixture contained ribosomes (1 μm), poly(U) (5 μg μL−1) and N‐acetyl phenylalanine‐tRNAPhe (2 μm) in TAM10 buffer; 2) the TuMaster mixture contained EF‐Tu (3 μm), EF‐Ts (4 μm), GTP (0.5 mm), PEP (0.5 mm), and pyruvate kinase (0.006 mg mL−1) in TAM10 buffer. Individual EF‐G assay solution contained the TuMaster ingredients and specific EF‐G (2 μm); 3) The A mixture contained Tris (100 mm, pH 7.5), MgAc2 (20 mm), EDTA (1 mm), ATP (4 mm), BME (7 mm), purified tRNAphe aminoacyl synthetase (33 μg mL−1), 14C labeled phenylalanine (1100 dpm pmol−1) (50 μm), and tRNAphe (5 μm).
All three mixtures were incubated separately at 37 °C for 25 min. Then the ribosome mixture (15 μL), A mixture (15 μL), and EF‐G mixture (28 μL) were gently mixed at 37 °C. At 15 s, 30 s, 1 min, and 5 min, 8 μL Poly(Phe) aliquot was drawn into 0.5 mL ice‐cold 10 % TCA. The TCA solutions were boiled at 90 °C for 10 min and cooled on ice for 30 min. They were then filtered with nitrocellulose filters (Millipore). Each filter was washed with 6 mL ice‐cold trichloroacetic acid (TCA) solution and air dried. The radioactivity of the synthesized poly‐phenylalanine on each filter was measured with a scintillation counter.
Power stroke by magnetic detection: A sample well with dimensions of 4×3×2 mm3 (L×W×D) was glued with a piece of biotin‐coated glass on the bottom surface. Aqueous solution of streptavidin (20 μL, 0.25 mg mL−1) was loaded into the sample well and incubated for 40 min. Then the sample well was rinsed twice with TAM10 buffer. Biotinylated probing DNA strand (20 μL, 1 μm) was added and incubate for 1 h. After rinsing twice with TAM10 buffer, ribosome complexes (20 μL, 0.1 μm) were immobilized on the surface via DNA‐mRNA interaction and incubated for 1.5 h.
The magnetic beads were incubated with the long DNA strand (containing 19 complementary bases with the mRNA) at room temperature for 1 h. A Vortex shaker was used to enhance conjugation. Each initial volume was 1 μL. The initial DNA concentration was 100 μm. The mixture was diluted to 100 μL by TAM10 buffer, so the final concentration of the magnetic beads was approximately 3.2×10⁷ particle mL−1. Excess DNA was washed away by buffer for three times. The DNA‐conjugated beads were then introduced into the sample well and incubated for another 1.5 h. Nonspecifically bound magnetic particles were removed from the surface by applying centrifugal force at 84 g for 2 min. The magnetic signal of the samples was measured by a home‐built atomic magnetometer. Percentages of remnant magnetic beads were obtained by dividing the magnetic signal after EF‐G by the signal before the EF‐G. The percentages were normalized to 100 % for the strongest ruler (17 bp) and 0 % for the weakest ruler (11 bp). Typical error was ±5 %. All experiments were repeated to ensure the reproducibility of the percentage profile, based on which power stroke was extracted.
Power stroke by microscope detection: The sample preparation was the same as in magnetic detection, except the density of magnetic beads was reduced to approximately 6.5×10⁶ particle mL−1 to facilitate particle counting. For each sample well, six images were captured using a 20× objective with an inverted microscope (Amscope, Model ME1400TC). The dimensions of each image were 4098×3288 pixels, equivalent to 0.215 mm2 in area. Subsequently, 2 μL of solution (20 μm EF‐G, 4 mm GTP, 4 mm PEP, 0.2 mg mL−1 PK) in TAM10 buffer was added into the sample well and incubated for 20 min at 37 °C. Both CL6 and CL11 had the same concentration as the WT EF‐G. For the fusidic acid experiment, fusidic acid at 2.5 mm was incubated with WT EF‐G before adding onto the surface. The nonspecifically bound magnetic particles were removed from the surface by applying centrifugal force at 1000 rpm for 2 min. Then another six images were captured for the same sample well. The position of the sample well was maintained the same between before and after adding EF‐G by using a high‐resolution motor (Thorlabs Z725B, resolution: 40 nm). The number of particles on each image was counted by ImageJ. The decreasing percentage was calculated by averaging the six images, and scaled to 100 % for the strongest ruler (17 bp) and to 0 % for the weakest ruler (11 bp). Typical error in percentage was ±7–8 %, which was greater than that of magnetic detection. Surface inhomogeneity was probably one of the main reasons for the error.
Translocation efficiency by FIRMS: Magnetic signal of the samples was measured by an atomic magnetometer as a function of mechanical forces. The atomic magnetometer had a sensitivity of ≈200 fT/(Hz)1/2. The force was provided by a centrifuge (Eppendorf, Model 5427R). The dissociation of the DNA‐mRNA duplexes was indicated by a decrease in the magnetic signal, which occurred when the centrifugal force reached the dissociation force of the DNA‐mRNA duplex. The typical force range in this work was 90 pN, after which the residual magnetic signal was taken as the background. The FIRMS profiles were obtained by normalizing the overall magnetic signal decrease (B 0) to be 100 % and then plotting the relative magnetic signal decrease (B/B 0) versus the external force. The force values were calculated according to mω 2 r, in which m is the buoyant mass of M280 magnetic beads (4.6×10⁻¹⁵ kg), ω is the centrifugal speed, and r is the distance of the magnetic beads from the rotor axis (7.5 cm for 5427R). The typical force resolution was 3–4 pN in this work. Each profile reported in this work was repeated at least three times to ensure reproducibility.
Conflict of interest
The authors declare no conflict of interest.
Supporting information
As a service to our authors and readers, this journal provides supporting information supplied by the authors. Such materials are peer reviewed and may be re‐organized for online delivery, but are not copy‐edited or typeset. Technical support issues arising from supporting information (other than missing files) should be addressed to the authors.
Supplementary
Acknowledgements
This work was supported by the National Institutes of Health (R01GM111452, Y.W., S.X.) and the Welch Foundation to Y.W. (E‐1721). We thank Drs. Guoting Qin and Chengzhi Cai for their technical support at the Mass Spectrometry Laboratory of the Chemistry Department of the University of Houston.
H. Yin, M. Gavriliuc, R. Lin, S. Xu, Y. Wang, ChemBioChem 2019, 20, 2927.
Contributor Information
Prof. Shoujun Xu, Email: sxu7@uh.edu.
Prof. Yuhong Wang, Email: ywang60@uh.edu.
References
- 1. Dunkle J. A., Cate J. H. D., Annu. Rev. Biophys. 2010, 39, 227–244. [DOI] [PubMed] [Google Scholar]
- 2. Katunin V. I., Savelsbergh A., Rodnina M. V., Wintermeyer W., Biochemistry 2002, 41, 12806–12812. [DOI] [PubMed] [Google Scholar]
- 3. Achenbach J., Nierhaus K. H., Biochimie 2015, 114, 80–89. [DOI] [PubMed] [Google Scholar]
- 4. Zhou J., Lancaster L., Donohue J. P., Noller H. F., Science 2014, 345, 1188–1191. [DOI] [PMC free article] [PubMed] [Google Scholar]
- 5. Lin J., Gagnon M. G., Bulkley D., Steitz T. A., Cell 2015, 160, 219–227. [DOI] [PMC free article] [PubMed] [Google Scholar]
- 6. Moore P. B., Annu. Rev. Biophys. 2012, 41, 1–19. [DOI] [PubMed] [Google Scholar]
- 7. Yao L., Li Y., Tsai T.-W., Xu S., Wang Y., Angew. Chem. Int. Ed. 2013, 52, 14041–14044; [DOI] [PubMed] [Google Scholar]; Angew. Chem. 2013, 125, 14291–14294. [Google Scholar]
- 8. Liu T., Kaplan A., Alexander L., Yan S., Wen J. D., Lancaster L., Wickersham C. E., Fredrick K., Noller H. F., Tinoco I., Bustamante C., eLife 2014, 3, e03406. [DOI] [PMC free article] [PubMed] [Google Scholar]
- 9. Chen C., Cui X., Beausang J. F., Zhang H., Farrell I., Cooperman B. S., Goldman Y. E., Proc. Natl. Acad. Sci. USA 2016, 113, 7515–7520. [DOI] [PMC free article] [PubMed] [Google Scholar]
- 10. De Silva L., Yao L., Wang Y., Xu S., J. Phys. Chem. B 2013, 117, 7554–7558. [DOI] [PubMed] [Google Scholar]
- 11. Albrecht C., Blank K., Lalic-Multhaler M., Hirler S., Mai T., Gilbert I., Schiffmann S., Bayer T., Clausen-Schaumann H., Gaub H. E., Science 2003, 301, 367–370. [DOI] [PubMed] [Google Scholar]
- 12. Albrecht C. H., Clausen-Schaumann H., Gaub H. E., J. Phys. Condens. Matter 2006, 18, S581-S599. [Google Scholar]
- 13. Neuert G., Albrecht C. H., Gaub H. E., Biophys. J. 2007, 93, 1215–1223. [DOI] [PMC free article] [PubMed] [Google Scholar]
- 14. Wilson K. S., Noller H. F., Cell 1998, 92, 131–139. [DOI] [PubMed] [Google Scholar]
- 15. Hansson S., Singh R., Gudkov A. T., Liljas A., Logan D. T., J. Mol. Biol. 2005, 348, 939–949. [DOI] [PubMed] [Google Scholar]
- 16. Gao Y. G., Selmer M., Dunham C. M., Weixlbaumer A., Kelley A. C., Ramakrishnan V., Science 2009, 326, 694–699. [DOI] [PMC free article] [PubMed] [Google Scholar]
- 17. Altuntop M. E., Ly C. T., Wang Y., Biophys. J. 2010, 99, 3002–3009. [DOI] [PMC free article] [PubMed] [Google Scholar]
- 18. Bell G. I., Science 1978, 200, 618–627. [DOI] [PubMed] [Google Scholar]
- 19. Evans E., Ritchie K., Biophys. J. 1997, 72, 1541–1555. [DOI] [PMC free article] [PubMed] [Google Scholar]
- 20. Oberbarnscheidt L., Janissen R., Oesterhelt F., Biophys. J. 2009, 97, L19-L21. [DOI] [PMC free article] [PubMed] [Google Scholar]
- 21. Evans E., Ritchie K., Biophys. J. 1999, 76, 2439–2447. [DOI] [PMC free article] [PubMed] [Google Scholar]
- 22. Green N. H., Williams P. M., Wahab O., Davies M. C., Roberts C. J., Tendler S. J., Allen S., Biophys. J. 2004, 86, 3811–3821. [DOI] [PMC free article] [PubMed] [Google Scholar]
- 23. Ikuta S., Takagi K., Wallace R. B., Itakura K., Nucleic Acids Res. 1987, 15, 797–811. [DOI] [PMC free article] [PubMed] [Google Scholar]
- 24. Mosayebi M., Louis A. A., Doye J. P., Ouldridge T. E., ACS Nano 2015, 9, 11993–12003. [DOI] [PubMed] [Google Scholar]
- 25. Rauzan B., McMichael E., Cave R., Sevcik L. R., Ostrosky K., Whitman E., Stegemann R., Sinclair A. L., Serra M. J., Deckert A. A., Biochemistry 2013, 52, 765–772. [DOI] [PubMed] [Google Scholar]
- 26. Zhang W., Chen S. J., Biophys. J. 2006, 90, 778–787. [DOI] [PMC free article] [PubMed] [Google Scholar]
- 27. Hatch K., Danilowicz C., Coljee V., Prentiss M., Phys. Rev. E Stat. Nonlin. Soft Matter Phys. 2008, 78, 011920. [DOI] [PubMed] [Google Scholar]
- 28. Sheetz M. P., Spudich J. A., Nature 1983, 303, 31–35. [DOI] [PubMed] [Google Scholar]
- 29. Block S. M., Goldstein L. S., Schnapp B. J., Nature 1990, 348, 348–352. [DOI] [PubMed] [Google Scholar]
- 30. Menard H. P., Dynamic Mechanical Analysis: A Practical Introduction , 2nd ed., 2008, CRC Press, Boca Raton. [Google Scholar]
- 31. Kleinschmidt A. T., Lipomi D. J., Acc. Chem. Res. 2018, 51, 3134–3143. [DOI] [PMC free article] [PubMed] [Google Scholar]
- 32. Schneider C. A., Rasband W. S., Eliceiri K. W., Nat. Methods 2012, 9, 671–675. [DOI] [PMC free article] [PubMed] [Google Scholar]
- 33. Noller H. F., Lancaster L., Mohan S., Zhou J., Q. Rev. Biophys. 2017, 50, e12. [DOI] [PubMed] [Google Scholar]
- 34. Tsai T.-W., Yang H., Yin H., Xu S., Wang Y., ACS Chem. Biol. 2017, 12, 1629–1635. [DOI] [PMC free article] [PubMed] [Google Scholar]
- 35. Yin H., Xu S., Wang Y., RNA Biol. 2018, 15, 1392–1398. [DOI] [PMC free article] [PubMed] [Google Scholar]
- 36. Zhou J., Lancaster L., Donohue J. P., Noller H. F., Science 2013, 340, 1236086. [DOI] [PMC free article] [PubMed] [Google Scholar]
- 37. Savelsbergh A., Katunin V. I., Mohr D., Peske F., Rodnina M. V., Wintermeyer W., Mol. Cell 2003, 11, 1517–1523. [DOI] [PubMed] [Google Scholar]
Associated Data
This section collects any data citations, data availability statements, or supplementary materials included in this article.
Supplementary Materials
As a service to our authors and readers, this journal provides supporting information supplied by the authors. Such materials are peer reviewed and may be re‐organized for online delivery, but are not copy‐edited or typeset. Technical support issues arising from supporting information (other than missing files) should be addressed to the authors.
Supplementary