

Abstract
The use of evidence from clinical trials to support decisions for individual patients is a form of “reference class forecasting”: implicit predictions for an individual are made on the basis of outcomes in a reference class of “similar” patients treated with alternative therapies. Evidence based medicine has generally emphasized the broad reference class of patients qualifying for a trial. Yet patients in a trial (and in clinical practice) differ from one another in many ways that can affect the outcome of interest and the potential for benefit. The central goal of personalized medicine, in its various forms, is to narrow the reference class to yield more patient specific effect estimates to support more individualized clinical decision making. This article will review fundamental conceptual problems with the prediction of outcome risk and heterogeneity of treatment effect (HTE), as well as the limitations of conventional (one-variable-at-a-time) subgroup analysis. It will also discuss several regression based approaches to “predictive” heterogeneity of treatment effect analysis, including analyses based on “risk modeling” (such as stratifying trial populations by their risk of the primary outcome or their risk of serious treatment-related harms) and analysis based on “effect modeling” (which incorporates modifiers of relative effect). It will illustrate these approaches with clinical examples and discuss their respective strengths and vulnerabilities.
Introduction
Austin Bradford Hill, the epidemiologist who formalized randomized clinical trial (RCT) methods, noted in the 1960s that although RCTs can determine the better treatment on average, they “do not answer the practicing doctor’s question: what is the most likely outcome when this particular drug is given to a particular patient?”1 But, if not with an RCT, how can we forecast outcomes in individuals under alternative treatments?
Kahneman and others have described two distinct approaches to single case prediction, the “inside view” and the “outside view.”2 3 The inside view considers a problem by focusing on the specifics of each case and understanding the many characteristics that make it unique. It is the view prioritized by “traditional” physicians who emphasize clinical experience and expert judgment and the view we spontaneously adopt for making decisions in virtually all aspects of life. By contrast, the outside view predicts by explicitly identifying a group of similar cases (a “reference class”) and ignoring some potentially important particulars; the reference class provides a statistical basis for prediction. This is referred to as “reference class forecasting.”
The central premise of evidence based medicine (EBM) is the recognition that Hill’s assertion was (at least partially) wrong: RCTs can be used to guide clinical decision making for individuals. In emphasizing this, RCTs were repurposed from tools to establish causality into tools for prediction, through reference class forecasting, in individual patients. There is now a wealth of evidence—in medicine and other fields—that predictions based on the inside view (even by “experts”) are vulnerable to all manner of cognitive biases, and that prioritizing impersonal data generally improves decision making.2 4 EBM has become the dominant paradigm both for medical decision making and for clinical practice guidelines.
Nevertheless, it is easy to recognize that Hill’s view was, in part, right. The result of a positive RCT only provides evidence that at least some of the enrolled patients benefited from the intervention. Logically, the impact this knowledge has on decision making in an individual (even one qualifying for the trial) is unclear when treatments can have very different effects in different patients. For example, thrombolysis in acute ischemic stroke can improve functional outcomes (through recanalization) but also worsen functional outcomes (through intracerebral hemorrhage); angiotensin converting enzyme inhibitors can prevent progression of renal insufficiency but can also cause it in some patients; antihypertensives prevent serious cardiac events but can also cause them; bisphosphonates can prevent fracture from osteoporosis but can also cause them5; carotid endarterectomy for symptomatic carotid stenosis can prevent strokes but can also cause them.6 Moreover, individual patients have many characteristics that might affect the likelihood of an outcome and the benefits or harms of treatment. Determining the best treatment for a given patient, the task of a clinician, is thus very different from determining the best treatment on average.
Thus, interest in understanding how a treatment’s effect varies across patients—a concept described as heterogeneity of treatment effects (HTE)—has been growing. This concept is central to the agenda for both personalized (or precision) medicine and comparative effectiveness research. HTE has been defined as non-random variability in the direction or magnitude of a treatment effect, in which the effect is measured using clinical outcomes.7 Despite this definition, the broad concept of HTE accommodates different perspectives8 and different goals,9 which have at times confused discussions.10
In this article, we focus on what we consider the most essential goal of HTE analysis for clinical decision making: prediction in the individual patient of outcomes under alternative treatments. Although we discuss fundamental difficulties in the prediction of treatment effects for individuals, we emphasize this goal because HTE analysis is of little value if it does not improve our ability to make predictions and decisions one patient at a time. Below, we discuss: fundamental difficulties with the prediction of “individual” risk and treatment effect common to all approaches; limitations of conventional (one-variable-at-a-time) subgroup analysis; and several different regression based approaches to “predictive” HTE analysis.
Sources and selection criteria
This narrative review provided background for a larger project supported by both a 14 member technical expert panel and an evidence review committee. We used our extensive libraries for the review of basic epidemiological and statistical concepts relevant to HTE. For emerging methods related to predictive approaches to HTE, articles recommended by the technical expert panel and two targeted systematic searches by the evidence review committee were also used. The aims were to discover consensus based methodological recommendations for predictive HTE analysis in RCTs and to identify methodological papers evaluating regression based approaches to predictive HTE analysis. Key search terms included “heterogeneity of treatment effect”, “treatment effect”, “regression”, “statistical models”, “randomized controlled trials” (as topic), and “precision medicine”. These search terms were combined using appropriate Boolean operators to yield 2851 abstracts, which were hand searched. The evidence review committee prepared an annotated bibliography (see supplemental table 1).
Conceptual background
Although the goal of predictive HTE analysis is to improve the prediction of the treatment effect and decision making in each patient,9 11 we acknowledge that this enterprise has fundamental limitations. Both risks and treatment effects can be determined only at the group level.12 13 14 15 Indeed, under a deterministic framework (that is, when outcomes in patients are viewed as being fully determined by prior causes and conditions), given complete knowledge, the only “true risk” for an individual would be either 0 or 1 for a binary outcome (such as death), and risk prediction should be regarded as a quantification of the limits of our knowledge, rather than an intrinsic property of the patient. Even if we accept the existence of a “true” risk for an individual (that is, a fundamentally stochastic universe), this true risk cannot be directly measured. Instead, a person’s risk is estimated by examining the frequency of outcomes in a group of other “similar” patients. But because similarity can in practice always be defined in many different ways (as we will discuss), a person’s risk cannot typically be uniquely determined; rather, it is a “model dependent” property.14 15
The prediction of treatment effect in individual patients is even more challenging than prediction of outcomes. This is because treatment effects at the person level are inherently unobservable even in retrospect; outcomes under two counterfactual treatment conditions cannot be ascertained in the same person simultaneously. Thus, predicting treatment effect, and evaluating models that predict treatment effect, is fundamentally different from (and more difficult than) predicting outcome risk, because we are attempting to predict an “outcome” (that is, the difference in potential outcomes, with and without treatment) that is only partially observable in any patient.
Thus, both risk and the prediction of treatment effect must rely on assigning patients to groups (reference classes) to which the individual of interest is similar. But how can similarity be defined? Mathematician John Venn pointed out in 1876 that “every single thing or event has an indefinite number of properties or attributes observable in it, and might therefore be considered as belonging to an indefinite number of different classes of things.”16 Alternative methods of classifying patients will lead to different inferences for any given patient. This “reference class problem” has been subject to much discussion in other fields but has received surprisingly scant attention in the EBM literature.
The approach of EBM to the reference class problem has generally been to emphasize the broad reference class of the RCT population. Guyatt and colleagues’ classic User’s Guide to the Medical Literature II stated: “if the patient meets all the inclusion criteria, and doesn’t violate any of the exclusion criteria—there is little question that the results are applicable.”17 The enthusiasm for pragmatic trials, enrolling ever broader populations, represents an extrapolation of the view that broad based populations provide the most useful reference class for clinical decisions.18
Another approach to the reference class problem was suggested by Reichenbach, the theorist who first coined the term. He recommended calibration to “the narrowest reference class for which reliable statistics can be compiled,”19 but matching on just 10 binary characteristics gives rise to more than 1000 distinct subgroups (and 20 binary characteristics give rise to more than a million). Thus, this approach is limited by the problem of small samples, leaving the reference class problem unresolved. The narrowest possible class is the patient himself or herself, who is unique; the uniqueness of each case is why medicine at times becomes an improvisational, “inside view” enterprise so dependent on “clinical intuition.” What is needed is a principled way of prioritizing relevant patient characteristics.
The selection of an appropriate reference class is the central problem when using group evidence to forecast outcomes (or treatment effects) in individuals.20 The mapping of an individual to a group of similar (but non-identical) patients always requires (implicitly or explicitly) a model or scheme, whether that be the inclusion criteria of the overall trial or some narrower classification scheme. In this article we will review three broad analytic approaches used to derive more personalized treatment effect estimates: conventional (one-variable-at-a-time”) subgroup analysis, risk based subgroup analysis (or risk modeling), and treatment effect modeling.
Conventional subgroup analysis
The most common approach to HTE analysis is to divide patients serially on the basis of single characteristics defined at baseline (such as male v female; old v young) and to serially test whether the treatment effect varies across the levels of each attribute. The literature and guidance on the conduct of subgroup analyses is extensive (and largely pejorative).21 22 23 24 25 26 27 28 29 30 31 32 33 34 Nevertheless, subgroups remain routinely reported, often in the form of forest plots (fig 1). Understanding these analyses and their limitations is central to the understanding of predictive HTE analysis.
Fig 1.

35 HRs (black squares) and 95% confidence intervals (horizontal lines) for the primary outcome for PCI versus medical therapy for subgroups are shown. Despite what seems to be clinically significant differences in treatment effects across several variables (eg, qualitative interactions for both age and sex), no statistically significant interaction was found between treatment and any of the subgrouping variables, indicating “consistency of effects across clinical significant subgroups.” The discrepancy between the apparent clinical importance of the observed effect heterogeneity and the lack of statistical significance reflects the very low statistical power for interaction effects, which is typical of most trials. (B) The DANAMI-2 trial also showed “consistency of effects” across all subgroups for the primary composite endpoint of death, reinfarction, or disabling stroke in 1572 patients randomly assigned to primary angioplasty versus fibrinolysis.36 Despite the similarity of effects in these one-variable-at-a-time subgroup analyses, a subsequent risk stratified analysis,37 using the TIMI (mortality) risk score, showed that patients who are at low risk of mortality are less likely to benefit than those at high risk, particularly on the clinically important absolute risk difference scale. Indeed, for the outcome of mortality, there was a slight trend for harm among the three quarters of patients at lowest risk and a very large benefit for the quarter of patients classified as high mortality risk (see fig 5). Conventional subgroup analyses, such as those described in this forest plot, can miss these clinically important differences because, when patients are serially divided into groups defined one-variable-at-a-time, each analysis grossly under-represents the heterogeneity across individual patients who differ from one another in many variables simultaneously. These analyses also obscure variation in treatment effect on the risk difference scale, which is the most important scale to assess clinically. Abbreviations: ACE: angiotensin converting enzyme; DANAMI-2: Danish Multicenter Randomized Study on Fibrinolytic Therapy Versus Acute Coronary Angioplasty in Acute Myocardial Infarction; LAD: left anterior descending; MI: myocardial infarction; OAT: Occluded Artery Trial; PCI: percutaneous coronary intervention.
Why most positive subgroup analyses are false
It is often emphasized that the appropriate statistical method for assessing HTE is to test for the contrastin effects among the levels of a baseline variable with a statistical test for interaction.38 39 40 41 This typically compares the relative risk (or the odds ratio or hazard ratio) across the levels of the subgrouping variable and corresponds to the epidemiologic concept of effect modification. A common mistake is to claim heterogeneity on the basis of separate tests of treatment effects within each subgroup22 23—for example, when a P value reaches statistical significance in one group (say, men) but not in another (say, women).
However, even when adhering to the recommended practice of performing interaction tests, the credibility of “statistically significant” subgroup effects should be regarded cautiously. Several recent meta-epidemiological studies have shown that very few are corroborated in subsequent studies.24 42 43 A recent empirical evaluation of sex-by-treatment interactions in 109 topics found only eight (7%) with statistically significant sex-by-treatment interactions42—a result that was not much greater than what would be expected by chance if relative effects between the sexes were always identical. These results suggest that most statistically significant subgroup effects represent false discoveries.24 Well known examples of misleading positive subgroup analyses include not just the influence of astrological signs on the effects of aspirin for patients with myocardial infarction,44 but far more plausible and therefore more harmful results (eg, aspirin is ineffective in secondary stroke prevention in women,45 beta blockers are ineffective in inferior wall myocardial infarction).22 46
The low credibility of positive subgroup results is understandable because RCTs are powered for the main effect of treatment; at least four times the sample size would be needed to provide similar power for an interaction effect of similar magnitude (eg, for a relative odds ratio equal to the odds ratio of the main effect), even for a perfectly balanced subgroup. Alternatively phrased, these interaction effects are anticipated to be powered at about 30% for perfectly balanced subgroups (eg, males v females) in trials powered at 80% for the main treatment effect,38 47 and less for unbalanced subgroups or for smaller effects. Moreover, because subgroup analyses are typically viewed as being without cost, they are often performed promiscuously across variables, with far less previous evidence than for the main effect in a RCT (which is typically not undertaken without a reasonable probability of success). The combination of a low proportion of anticipated true effects and low power explains the high proportion of false discoveries among “statistically significant” effects (fig 2). Thus, subgroup analyses generally provide the essential conditions for the reliable generation of false discoveries: weak theory and noisy data—that is, exploratory analyses testing multiple hypotheses performed in databases with low power.48 50 In addition to false discovery, effect exaggeration—that is, “testimation bias” (also known as the “winner’s curse”)49 51—can be anticipated because overestimated effects are preferentially selected through the use of a statistical criterion (such as a P value threshold). These two concerns are important not only in conventional subgroup analysis, but also when considering how best to develop multivariable prediction models to estimate effects for individual patients, which is the focus of this article.
Fig 2.

Why most positive subgroup effects are false or overestimated. The well known unreliability of subgroup analysis arises from the fact that interaction tests typically have weak power when performed in randomized clinical trials designed to have 80% or 90% power to detect main treatment effects, and also by the fact that multiple poorly motivated subgroups are typically evaluated.48 “Exploratory” analyses are depicted by the distributions on the left, in which subgroup analyses are undertaken across multiple variables to detect the 5% that represent true effect modification (shown in red). This prevalence of “true effects” was chosen to emulate previous meta-epidemiologic studies.42 Assuming 30% power to detect interaction effects,38 47 only a minority of these true effects (1.5/5=30%) are anticipated to show statistically significant effects. Meanwhile, with an α of 0.05 (P value threshold), 5% of the null variables (shown in black) are also anticipated to be statistically significant (5/95=4.8%). Thus, only a minority of results with a P value <0.05 (1.5/6.3 of the effect estimates falling to the right of the blue threshold) represent true subgroup effects. The false discovery rate is much lower when only variables with a higher prior probability are tested. The distribution on the right depicts “confirmatory” analyses with a prior probability of 25%. Here, about two thirds of subgroups with a P value <0.05 (7.5/11.3) are anticipated to represent true effects. Even then, subgroup effects will generally be overestimated because exaggerated effects are preferentially identified. This exaggeration of effects has been referred to as “testimation bias” because it arises when hypothesis testing statistical approaches (eg, for biomarker discovery) are combined with effect estimation.49
Why claims of “consistency of effect” are often misleading
Results similar to those shown in fig 1 (in which none of the tested subgroup interaction effects reach statistical significance) are often the basis for claims of “consistency of effects.” However, because trials are usually underpowered for subgroup analyses, the inability to find significant interactions should be anticipated. For example, fig 1A (the Occluded Artery Trial35) shows how clinically significant differences in effects between men and women and between young and old patients may not be statistically significant, even in large trials, and even when the point estimate of these effects is qualitatively different (harm in one stratum and benefit in another). Additionally, even when results seem to be highly consistent across “clinically important subgroups” (as in the Danish Multicenter Randomized Study on Fibrinolytic Therapy Versus Acute Coronary Angioplasty in Acute Myocardial Infarction (DANAMI-2) trial; fig 1B), null subgroup analyses do not imply that benefit-harm trade-offs are likely to be similar across all trial enrollees or that the overall treatment effect applies similarly across trial subjects. Indeed, a core assumption of personalized medicine is that, at the person level, HTE is ubiquitous (some patients benefit and others don’t, and this is not totally random).13 52 Because one-variable-at-a-time subgroup analyses compare groups of patients who differ systematically on only a single variable, whereas individual patients differ from one another across many variables simultaneously, the conventional approach greatly under-represents the heterogeneity clinicians observe clinically (that is, at the person level). Subgrouping schemes, defined more comprehensively across many clinically salient variables simultaneously, may detect important differences in treatment effects that are obscured in conventional subgroup analysis.53 Indeed, clinically important HTE was subsequently identified in the DANAMI-2 trial when a risk modeling approach was applied.37
Why conventional subgroup analyses are incongruent with the goals of predictive HTE analysis
Conventional subgroup analysis may detect “relative effect modification.” This can help inform theories about conditions under which treatments are especially effective or ineffective. However, this approach does not directly address the reference class problem—that all patients belong to multiple different subgroups, each of which may yield different inferences. For example, even assuming the that subgroup effects shown for both age and sex in the Occluded Artery Trial (fig 1A) are wholly credible, the optimal treatment for a young woman (or an old man) would be unclear. Because a patient has an indefinite number of attributes and can thus belong to an indefinite number of different reference classes, there are as many probabilities for a given patient (and by extension estimable treatment effects) as there are specifiable classes.
The application of conventional subgroup analysis to clinical decision making is further complicated because HTE is typically tested (and presented) on a relative scale (eg, odds ratio or relative risk), whereas the absolute risk difference (RD) scale (or its inverse, number needed to treat (NNT)) is the most important scale for clinical decision making.13 54 55 56 Although the literature sometimes emphasizes the distinction between “predictive factors” (relative effect modifiers) and “prognostic factors,” this distinction is somewhat artificial and can be as confusing as it is clarifying. This is because prognostic factors are “predictive” (that is, effect modifying) when effect is considered on the clinically important absolute scale, and predictive factors typically have “prognostic” effects that complicate clinical interpretation. For clinical decision making, prognostic and predictive effects should be considered simultaneously, because the ARD is a product of both the outcome risk and the relative treatment effect (fig 3). Thus, the presence of statistically significant heterogeneity on the relative scale does not necessarily imply clinically important HTE, which should always be assessed on the ARD scale (fig 3). Indeed, prognostic modeling can often reveal clinically important HTE, because differences in outcome risk are just as important as similar changes in relative risk when determining the ARD. Moreover, prognostic factors are much easier to model than relative effect modifiers, given abundant prior knowledge and much greater statistical power for main effect analyses rather than tests for interaction.
Fig 3.

The value of a marker for targeting of treatment depends on its influence both on outcome risk and on relative treatment effect. The domain along the x axis quantifies prognostic effects; the range along the y axis quantifies relative effect modification (sometimes called “predictive” effects). The clinically significant effect measure (absolute risk difference or number needed to treat (NNT)) is depicted by the contour plot. The average effect in the overall trial is shown by the large red dot, which can be disaggregated into subgroups (shown by the smaller black and white dots) in different ways. Both pure prognostic markers (which scatter patient subgroups horizontally) and pure relative effect modifying (“predictive”) markers (which scatter patient subgroups vertically) help discriminate patient groups with different degrees of absolute benefit. Asymmetry of the scatter represents the usual non-normal distribution of risk (here shown as log normal, with a greater number of low risk and low benefit patients). Generally, “predictive” markers are more difficult to identify than prognostic markers, both because reliable information about effect modifiers is usually scant and because power to examine treatment effect interactions is substantially lower than prognostic effects. However, factors are often both prognostic and relative effect modifying, and these effects may be “synergistic” (relative risk reduction and outcome risk positively correlated) or “antagonistic” (relative risk reduction and outcome risk negatively correlated). The most useful factor for treatment selection is that for which the absolute risk difference most varies as a function of that factor’s value (here, the “synergistic” example). This corresponds to improved discrimination for treatment benefit on the risk difference scale. Note that for the factor with antagonistic effects, patients with the largest relative treatment effect paradoxically benefit the least on the absolute scale. From a decision analytic perspective, the clinical value of the marker is determined by its ability to distribute patients across a decisionally important threshold, which depends on the treatment burden (accounting for patient preferences, adverse effects, and costs). These decision thresholds are represented by the contours
Limitations of guidance for subgroup analysis
Guidance for analyzing, reporting, and interpreting subgroup analysis typically includes key recommendations13: subgroups should be fully defined a priori (to prevent data dredging); be limited in number (or corrected for multiplicity, or both); be well motivated by clinical reasoning or previous empirical studies; be in the expected (and pre-specified) direction9 22; be supported by formal tests for interaction; and be fully reported and cautiously interpretted.21 22 30 57 58 59 It has also been recommended that the type of subgroup analysis (eg exploratory (fun to look at) or confirmatory (potentially actionable)) should be specified.9 56 60 A further refinement is the development of an instrument to help evaluate the credibility of any positive subgroup effects.21 30 61
Although this guidance thoughtfully deals with one aspect of the central dilemma of subgroups—the risk of a falsely positive subgroup—it mostly ignores the other term: the risk of overgeneralizing summary results to all patients who meet the enrollment criteria. Although the potential importance of HTE is increasingly recognized,34 62 63 64 65 66 trialists, peer reviewers, and regulators have very little guidance on which subgroup analyses should be routine, expected, and necessary for the results to be considered fully and transparently reported.
Predictive approaches to heterogeneous treatment effects
Predictive approaches to HTE are intended to ameliorate many of the above limitations of one-variable-at-a-time subgroup analysis. The goal of predictive HTE analysis is to develop models that can be used to predict which of two or more treatments will be best for individual patients when multiple variables that influence the benefits or harms of treatment are taken into account. We divide this type of analysis into two subcategories:
Firstly, risk modeling: an approach to predictive HTE analysis whereby a multivariable model (either externally or internally developed) that predicts the risk of an outcome (usually the primary study outcome) is applied to disaggregate patients in trials so that treatment effects can be examined across risk groups
Secondly, treatment effect modeling (or “effect modeling”): an approach to predictive HTE analysis that develops a model directly on trial data to predict treatment effects (that is, the difference in outcome risks under two alternative treatment conditions). Unlike risk modeling, such a model incorporates a term for treatment assignment and permits the inclusion of treatment by covariate interaction terms.
Risk modeling
We have previously proposed a framework for risk modeling that prioritizes the reporting of relative and absolute treatment effects across risk strata for the primary trial outcome and suggests that these should be routinely reported.56 Why should outcome risk be prioritized as a subgrouping variable over other variables, such as age, sex, or comorbidities? Unlike other variables that may or may not modify treatment effect, outcome risk is a mathematical determinant of treatment effect. Table 1 shows the definition of several different measures of treatment effect. All of these measures depend on the outcome rate in the control group (the control event rate; CER), which is itself an observable proxy for outcome risk. Because outcome risk typically varies substantially in a trial population when risk is described through a combination of factors,67 the CER will also vary across the trial population when it is disaggregated with a prediction model. Except when trials have null effects, the ARD will generally vary when CER varies across the population (fig 3). Mathematically, only one measure of treatment effect (at most) can remain consistent when risk varies across the population.
Table 1.
Treatment effect is mathematically dependent on the control event rate*
| Measure | Definition |
|---|---|
| Absolute risk difference | CER-EER |
| Relative risk reduction | 1-(EER/CER) |
| Odds ratio | EER/(1-EER) ÷ CER/(1-CER) |
CER: control event rate; EER: experimental event rate.
Figure 4 shows the 30 day mortality risk estimates for 1058 patients with ST elevation myocardial infarction based on pretreatment clinical and electrocardiographic variables.69 The risk of mortality in the quarter of patients at highest risk is about 16 times higher than it is in the quarter at lowest risk. Doctors know (and simple algebra confirms) that for interventions that carry some risk of serious treatment related harm, benefit-harm trade-offs differ in patients at such different risks of mortality. However, it is common practice in research to aggregate these patients together in a trial and emphasize the overall summary results, thereby obscuring whether the differences in treatment effect across risk categories are clinically important. Thus, our view is that trial results are incompletely disclosed unless both outcome rates and treatment effects across risk groups are described.56 66 70 71
Fig 4.

Distribution of mortality risk. This distribution displays the predicted mortality risk in 1058 patients who received reperfusion therapy for ST elevation myocardial infarction at 28 US hospitals from the lowest risk (0th centile) to the highest risk (100th centile). Mortality risk is calculated using the individual patients’ clinical and electrocardiographic variables and a validated logistic regression equation.68 The dotted red line indicates that the average mortality risk is about 6%. However, about three quarters of patients have a risk lower than the average risk, and the typical (median) risk patient has a risk that is around half the average risk. The quarter of patients at lowest risk have only a 1% probability of 30 day mortality, so an invasive procedure such as percutaneous coronary intervention, is unlikely to reduce the risk of mortality any further in these patients. However, the quarter of patients at highest risk have substantial potential for benefit. In a conventional clinical trial, these patients with highly different risks are collapsed into a single overall population, even though benefit-harm trade-offs may differ greatly. This risk distribution is typical of trials with a low outcome rate, when a reasonably good multivariable predictive model is available to describe risk.67
Figure 4 illustrates another commonly observed property67 72—that the distribution of the predicted risk is skewed, such that the risk of mortality is lower than the average risk for about 75% of patients; the risk of mortality in the “typical” (median risk) patient is about 3%, about half the average risk that would be reflected in the summary result. The higher mortality risk is driven by the influential quarter of patients at highest risk. When the risk distribution is skewed, the overall benefit for a treatment seen in the trial’s summary results may not reflect the benefits or the benefit-to-harm trade-offs even in patients who are at typical risk (especially when there is some treatment related harm).66 72
An understanding of the underlying distribution of risk for patients in RCTs can help inform anticipated subgroup effects, which by their nature are more credible than unanticipated subgroup effects (in the same way that confirmatory subgroup analysis is more credible than exploratory subgroup analysis (fig 2)). For example, when considering the use of a potentially effective invasive procedure (such as percutaneous coronary intervention; PCI) with a small risk of serious treatment related harm, it is anticipated that the benefit-harm trade-offs would be very different across the risk distribution shown in fig 4. Thus, despite “consistency of effects” in conventional subgroup analysis of the DANAMI-2 trial (fig 1B) (which compared PCI versus medical therapy in patients with ST-elevation myocardial infarction (STEMI)), clinically important HTE emerged when the population was subsequently stratified by mortality risk using the TIMI (thrombolysis in myocardial infarction) score (fig 5A). A risk stratified analysis based on an internally derived model using the data from the RITA-3 trial, which compared an invasive to a non-invasive approach for patients with non-STEMI/unstable angina, showed similar results (fig 5B).
Fig 5.

Analyses showing that invasive coronary procedures improve mortality in patients with ST elevation MI (DANAMI-2) in high risk but not low risk groups; this pattern holds true for mortality or reinfarction in non-ST elevation MI (RITA-3). (A) The DANAMI-2 trial tested an invasive procedure (PCI) against medical treatment in patients with ST elevation MI. (B) The RITA-3 trial compared an invasive strategy against medical treatment in patients with non-ST elevation MI/unstable angina. Event rates (upper plot), hazard ratios (middle plot) and absolute risk reductions (lower plot) are shown for each trial, with the average effect depicted by a dotted line. In DANAMI-2 (N=1527), a post hoc subgroup analysis stratified by risk showed that the approximately 75% of patients at low risk (TIMI score 0-4) received no mortality benefit—indeed, they had a non-significant trend towards harm. High risk patients (TIMI score ≥5) benefitted greatly from the invasive procedure (∼10% absolute reduction in mortality). The interaction (on the hazard ratio scale) between TIMI risk score and treatment effect was statistically significant (P<0.008). These effects were seen despite “consistency of effects” across all subgroups in conventional (one-variable-at-a-time) subgroup analyses. The RITA-3 trial (N=1810) showed a similar risk by treatment interaction for the outcome of death or non-fatal MI at four months when analyzed with an internally derived risk model. Absolute risk reduction in the primary outcome was very pronounced in the eighth of patients at highest risk, whereas the half at lowest risk received no benefit. DANAMI-2: Danish Multicenter Randomized Study on Fibrinolytic Therapy Versus Acute Coronary Angioplasty in Acute Myocardial Infarction; MI: myocardial infarction; OAT: Occluded Artery Trial; PCI: percutaneous coronary intervention; RITA-3: Randomized Intervention Trial of unstable Angina 3.
The pattern observed in these trials is not rare. Rather, risk distributions seem to conform to predictable patterns, based on the prevalence of the outcome and the discriminatory performance of the prediction model.67 Other examples in which effects in high risk subpopulations obscure the lack of benefit (and even harm) in many typical or low risk patients include more intensive versus less intensive thrombolytic therapy in STEMI,73 activated protein C for sepsis (https://s3-us-west-2.amazonaws.com/drugbank/fda_labels/DB00055.pdf?1265922807),74 enoxaparin or tirofiban in acute coronary syndrome,75 76 77 anticoagulation for stroke prevention in non-valvular atrial fibrillation,78 79 fidaxomicin versus vancomycin to prevent recurrence of Clostridium difficile infection, and many others.6 73 80 81 82 83 84
The examples in fig 5 show how risk modeling can lead not only to important changes on the ARD scale but to statistically significant HTE on the relative scale. This interaction can emerge for many reasons but should be expected when there are known treatment related harms that are reflected in the primary outcome, because similar degrees of treatment related harm will outweigh (or substantially reduce) the benefits in low risk patients but not high risk patients.53 66 At the same time, the importance of a significant “P value for interaction” should not be overemphasized when subgroups have very different outcome rates because the clinical importance of HTE needs to be determined on the absolute scale. For example, the Diabetes Prevention Program (DPP) trial tested both a lifestyle modification program and metformin pharmacotherapy against usual care in patients with pre-diabetes. It provides an interesting case where statistically significant relative effect modification was shown for one intervention (lifestyle modification) but not the other (metformin), even though clinically important HTE was shown for both interventions when effects were examined on the absolute scale (fig 6).
Fig 6.

High risk patients with pre-diabetes benefit more than low risk patients from interventions with both homogeneous relative treatment effects (lifestyle) and heterogeneous relative treatment effects (metformin). The Diabetes Prevention Program trial compared three approaches to diabetes prevention among patients with pre-diabetes: (1) a rigorous lifestyle modification program; (2) metformin treatment; (3) and usual care. (A) The graphs show event rates, hazard ratios, and risk differences for (A) lifestyle modification versus usual care and (B) metformin versus usual care for the outcome of development of diabetes. Overall results are depicted by the horizontal dotted line; both lifestyle modification and metformin showed substantial effectiveness in preventing diabetes.85 When patients were stratified by their risk of diabetes according to a simple internally developed risk model,86 the treatment effect was homogeneous on the hazard ratio scale for lifestyle modification, but strongly heterogeneous for metformin (Pintervention <0.001). Nevertheless, similar HTE across risk strata was seen when the treatment effect was expressed on the risk difference scale. This analysis demonstrates the limited clinical value of null hypothesis testing for HTE on the proportional scale when the outcome rate differs so dramatically across risk groups. The clinical significance of HTE needs to be evaluated on the absolute scale, where the benefits of the strategies for preventing diabetes can be weighed against the treatment burdens. Stratification with an externally derived model yielded similar results, with strata specific point estimates of effects indicated by asterisks (*).87 HTE: heterogeneity of treatment effect.
The importance of risk as a determinant of absolute benefit is widely accepted. The concept has entered guidelines, notably in the recommended approach to lipid lowering treatment for the prevention of coronary artery disease.88 The concept also underpins several algebraic approaches to “individualizing” evidence that are based on risk predictions and an assumption of consistent relative effects.89 90 91 92 Risk based analyses of RCTs permit this assumption to be examined.
External versus internal models
Although an applicable externally derived model would enable translation into practice, especially if well validated and clinically accepted, many of the above examples used internally developed risk models. These were derived on trial data “blinded” to treatment assignment. As long as good modeling practice (such as a large number of events per independent variable and a priori selection of risk variables based on previous literature) has been adhered to, models derived directly from RCT data provide “honest” (internally valid) treatment effect estimates within risk strata.51 93 Although some researchers recommend that the control arm be used to model risk only,94 95 96 this approach can potentially induce differential model fit on the two trial arms, biasing treatment effect estimates across risk strata, and exaggerating HTE.97 Indeed, with this approach, overfitting on the control arm can make completely innocuous and ineffective treatments appear to be beneficial in high risk patients and harmful in low risk patients. Various cross validation techniques have been proposed to mitigate this bias.98 However, given the small scale of the ARD compared with the predicted outcome risk, even very modest overfitting on the control arm can substantially bias estimates of the treatment effect.
Although internally derived (or endogenous) prognostic models can provide reliable estimates of treatment effects within trial risk strata,98 the implementation of an externally valid prognostic model is necessary for translation into practice. The finding of clinically important HTE across risk strata within a trial provides an important impetus for implementing an externally valid model. It should be noted that external validity is a general concern for RCT results and is not confined to results subgrouped using risk models.
Other dimensions of risk: heterogeneity of treatment related harm
It is also important to examine whether treatment related harms vary across risk strata because the treatment burden might not be constant across strata defined by outcome risk. When the two dimensions of risk are highly correlated (when high risk patients are also at greatest risk of treatment related harms), it becomes more difficult to segregate treatment favorable patients from treatment unfavorable ones.99 100 Thus, to facilitate the interpretation of benefit-harm trade-offs, important treatment related harms should be reported at the same level of disaggregation (that is, in each of the risk strata) as the primary outcome.
For treatments with serious treatment related harm, a better understanding of the variation in the risk of these adverse events may help to “deselect” patients with unfavorable benefit-harm trade-offs.101 Figure 7 illustrates two recent analyses that showed clinically important variation in the benefit-harm trade-offs in patients who were stratified by internal risk models for the treatment related harm (fracture in the case of pioglitazone; bleeding in the case of long course versus short course dual antiplatelet therapy). Although these analyses can be highly informative, differential overfitting may occur when the adverse outcome is rare in the control group, underscoring the importance of model validation.
Fig 7.

Benefit-harm trade-offs change substantially when subgroups are stratified by their risk of treatment related harms. (A) In the IRIS study, pioglitazone was shown to reduce the risk of recurrent events (stroke or MI) (RR=0.76) in patients with ischemic stroke and insulin resistance, but with an increase in the risk of fracture. At five years, the incremental risk of fracture was 4.9% (13.6% v 8.8%; HR 1.53). When patients were stratified by their risk of fracture using a simple risk score with eight variables, for each 100 patients at low risk of fracture treated with pioglitazone for five years, two to three had a pioglitazone related fracture, compared with six to seven in each 100 patients at high risk.102 During this same interval, in both risk groups three to four fewer patients treated with pioglitazone had a recurrent stroke or MI. Thus, the number of ischemic events prevented per fracture caused was two in the group at low risk of fracture and 0.5 in the high risk group. When only serious fractures were considered (those requiring hospital admission or surgery), pioglitazone prevented six ischemic events per serious fracture caused in those at low risk of fracture, but only about one event in those at high risk. These clinically important differences in benefit-harm trade-offs across strata emerged despite consistency of effects on the proportional scale for both the harm and benefit of treatment. (B) Similarly, when patients were stratified by their bleeding risk using a simple five variable risk score, prolonged DAPT (aspirin plus clopidogrel or ticagrelor) after percutaneous coronary intervention had a very favorable harm-benefit trade-off in patients at low risk of bleeding but not in those at high risk.103 DAPT: dual antiplatelet therapy; HR: hazard ratio; IRIS: Insulin Resistance In Stroke; MI: myocardial infarction; RR: relative risk.
Several trials have been stratified by combining models for outcome risk and for treatment related harm to make more comprehensive benefit-harm models.6 73 104 Although this is ultimately the goal of evidence personalization, the arithmetic combination of predictions from different models poses serious challenges related to the calibration of predictions that are beyond the scope of this discussion. Finally, because the primary outcome is sometimes a composite of outcomes with treatment responsive causes and those with treatment unresponsive (or competing) causes, it may also be useful to stratify the trial population by an index that predicts the fraction of outcomes attributable to the treatment responsive cause.105 106 107 For example, implantable cardiac defibrillators may be of greater benefit in those who have a higher risk of sudden cardiac death compared with their risk of pump failure death108; PFO closure may be more beneficial in a subset of patients with stroke and PFO who are more likely to have a stroke that is caused by PFO rather than another occult mechanism109 110; an anti-endotoxin specific therapy may be of greater benefit in patients with sepsis who are at higher risk of Gram negative rather than Gram positive causes of sepsis. Stratification of patients by prediction models that estimate risk of important competing events might also be informative in some circumstances.109 110
Treatment effect modeling
Although subgrouping on the basis of prognostic modeling has advantages over conventional subgroup analyses, outcome risk may not represent the optimal classification scheme. Prediction models developed on RCT data “unblinded” to treatment assignment have the potential to capture relative effect modification through the inclusion of treatment-by-covariate interaction terms. This may be important for determining (both relative and absolute) treatment effects and highly important for optimizing treatment selection.111 Indeed, approaches to stratified and personalized medicine have often focused exclusively on the discovery of effect modifiers on the relative scale,112 and some researchers reserve the term HTE to refer only to heterogeneity on the relative scale.113 When strong and well established effect modifiers exist—such as time from onset of symptoms to treatment for reperfusion therapies in myocardial infarction—treatment interaction effects can be included in the model, regardless of statistical significance. For example, stratification by predicted benefit (predicted outcome risk with treatment minus predicted outcome risk without treatment) could then stratify some lower risk patients with acute myocardial infarction who present very early as being more treatment favorable than some higher risk patients who present later.
However, the incorporation of relative effect modifiers (treatment interaction terms) that were selected on the basis of modeling on the trial itself into prediction models has special challenges. The selection of “statistically significant” relative effect modifiers for inclusion in a prediction model is identical in many respects to one-variable-at-a-time subgroup analysis and has many of the same vulnerabilities—weak theory and noisy data—that can lead to “false positives” and exaggerated effects (from testimation bias49 and other forms of overfitting). The number of events per interaction term needed for more accurate modeling of effect modification is many times greater than the number needed for main prognostic effects and has not been well studied. “Treatment benefit” prediction models using naive regression to select “statistically significant” interactions should be expected to provide misleading estimates of within strata effects because of unreliable, exaggerated, and highly influential interaction terms.114 115 The vulnerability to overfitting leaves this approach prone to discovering false subgroup effects, even for treatments that are completely ineffective.
Nevertheless, the further individualization of treatment selection often depends on the discovery of treatment effect modifiers that are not well established. One promising approach is to select a set of variables anticipated to be relative effect modifiers on the basis of a priori clinical reasoning, and to use an omnibus test for significance (with the appropriate degrees of freedom) across all the included putative interaction terms. If the result of this overall test is statistically significant, all interactions are included in the model; otherwise, none are. Because interaction terms are still prone to overfitting, this process should be combined with penalized regression methods (such as lasso regression,116 117 ridge regression,118 119 or elastic net regularization regression),120 121 which shrink model coefficients on the basis of model complexity to yield better predictions of the absolute treatment effect within new populations. Alternatively, when developing models “unblinded” to treatment assignment, a different set of data should be used for variable and model selection (that is, to define the reference class or subgrouping scheme) and for estimation of the treatment effect across strata. There is intense research interest in methods that combine effect modifier (biomarker) discovery with treatment effect estimation, including both machine learning approaches and regression based methods122 123 124 125 126 127 128 129 130 131 (see supplemental table 1 for additional examples), although clinical application remains limited.121 These more complex and aggressive prediction approaches require more rigorous validation.
The SYNTAX score II (fig 8) is an example of a model for predicting benefit; eight variables were used as both prognostic variables and effect modifiers (in treatment interaction terms), in a score that predicts outcomes for patients with non-acute coronary artery disease under two revascularization strategies—coronary artery bypass graft surgery (CABG) versus PCI.133 Although the overall trial showed substantial benefit for CABG (the primary outcome was reduced from 17.8% with PCI to 12.4% with CABG; P=0.002),132 stratification by predicted benefit according to the SYNTAX score II indicated that the benefits of population-wide CABG may largely be achieved by targeting to the most treatment favorable quarter of patients, potentially avoiding the substantial trauma and morbidity associated with an open chest procedure in most patients.
Fig 8.
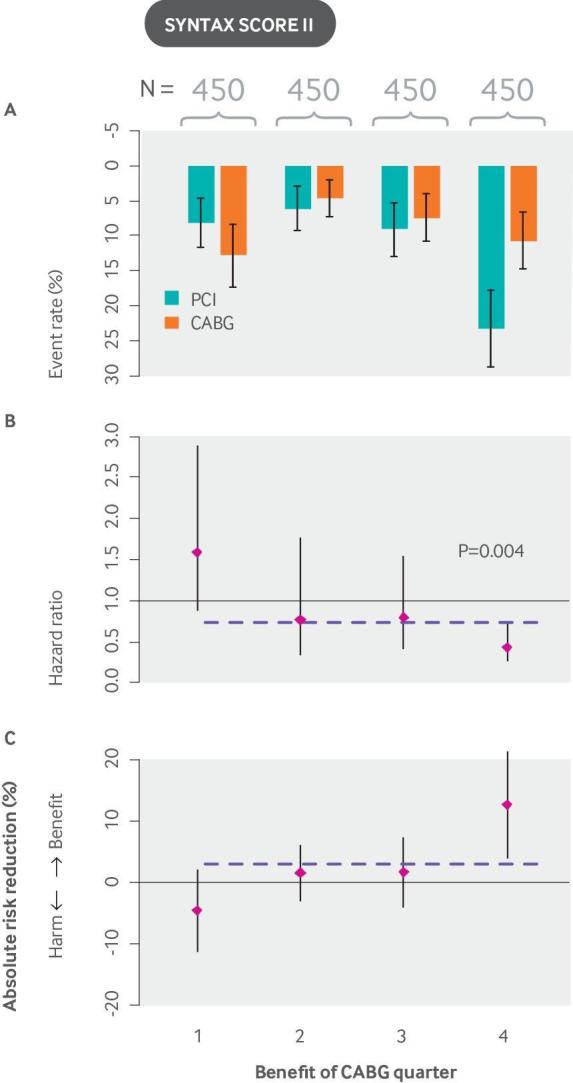
The SYNTAX score II stratifies patients with non-acute coronary artery disease on the basis of their risk of mortality with CABG versus PCI and is a useful guide to decision making. In the SYNTAX trial, rates of major adverse cardiac or cerebrovascular events at 12 months were significantly higher in the PCI group (17.8%) than in the CABG group (12.4%; P=0.002), confirming that CABG should be the preferred approach for patients with untreated three vessel or left main coronary artery disease.132 The SYNTAX score II was developed by applying a Cox proportional hazards model to the SYNTAX (Synergy Between Percutaneous Coronary Intervention With Taxus and Cardiac Surgery) trial (N=1800). It contains eight predictors: a previously developed anatomical SYNTAX score, age, creatinine clearance, left ventricular ejection fraction, presence of unprotected left main coronary artery disease, peripheral vascular disease, female sex, and COPD, plus treatment interaction terms with each of these variables. The graphs show (A) event rates, (B) hazard ratios, and (C) absolute risk reductions for CABG versus PCI. Unlike the examples shown in other figures, event rates do not increase monotonically across quarters because patients are stratified not by predicted risk but by predicted benefit (outcome risk with PCI minus outcome risk with CABG). Overall results, depicted by the horizontal dashed line, show a trend that favors CABG. However, when patients are stratified by their expected benefit, a quarter of patients who are treatment unfavorable is identified (Pinteraction=0.0037 for eight interaction terms), and benefit is largely confined to the quarter of patients at highest benefit. Although the SYNTAX score II has been validated for prediction of outcomes, it has not yet been validated for the prediction of benefit. CABG: coronary artery bypass graft surgery; COPD: chronic obstructive pulmonary disease; PCI: percutaneous coronary intervention.
Evaluating models that predict treatment benefit
The evaluation of a prediction model intended to estimate benefits using the usual metrics for outcome discrimination (eg, c-statistic) and calibration does not provide information on how well a model performs for predicting benefit—that is, the difference between outcome risk with two alternative strategies. Efforts to develop measures to assess model accuracy for predicting benefit are hampered by the fundamental problem of causal inference.134 Unlike individual patient outcomes, individual patient treatment effects (that is, who benefits and who does not) are inherently unobservable because patients do not simultaneously receive both counterfactual treatments to which they are randomized.135
Recently, the c-statistic, commonly used to measure discrimination in outcome risk models, has been adapted to evaluate the prediction of treatment effect.136 To do this, two patients who are discordant on treatment assignment are matched according to their predicted benefit (the absolute difference in their outcome risk with and without treatment). These matched pairs of patients with a similar “propensity for benefit” can then be classified into three categories according to their “observed benefit” by comparing outcomes in the control and experimental patient—benefit (1, 0); no effect (1, 1 or 0, 0); or harm (0, 1)—where 1 represents a bad outcome and 0 represents a good outcome in each of the two study arms; the c-statistic assesses how well the model discriminates pairs of patients on the basis of this trinary “outcome.”136 This approach assumes no correlation in the distribution of outcomes under the two treatments, conditional on the variables in the prediction model; this strong assumption leads to generally low values of the “c-for-benefit” statistic. Similarly, a model based ROC (receiver operating characteristic) measure has been proposed for treatment selection markers using a potential outcomes framework, but this approach relies on the assumption that model predictions are correct.137
Ultimately, the usefulness of a model depends not just on its ability to predict accurately and provide honest estimates of within strata treatment effects, but on its ability to improve decisions. This depends on model performance relative to a specific decision threshold—that is, a risk distribution that perfectly balances the burdens, harms, and costs of treatment. Decision curve analysis138 has been proposed to evaluate the clinical usefulness of prediction models and has been adapted to evaluate models that predict HTE in trials.139 These methods evaluate whether a particular prediction-decision strategy optimizes net benefit for a population at a particular decision threshold, compared with the best overall strategy (that is, treat all or treat none).140 The ultimate test of a predictive approach is to compare decisions (or outcomes) in settings that use such predictions with usual care in an experiment,141 such as a cluster randomized trial.
Use of observational data for predictive HTE analysis
Observational data have tremendous appeal for predictive HTE analyses. In particular, the growing availability of large databases that capture electronic health records and claims on millions of patients can provide statistical power far beyond that typically achieved by single or pooled RCTs.142 143 In addition, because these databases capture a broader, more heterogeneous population, representing the full spectrum of patients seen in routine practice, they may be an excellent substrate for risk prediction. Nevertheless, because randomization remains the gold standard for unbiased estimation of causal treatment effects, RCTs are also the preferred substrate for HTE analysis. Although modern methods for de-confounding may produce unbiased average treatment effect estimates in observational data, it is not possible to know whether all model assumptions are met in any given analysis.144 In addition, for HTE analyses, the assumptions necessary for deconfounding need to be met within each stratum, a more stringent requirement than for the estimation of an overall average treatment effect. Apart from confounding by indication, large observational data sources collected from routine care are often plagued by missing data and misclassification. A growing body of research is focused on improving the understanding of the necessary conditions for trustworthy, unbiased observational results, including research on methods to achieve balance in covariates across subgroups.145 146 147 Nevertheless, the use of observational data potentially compounds and complicates the well known problems with credibility that already undermine subgroup analyses even in RCTs.
Conclusion
Although a positive RCT result provides strong evidence that an intervention works for at least some patients included in the trial, clinicians still need to understand how a patient’s multiple characteristics combine to influence his or her potential treatment benefit—that is, the difference between outcome risk with and without the treatment. Disaggregation of the overall results according to absolute risk can yield more informative, narrower reference classes for more patient specific effect estimates of benefit and support more patient specific decision making. Routine use of absolute risk modeling is usually feasible for large phase III trials; journal editors, funders, and the research community should insist on these analyses. New statistical approaches, devised to model treatment effect directly, may offer additional advantages (increasing “benefit discrimination”), although with greater potential for statistical overfitting, false discovery, and biased predictions in new patient populations. These approaches merit more research.
Nonetheless, substantial barriers still need to be to overcome.148 We list a few of the outstanding research questions related to the problems covered in this article in the Questions for future research box. In addition, we need research aimed at:
Improving the integration of clinical prediction into practice149
Improving our understanding of how to individualize clinical practice guidelines
Establishing or extending reporting guidelines150
Establishing new models of data ownership to facilitate data pooling151
Re-engineering the clinical research infrastructure to support substantially larger clinically integrated trials sufficiently powered to determine thee HTE, or to develop our ability to predict when observational data will probably be sufficiently de-biased for reliable HTE determination, or both.146 152
Many recent and ongoing organizational and technical advances should enable this evolution.
As Hill pointed out, at the level of the individual the right decision is fundamentally under-determined by the results of a trial. Even in retrospect, it is usually impossible to tell whether the right decision was made for any individual patient. Thus, although the goal of prediction is to improve decisions in each patient, paradoxically, like any other intervention, this can be assessed only by examining whether more precise prediction improves outcomes at the population level. As experience with these approaches grows, in addition to stronger methodological and evidentiary standards, we will need empirical studies to ensure that these more flexible (and manipulable) methods realize in practice their potential to improve population outcomes.
Glossary.
Effect modification: This occurs when the size of the effect of a treatment or exposure on an outcome depends on the level of a third variable (eg, patient characteristics). In the presence of effect modification, the use of an overall effect estimate is inappropriate.
Heterogeneity of treatment effect (HTE): Non-random variability in the direction or size of a treatment effect, measured using clinical outcomes. HTE is fundamentally a scale dependent concept and therefore, for clarity, the scale should generally be specified. (It should be noted that some people reserve the term to describe variability on a relative scale only, such as changes in the odds ratio or relative risk.)
Clinically important HTE: This occurs when variation in the risk difference across patient subgroups spans a decisionally important threshold, which depends on treatment burden (including treatment related harms and costs). It is generally assessed on the absolute scale.
Predictive HTE analysis: The main goal of predictive HTE analysis is to develop models that can be used to predict which of two or more treatments will be better for an individual by taking into account multiple relevant variables.
Risk modeling approach: An approach to predictive HTE analysis in which a multivariable model that predicts the risk of an outcome (usually the primary study outcome) is applied to disaggregate patients in trials and examine risk based variation in treatment effects.
External risk models versus endogenous/internal risk models: External risk models have been developed from an external trial or cohort but can be used for HTE analysis of other trials. Internal risk models are developed directly from the trial population.
Treatment effect modeling approach: An approach to predictive HTE analysis that develops a model directly on randomized trial data to predict treatment effects (the difference in outcome risks under two alternative treatment conditions). Unlike risk modeling, the model incorporates a term for treatment assignment and permits the inclusion of treatment by covariate interaction terms.
Net benefit: A decision analytic measure that puts benefits and harms on the same scale. This is achieved by specifying an exchange rate on the basis of the relative value of benefits and harms associated with interventions. The exchange rate is related to the probability threshold determining whether a patient is classified as being positive or negative for a model outcome, or (when applied to trial analysis) as being treatment favorable versus treatment unfavorable.
Overfitting: A situation where predictions do not generalize to new subjects outside the sample under study. Overfitting occurs when a model conforms too closely to the idiosyncrasies or “noise” of the limited data sample from which it is derived and is a threat to the validity of a model.
Penalized regression: A set of regression methods, developed to prevent overfitting, in which the coefficients assigned to covariates are penalized for model complexity. Penalized regression is sometimes referred to as shrinkage or regularization. Examples of penalized regression include lasso, ridge, and elastic net regularization.
Predictive factors: Patient characteristics that result in modification of the treatment effect and are often assessed using statistical interaction terms on the relative scale. Generally, predictive factors are substantially harder to identify than prognostic factors, given the more limited a priori information on their effects and the greater statistical power needed to test interactions.
Prognostic factors: Patient characteristics that influence the risk of the outcome of interest. These factors may also help discriminate patient groups with different degrees of absolute benefit. A single characteristic may be both predictive and prognostic.
Reference class: A group of similar cases that is used to make predictions for an individual patient of interest. The “reference class problem” refers to the fact that similarity can be defined in an indefinite number of different ways because individuals have many different potentially relevant attributes.
Testimation bias: Refers to the fact that, on average, the effect sizes of newly discovered true (non-null) associations are inherently inflated. Testimation bias arises from the use of statistical thresholds in the process of discovering associations or of selecting variables for a model. Inflation is expected when an association has to pass a certain threshold of statistical significance to be deemed positive (or included in a model) and the study has suboptimal power. The problem is also referred to as the “winner’s curse.”
How patients were involved in the creation of this article.
To gain insight into the importance of heterogeneity of treatment effects from the patient’s perspective, we held three 90 minute webinar enabled group discussions with patient stakeholder representatives of three patient powered research networks (PPRNs): ARthritis Partnership with Comparative Effectiveness Researchers (AR-PoWER), the Health eHeart Alliance, and iConquerMS.
Questions for future research .
How can we jointly predict multiple important outcomes or risk dimensions (eg, risk of the primary outcome versus risk of treatment related harm)?
How can we determine when relative effect modifiers are sufficiently reliable for inclusion in treatment effect models?
Do machine learning techniques have distinct advantages over traditional statistical approaches for predicting treatment effect? If so, under what conditions?
How can models be updated and recalibrated in the absence of new randomized trials?
Under what conditions can observational big data sources provide a substrate for reliable predictive heterogeneity of treatment effect analysis?
Acknowledgments
The authors acknowledge the supportive work of Jessica Paulus, the PARC Technical Expert Panel, and Evidence Review Committee, and of Jennifer Lutz in manuscript preparation.
Contributors: The concepts of this manuscript were discussed among all authors. DMK prepared the initial draft of the manuscript. Substantial revisions were made by all authors.
Funding: This work was partially supported through two Patient-Centered Outcomes Research Institute (PCORI) grants (the Predictive Analytics Resource Center (PARC) (SA.Tufts.PARC.OSCO.2018.01.25) and Methods Award (ME-1606-35555)), as well as by the National Institutes of Health (U01NS086294).
Competing interests: All authors have read and understood BMJ policy on declaration of interests and declare no competing interests.
Provenance and peer review: Commissioned; externally peer reviewed.
Disclosures: All statements in this report, including its findings and conclusions, are solely those of the authors and do not necessarily represent the views of the Patient-Centered Outcomes Research Institute (PCORI), its Board of Governors, or Methodology Committee.
Series explanation: State of the Art Reviews are commissioned on the basis of their relevance to academics and specialists in the US and internationally. For this reason they are written predominantly by US authors
References
- 1. Hill AB. Reflections on controlled trial. Ann Rheum Dis 1966;25:107-13. 10.1136/ard.25.2.107 [DOI] [PMC free article] [PubMed] [Google Scholar]
- 2. Kahneman D. Thinking, fast and slow. Farrar, Straus and Giroux, 2011. [Google Scholar]
- 3. Kahneman D, Lovato L. Timid choices and bold forecasts: a cognitive perspective on risk taking. Manage Sci 1993;39:17-31 10.1287/mnsc.39.1.17. [DOI] [Google Scholar]
- 4. Meehl PE. Clinical versus statistical prediction: a theoretical analysis and a review of the evidence. University of Minnesota Press, 1954. 10.1037/11281-000 . [DOI] [Google Scholar]
- 5. Saita Y, Ishijima M, Kaneko K. Atypical femoral fractures and bisphosphonate use: current evidence and clinical implications. Ther Adv Chronic Dis 2015;6:185-93. 10.1177/2040622315584114 [DOI] [PMC free article] [PubMed] [Google Scholar]
- 6. Rothwell PM, Warlow CP. Prediction of benefit from carotid endarterectomy in individual patients: a risk-modelling study. European Carotid Surgery Trialists’ Collaborative Group. Lancet 1999;353:2105-10. 10.1016/S0140-6736(98)11415-0 [DOI] [PubMed] [Google Scholar]
- 7. Varadhan R, Seeger JD. Estimation and reporting of heterogeneity of treatment effects. In: Velentgas P, Dreyer NA, Nourjah P, et al., eds. Developing a protocol for observational comparative effectiveness research: a user’s guide. Agency for Healthcare Research and Quality, 2013. [PubMed] [Google Scholar]
- 8. Rothman KJ, Greenland S, Lash TL. Concepts of interaction. Modern epidemiology. Lippincott Williams & Wilkins, 2008. [Google Scholar]
- 9. Varadhan R, Segal JB, Boyd CM, Wu AW, Weiss CO. A framework for the analysis of heterogeneity of treatment effect in patient-centered outcomes research. J Clin Epidemiol 2013;66:818-25. 10.1016/j.jclinepi.2013.02.009 [DOI] [PMC free article] [PubMed] [Google Scholar]
- 10. Tanniou J, van der Tweel I, Teerenstra S, Roes KC. Subgroup analyses in confirmatory clinical trials: time to be specific about their purposes. BMC Med Res Methodol 2016;16:20. 10.1186/s12874-016-0122-6 [DOI] [PMC free article] [PubMed] [Google Scholar]
- 11. Byar DP. Assessing apparent treatment--covariate interactions in randomized clinical trials. Stat Med 1985;4:255-63. 10.1002/sim.4780040304 [DOI] [PubMed] [Google Scholar]
- 12. Goodman SN. Probability at the bedside: the knowing of chances or the chances of knowing? Ann Intern Med 1999;130:604-6. 10.7326/0003-4819-130-7-199904060-00022 [DOI] [PubMed] [Google Scholar]
- 13. Dahabreh IJ, Hayward R, Kent DM. Using group data to treat individuals: understanding heterogeneous treatment effects in the age of precision medicine and patient-centred evidence. Int J Epidemiol 2016;45:2184-93. [DOI] [PMC free article] [PubMed] [Google Scholar]
- 14. Kent DM, Shah ND. Risk models and patient-centered evidence: should physicians expect one right answer? JAMA 2012;307:1585-6. 10.1001/jama.2012.469 [DOI] [PubMed] [Google Scholar]
- 15. Stern RH. Individual risk. J Clin Hypertens (Greenwich) 2012;14:261-4. 10.1111/j.1751-7176.2012.00592.x [DOI] [PMC free article] [PubMed] [Google Scholar]
- 16. Venn J. The logic of chance. 2nd ed Macmillan, 1876. [Google Scholar]
- 17. Guyatt GH, Sackett DL, Cook DJ. Users’ guides to the medical literature. II. How to use an article about therapy or prevention. B. What were the results and will they help me in caring for my patients? Evidence-Based Medicine Working Group. JAMA 1994;271:59-63. 10.1001/jama.1994.03510250075039 [DOI] [PubMed] [Google Scholar]
- 18. Treweek S, Zwarenstein M. Making trials matter: pragmatic and explanatory trials and the problem of applicability. Trials 2009;10:37. 10.1186/1745-6215-10-37 [DOI] [PMC free article] [PubMed] [Google Scholar]
- 19. Reichenbach H. The theory of probability. University of California Press, 1949. [Google Scholar]
- 20. Kohane IS. The twin questions of personalized medicine: who are you and whom do you most resemble? Genome Med 2009;1:4. 10.1186/gm4. [DOI] [PMC free article] [PubMed] [Google Scholar]
- 21. Sun X, Briel M, Walter SD, Guyatt GH. Is a subgroup effect believable? Updating criteria to evaluate the credibility of subgroup analyses. BMJ 2010;340:c117. 10.1136/bmj.c117 [DOI] [PubMed] [Google Scholar]
- 22. Rothwell PM. Treating individuals 2. Subgroup analysis in randomised controlled trials: importance, indications, and interpretation. Lancet 2005;365:176-86. 10.1016/S0140-6736(05)17709-5 [DOI] [PubMed] [Google Scholar]
- 23. Lagakos SW. The challenge of subgroup analyses--reporting without distorting. N Engl J Med 2006;354:1667-9. 10.1056/NEJMp068070 [DOI] [PubMed] [Google Scholar]
- 24. Hernández AV, Boersma E, Murray GD, Habbema JD, Steyerberg EW. Subgroup analyses in therapeutic cardiovascular clinical trials: are most of them misleading? Am Heart J 2006;151:257-64. 10.1016/j.ahj.2005.04.020 [DOI] [PubMed] [Google Scholar]
- 25.Varadhan R, Stuart EA, Louis TA, Segal JB, Weiss CO. Review of guidance documents for selected methods in patient centered outcomes research: standards in addressing heterogeneity of treatment effectiveness in observational and experimental patient centered outcomes research. A report to the PCORI Methodology Committee Research Methods Working Group. 2012. https://www.pcori.org/assets/Standards-in-Addressing-Heterogeneity-of-Treatment-Effectiveness-in-Observational-and-Experimental-Patient-Centered-Outcomes-Research1.pdf
- 26. Wang R, Lagakos SW, Ware JH, Hunter DJ, Drazen JM. Statistics in medicine--reporting of subgroup analyses in clinical trials. N Engl J Med 2007;357:2189-94. 10.1056/NEJMsr077003 [DOI] [PubMed] [Google Scholar]
- 27. Furberg CD, Byington RP. What do subgroup analyses reveal about differential response to beta-blocker therapy? The Beta-Blocker Heart Attack Trial experience. Circulation 1983;67:I98-101. [PubMed] [Google Scholar]
- 28. Tannock IF. False-positive results in clinical trials: multiple significance tests and the problem of unreported comparisons. J Natl Cancer Inst 1996;88:206-7. 10.1093/jnci/88.3-4.206 [DOI] [PubMed] [Google Scholar]
- 29. Assmann SF, Pocock SJ, Enos LE, Kasten LE. Subgroup analysis and other (mis)uses of baseline data in clinical trials. Lancet 2000;355:1064-9. 10.1016/S0140-6736(00)02039-0 [DOI] [PubMed] [Google Scholar]
- 30. Oxman AD, Guyatt GH. A consumer’s guide to subgroup analyses. Ann Intern Med 1992;116:78-84. 10.7326/0003-4819-116-1-78 [DOI] [PubMed] [Google Scholar]
- 31. Pocock SJ, Assmann SE, Enos LE, Kasten LE. Subgroup analysis, covariate adjustment and baseline comparisons in clinical trial reporting: current practice and problems. Stat Med 2002;21:2917-30. 10.1002/sim.1296 [DOI] [PubMed] [Google Scholar]
- 32. Stallones RA. The use and abuse of subgroup analysis in epidemiological research. Prev Med 1987;16:183-94. 10.1016/0091-7435(87)90082-X [DOI] [PubMed] [Google Scholar]
- 33. Parker AB, Naylor CD. Subgroups, treatment effects, and baseline risks: some lessons from major cardiovascular trials. Am Heart J 2000;139:952-61. 10.1067/mhj.2000.106610 [DOI] [PubMed] [Google Scholar]
- 34. Kraemer HC, Frank E, Kupfer DJ. Moderators of treatment outcomes: clinical, research, and policy importance. JAMA 2006;296:1286-9. 10.1001/jama.296.10.1286 [DOI] [PubMed] [Google Scholar]
- 35. Hochman JS, Lamas GA, Buller CE, et al. Occluded Artery Trial Investigators Coronary intervention for persistent occlusion after myocardial infarction. N Engl J Med 2006;355:2395-407. 10.1056/NEJMoa066139 [DOI] [PMC free article] [PubMed] [Google Scholar]
- 36. Andersen HR, Nielsen TT, Rasmussen K, et al. DANAMI-2 Investigators A comparison of coronary angioplasty with fibrinolytic therapy in acute myocardial infarction. N Engl J Med 2003;349:733-42. 10.1056/NEJMoa025142 [DOI] [PubMed] [Google Scholar]
- 37. Thune JJ, Hoefsten DE, Lindholm MG, et al. Danish Multicenter Randomized Study on Fibrinolytic Therapy Versus Acute Coronary Angioplasty in Acute Myocardial Infarction (DANAMI)-2 Investigators Simple risk stratification at admission to identify patients with reduced mortality from primary angioplasty. Circulation 2005;112:2017-21. 10.1161/CIRCULATIONAHA.105.558676 [DOI] [PubMed] [Google Scholar]
- 38. Brookes ST, Whitely E, Egger M, Smith GD, Mulheran PA, Peters TJ. Subgroup analyses in randomized trials: risks of subgroup-specific analyses; power and sample size for the interaction test. J Clin Epidemiol 2004;57:229-36. 10.1016/j.jclinepi.2003.08.009 [DOI] [PubMed] [Google Scholar]
- 39. Simon R. Patient subsets and variation in therapeutic efficacy. Br J Clin Pharmacol 1982;14:473-82. 10.1111/j.1365-2125.1982.tb02015.x [DOI] [PMC free article] [PubMed] [Google Scholar]
- 40. Gail M, Simon R. Testing for qualitative interactions between treatment effects and patient subsets. Biometrics 1985;41:361-72. 10.2307/2530862 [DOI] [PubMed] [Google Scholar]
- 41. Halperin M, Ware JH, Byar DP, et al. Testing for interaction in an IxJxK contingency table. Biometrika 1977;64:271-5. [Google Scholar]
- 42. Wallach JD, Sullivan PG, Trepanowski JF, Steyerberg EW, Ioannidis JP. Sex based subgroup differences in randomized controlled trials: empirical evidence from Cochrane meta-analyses. BMJ 2016;355:i5826. 10.1136/bmj.i5826 [DOI] [PMC free article] [PubMed] [Google Scholar]
- 43. Wallach JD, Sullivan PG, Trepanowski JF, Sainani KL, Steyerberg EW, Ioannidis JP. Evaluation of Evidence of statistical support and corroboration of subgroup claims in randomized clinical trials. JAMA Intern Med 2017;177:554-60. 10.1001/jamainternmed.2016.9125 [DOI] [PMC free article] [PubMed] [Google Scholar]
- 44. ISIS-2 (Second International Study of Infarct Survival) Collaborative Group Randomised trial of intravenous streptokinase, oral aspirin, both, or neither among 17,187 cases of suspected acute myocardial infarction: ISIS-2. ISIS-2 (Second International Study of Infarct Survival) Collaborative Group. Lancet 1988;2:349-60. [PubMed] [Google Scholar]
- 45. Antiplatelet Trialists’ Collaboration Collaborative overview of randomised trials of antiplatelet therapy--I: Prevention of death, myocardial infarction, and stroke by prolonged antiplatelet therapy in various categories of patients. Antiplatelet Trialists’ Collaboration. BMJ 1994;308:81-106. 10.1136/bmj.308.6921.81 [DOI] [PMC free article] [PubMed] [Google Scholar]
- 46. Yusuf S, Peto R, Lewis J, Collins R, Sleight P. Beta blockade during and after myocardial infarction: an overview of the randomized trials. Prog Cardiovasc Dis 1985;27:335-71. 10.1016/S0033-0620(85)80003-7 [DOI] [PubMed] [Google Scholar]
- 47. Brookes ST, Whitley E, Peters TJ, Mulheran PA, Egger M, Davey Smith G. Subgroup analyses in randomised controlled trials: quantifying the risks of false-positives and false-negatives. Health Technol Assess 2001;5:1-56. 10.3310/hta5330 [DOI] [PubMed] [Google Scholar]
- 48. Burke JF, Sussman JB, Kent DM, Hayward RA. Three simple rules to ensure reasonably credible subgroup analyses. BMJ 2015;351:h5651. 10.1136/bmj.h5651 [DOI] [PMC free article] [PubMed] [Google Scholar]
- 49. Ioannidis JP. Why most discovered true associations are inflated. Epidemiology 2008;19:640-8. 10.1097/EDE.0b013e31818131e7 [DOI] [PubMed] [Google Scholar]
- 50. Ioannidis JP. Why most published research findings are false. PLoS Med 2005;2:e124. 10.1371/journal.pmed.0020124 [DOI] [PMC free article] [PubMed] [Google Scholar]
- 51. Steyerberg EW. Clinical prediction models: a practical approach to development, validation, and updating. Springer, 2009. 10.1007/978-0-387-77244-8 . [DOI] [Google Scholar]
- 52. Raman G, Balk EM, Lai L, et al. Evaluation of person-level heterogeneity of treatment effects in published multiperson N-of-1 studies: systematic review and reanalysis. BMJ Open 2018;8:e017641. 10.1136/bmjopen-2017-017641 [DOI] [PMC free article] [PubMed] [Google Scholar]
- 53. Hayward RA, Kent DM, Vijan S, Hofer TP. Multivariable risk prediction can greatly enhance the statistical power of clinical trial subgroup analysis. BMC Med Res Methodol 2006;6:18. 10.1186/1471-2288-6-18 [DOI] [PMC free article] [PubMed] [Google Scholar]
- 54. Ebrahim S, Smith GD. The ‘number need to treat’: does it help clinical decision making? J Hum Hypertens 1999;13:721-4. 10.1038/sj.jhh.1000919 [DOI] [PubMed] [Google Scholar]
- 55. Furukawa TA, Guyatt GH, Griffith LE. Can we individualize the ‘number needed to treat’? An empirical study of summary effect measures in meta-analyses. Int J Epidemiol 2002;31:72-6. 10.1093/ije/31.1.72 [DOI] [PubMed] [Google Scholar]
- 56. Kent DM, Rothwell PM, Ioannidis JP, Altman DG, Hayward RA. Assessing and reporting heterogeneity in treatment effects in clinical trials: a proposal. Trials 2010;11:85. 10.1186/1745-6215-11-85 [DOI] [PMC free article] [PubMed] [Google Scholar]
- 57. Sun X, Briel M, Busse JW, et al. Credibility of claims of subgroup effects in randomised controlled trials: systematic review. BMJ 2012;344:e1553. 10.1136/bmj.e1553 [DOI] [PubMed] [Google Scholar]
- 58. Dijkman B, Kooistra B, Bhandari M, Evidence-Based Surgery Working Group How to work with a subgroup analysis. Can J Surg 2009;52:515-22. [PMC free article] [PubMed] [Google Scholar]
- 59. Sun X, Heels-Ansdell D, Walter SD, et al. Study to Prospectively Evaluate Reamed Intramedullary Nails in Tibial Fractures (SPRINT) Investigators Is a subgroup claim believable? A user’s guide to subgroup analyses in the surgical literature. J Bone Joint Surg Am 2011;93:e8. 10.2106/JBJS.I.01555 [DOI] [PMC free article] [PubMed] [Google Scholar]
- 60.Patient-Centered Outcomes Research Institute (PCORI) Methodology Committee. The PCORI Methodology Report. https://www.pcori.org/sites/default/files/PCORI-Methodology-Report.pdf.
- 61. Sun X, Briel M, Busse JW, et al. Subgroup Analysis of Trials Is Rarely Easy (SATIRE): a study protocol for a systematic review to characterize the analysis, reporting, and claim of subgroup effects in randomized trials. Trials 2009;10:101. 10.1186/1745-6215-10-101 [DOI] [PMC free article] [PubMed] [Google Scholar]
- 62. Rothwell PM. Can overall results of clinical trials be applied to all patients? Lancet 1995;345:1616-9. 10.1016/S0140-6736(95)90120-5 [DOI] [PubMed] [Google Scholar]
- 63. Rothwell PM, Mehta Z, Howard SC, Gutnikov SA, Warlow CP. Treating individuals 3: from subgroups to individuals: general principles and the example of carotid endarterectomy. Lancet 2005;365:256-65. 10.1016/S0140-6736(05)70156-2 [DOI] [PubMed] [Google Scholar]
- 64. Kravitz RL, Duan N, Braslow J. Evidence-based medicine, heterogeneity of treatment effects, and the trouble with averages. Milbank Q 2004;82:661-87. 10.1111/j.0887-378X.2004.00327.x [DOI] [PMC free article] [PubMed] [Google Scholar]
- 65. Davidoff F. Heterogeneity is not always noise: lessons from improvement. JAMA 2009;302:2580-6. 10.1001/jama.2009.1845 [DOI] [PubMed] [Google Scholar]
- 66. Kent DM, Hayward RA. Limitations of applying summary results of clinical trials to individual patients: the need for risk stratification. JAMA 2007;298:1209-12. 10.1001/jama.298.10.1209 [DOI] [PubMed] [Google Scholar]
- 67. Kent DM, Nelson J, Dahabreh IJ, Rothwell PM, Altman DG, Hayward RA. Risk and treatment effect heterogeneity: re-analysis of individual participant data from 32 large clinical trials. Int J Epidemiol 2016;45:2075-88. [DOI] [PMC free article] [PubMed] [Google Scholar]
- 68. Selker HP, Griffith JL, Beshansky JR, et al. Patient-specific predictions of outcomes in myocardial infarction for real-time emergency use: a thrombolytic predictive instrument. Ann Intern Med 1997;127:538-56. 10.7326/0003-4819-127-7-199710010-00006 [DOI] [PubMed] [Google Scholar]
- 69. Kent DM, Schmid CH, Lau J, Selker HP. Is primary angioplasty for some as good as primary angioplasty for all? J Gen Intern Med 2002;17:887-94. 10.1046/j.1525-1497.2002.11232.x [DOI] [PMC free article] [PubMed] [Google Scholar]
- 70. Hayward RA, Kent DM, Vijan S, Hofer TP. Reporting clinical trial results to inform providers, payers, and consumers. Health Aff (Millwood) 2005;24:1571-81. 10.1377/hlthaff.24.6.1571 [DOI] [PubMed] [Google Scholar]
- 71. Davidoff F. Can knowledge about heterogeneity in treatment effects help us choose wisely? Ann Intern Med 2017;166:141-2. 10.7326/M16-1721 [DOI] [PubMed] [Google Scholar]
- 72. Vickers AJ, Kent DM. The Lake Wobegon effect: why most patients are at below-average risk. Ann Intern Med 2015;162:866-7. 10.7326/M14-2767 [DOI] [PMC free article] [PubMed] [Google Scholar]
- 73. Kent DM, Hayward RA, Griffith JL, et al. An independently derived and validated predictive model for selecting patients with myocardial infarction who are likely to benefit from tissue plasminogen activator compared with streptokinase. Am J Med 2002;113:104-11. 10.1016/S0002-9343(02)01160-9 [DOI] [PubMed] [Google Scholar]
- 74. Abraham E, Laterre PF, Garg R, et al. Administration of Drotrecogin Alfa (Activated) in Early Stage Severe Sepsis (ADDRESS) Study Group Drotrecogin alfa (activated) for adults with severe sepsis and a low risk of death. N Engl J Med 2005;353:1332-41. 10.1056/NEJMoa050935 [DOI] [PubMed] [Google Scholar]
- 75. Antman EM, Cohen M, Bernink PJ, et al. The TIMI risk score for unstable angina/non-ST elevation MI: A method for prognostication and therapeutic decision making. JAMA 2000;284:835-42. 10.1001/jama.284.7.835 [DOI] [PubMed] [Google Scholar]
- 76. Morrow DA, Antman EM, Snapinn SM, McCabe CH, Theroux P, Braunwald E. An integrated clinical approach to predicting the benefit of tirofiban in non-ST elevation acute coronary syndromes. Application of the TIMI Risk Score for UA/NSTEMI in PRISM-PLUS. Eur Heart J 2002;23:223-9. 10.1053/euhj.2001.2738 [DOI] [PubMed] [Google Scholar]
- 77. Cannon CP, Weintraub WS, Demopoulos LA, et al. TACTICS (Treat Angina with Aggrastat and Determine Cost of Therapy with an Invasive or Conservative Strategy)--Thrombolysis in Myocardial Infarction 18 Investigators Comparison of early invasive and conservative strategies in patients with unstable coronary syndromes treated with the glycoprotein IIb/IIIa inhibitor tirofiban. N Engl J Med 2001;344:1879-87. 10.1056/NEJM200106213442501 [DOI] [PubMed] [Google Scholar]
- 78. Gage BF, Waterman AD, Shannon W, Boechler M, Rich MW, Radford MJ. Validation of clinical classification schemes for predicting stroke: results from the National Registry of Atrial Fibrillation. JAMA 2001;285:2864-70. 10.1001/jama.285.22.2864 [DOI] [PubMed] [Google Scholar]
- 79. West of Scotland Coronary Prevention Study West of Scotland Coronary Prevention Study: identification of high-risk groups and comparison with other cardiovascular intervention trials. Lancet 1996;348:1339-42. 10.1016/S0140-6736(96)04292-4 [DOI] [PubMed] [Google Scholar]
- 80. Yusuf S, Zucker D, Peduzzi P, et al. Effect of coronary artery bypass graft surgery on survival: overview of 10-year results from randomised trials by the Coronary Artery Bypass Graft Surgery Trialists Collaboration. Lancet 1994;344:563-70. 10.1016/S0140-6736(94)91963-1 [DOI] [PubMed] [Google Scholar]
- 81. Mehta SR, Granger CB, Boden WE, et al. TIMACS Investigators Early versus delayed invasive intervention in acute coronary syndromes. N Engl J Med 2009;360:2165-75. 10.1056/NEJMoa0807986 [DOI] [PubMed] [Google Scholar]
- 82. Mehta SR, Cannon CP, Fox KA, et al. Routine vs selective invasive strategies in patients with acute coronary syndromes: a collaborative meta-analysis of randomized trials. JAMA 2005;293:2908-17. 10.1001/jama.293.23.2908 [DOI] [PubMed] [Google Scholar]
- 83. Califf RM, Woodlief LH, Harrell FE, Jr, et al. GUSTO-I Investigators Selection of thrombolytic therapy for individual patients: development of a clinical model. Am Heart J 1997;133:630-9. 10.1016/S0002-8703(97)70164-9 [DOI] [PubMed] [Google Scholar]
- 84. Kovalchik SA, Tammemagi M, Berg CD, et al. Targeting of low-dose CT screening according to the risk of lung-cancer death. N Engl J Med 2013;369:245-54. 10.1056/NEJMoa1301851 [DOI] [PMC free article] [PubMed] [Google Scholar]
- 85. Knowler WC, Barrett-Connor E, Fowler SE, et al. Diabetes Prevention Program Research Group Reduction in the incidence of type 2 diabetes with lifestyle intervention or metformin. N Engl J Med 2002;346:393-403. 10.1056/NEJMoa012512 [DOI] [PMC free article] [PubMed] [Google Scholar]
- 86. Sussman JB, Kent DM, Nelson JP, Hayward RA. Improving diabetes prevention with benefit based tailored treatment: risk based reanalysis of Diabetes Prevention Program. BMJ 2015;350:h454. 10.1136/bmj.h454 [DOI] [PMC free article] [PubMed] [Google Scholar]
- 87. Wilson PW, Meigs JB, Sullivan L, Fox CS, Nathan DM, D’Agostino RB., Sr Prediction of incident diabetes mellitus in middle-aged adults: the Framingham Offspring Study. Arch Intern Med 2007;167:1068-74. 10.1001/archinte.167.10.1068 [DOI] [PubMed] [Google Scholar]
- 88. Goff DC, Jr, Lloyd-Jones DM, Bennett G, et al. American College of Cardiology/American Heart Association Task Force on Practice Guidelines 2013 ACC/AHA guideline on the assessment of cardiovascular risk: a report of the American College of Cardiology/American Heart Association Task Force on Practice Guidelines. Circulation 2014;129(Suppl 2):S49-73. 10.1161/01.cir.0000437741.48606.98 [DOI] [PubMed] [Google Scholar]
- 89. Dorresteijn JA, Visseren FL, Ridker PM, et al. Estimating treatment effects for individual patients based on the results of randomised clinical trials. BMJ 2011;343:d5888. 10.1136/bmj.d5888 [DOI] [PMC free article] [PubMed] [Google Scholar]
- 90. Glasziou PP, Irwig LM. An evidence based approach to individualising treatment. BMJ 1995;311:1356-9. 10.1136/bmj.311.7016.1356 [DOI] [PMC free article] [PubMed] [Google Scholar]
- 91. Dorresteijn JA, Boekholdt SM, van der Graaf Y, et al. High-dose statin therapy in patients with stable coronary artery disease: treating the right patients based on individualized prediction of treatment effect. Circulation 2013;127:2485-93. 10.1161/CIRCULATIONAHA.112.000712 [DOI] [PubMed] [Google Scholar]
- 92. Marcucci M, Sinclair JC. A generalised model for individualising a treatment recommendation based on group-level evidence from randomised clinical trials. BMJ Open 2013;3:e003143. 10.1136/bmjopen-2013-003143 [DOI] [PMC free article] [PubMed] [Google Scholar]
- 93. Harrell FE. Regression modeling strategies: with applications to linear models, logistic regression, and survival analysis. 2nd ed Springer, 2015. 10.1007/978-3-319-19425-7. [DOI] [Google Scholar]
- 94. Baker SG, Sargent DJ. Designing a randomized clinical trial to evaluate personalized medicine: a new approach based on risk prediction. J Natl Cancer Inst 2010;102:1756-9. 10.1093/jnci/djq427 [DOI] [PMC free article] [PubMed] [Google Scholar]
- 95. Pocock SJ, Lubsen J. More on subgroup analyses in clinical trials. N Engl J Med 2008;358:2076-7, author reply 2076-7. 10.1056/NEJMc0800616 [DOI] [PubMed] [Google Scholar]
- 96. Julien M, Hanley JA. Profile-specific survival estimates: making reports of clinical trials more patient-relevant. Clin Trials 2008;5:107-15. 10.1177/1740774508089511 [DOI] [PubMed] [Google Scholar]
- 97. Burke JF, Hayward RA, Nelson JP, Kent DM. Using internally developed risk models to assess heterogeneity in treatment effects in clinical trials. Circ Cardiovasc Qual Outcomes 2014;7:163-9. 10.1161/CIRCOUTCOMES.113.000497 [DOI] [PMC free article] [PubMed] [Google Scholar]
- 98.Abadie A, Chingos MM, West MR. Endogenous stratification in randomized experiments. (December 2013). NBER Working Paper No. w19742. http://ssrn.com/abstract=2370198.
- 99. Kernan WN, Viscoli CM, Dearborn JL, et al. Insulin Resistance Intervention After Stroke (IRIS) Trial Investigators Targeting pioglitazone hydrochloride therapy after stroke or transient ischemic attack according to pretreatment risk for stroke or myocardial infarction. JAMA Neurol 2017;74:1319-27. 10.1001/jamaneurol.2017.2136 [DOI] [PMC free article] [PubMed] [Google Scholar]
- 100. Kumar V, Cohen JT, van Klaveren D, et al. Risk-targeted lung cancer screening: a cost-effectiveness analysis. Ann Intern Med 2018;168:161-9. 10.7326/M17-1401 [DOI] [PMC free article] [PubMed] [Google Scholar]
- 101. Kent DM, Ruthazer R, Selker HP. Are some patients likely to benefit from recombinant tissue-type plasminogen activator for acute ischemic stroke even beyond 3 hours from symptom onset? Stroke 2003;34:464-7. 10.1161/01.STR.0000051506.43212.8B [DOI] [PubMed] [Google Scholar]
- 102. Viscoli CM, Kent DM, Conwit R, et al. A scoring system to optimize pioglitazone therapy after stroke based on fracture risk. Stroke 2019;40: (forthcoming). 10.1161/STROKEAHA.118.022745. [DOI] [PMC free article] [PubMed] [Google Scholar]
- 103. Costa F, van Klaveren D, James S, et al. PRECISE-DAPT Study Investigators Derivation and validation of the predicting bleeding complications in patients undergoing stent implantation and subsequent dual antiplatelet therapy (PRECISE-DAPT) score: a pooled analysis of individual-patient datasets from clinical trials. Lancet 2017;389:1025-34. 10.1016/S0140-6736(17)30397-5 [DOI] [PubMed] [Google Scholar]
- 104. Yeh RW, Secemsky EA, Kereiakes DJ, et al. DAPT Study Investigators Development and validation of a prediction rule for benefit and harm of dual antiplatelet therapy beyond 1 year after percutaneous coronary intervention. JAMA 2016;315:1735-49. 10.1001/jama.2016.3775 [DOI] [PMC free article] [PubMed] [Google Scholar]
- 105. Kent DM, Thaler DE, RoPE Study Investigators The Risk of Paradoxical Embolism (RoPE) Study: developing risk models for application to ongoing randomized trials of percutaneous patent foramen ovale closure for cryptogenic stroke. Trials 2011;12:185. 10.1186/1745-6215-12-185 [DOI] [PMC free article] [PubMed] [Google Scholar]
- 106. Sinclair JC, Haynes RB. Selecting participants that raise a clinical trial’s population attributable fraction can increase the treatment effect within the trial and reduce the required sample size. J Clin Epidemiol 2011;64:893-902. 10.1016/j.jclinepi.2010.12.006 [DOI] [PubMed] [Google Scholar]
- 107. Kent DM, Ruthazer R, Weimar C, et al. An index to identify stroke-related vs incidental patent foramen ovale in cryptogenic stroke. Neurology 2013;81:619-25. 10.1212/WNL.0b013e3182a08d59 [DOI] [PMC free article] [PubMed] [Google Scholar]
- 108. Mozaffarian D, Anker SD, Anand I, et al. Prediction of mode of death in heart failure: the Seattle Heart Failure Model. Circulation 2007;116:392-8. 10.1161/CIRCULATIONAHA.106.687103 [DOI] [PubMed] [Google Scholar]
- 109. Kent DM, Alsheikh-Ali A, Hayward RA. Competing risk and heterogeneity of treatment effect in clinical trials. Trials 2008;9:30. 10.1186/1745-6215-9-30 [DOI] [PMC free article] [PubMed] [Google Scholar]
- 110. Dorresteijn JA, Kaasenbrood L, Cook NR, et al. How to translate clinical trial results into gain in healthy life expectancy for individual patients. BMJ 2016;352:i1548. 10.1136/bmj.i1548 [DOI] [PubMed] [Google Scholar]
- 111. van Klaveren D, Vergouwe Y, Farooq V, Serruys PW, Steyerberg EW. Estimates of absolute treatment benefit for individual patients required careful modeling of statistical interactions. J Clin Epidemiol 2015;68:1366-74. 10.1016/j.jclinepi.2015.02.012 [DOI] [PMC free article] [PubMed] [Google Scholar]
- 112. Hingorani AD, Windt DA, Riley RD, et al. PROGRESS Group Prognosis research strategy (PROGRESS) 4: stratified medicine research. BMJ 2013;346:e5793. 10.1136/bmj.e5793 [DOI] [PMC free article] [PubMed] [Google Scholar]
- 113.Harrell FE. Statistical thinking: viewpoints on heterogeneity of treatment effect and precision medicine. http://www.fharrell.com/post/hteview/
- 114. Venema E, Mulder MJHL, Roozenbeek B, et al. Selection of patients for intra-arterial treatment for acute ischaemic stroke: development and validation of a clinical decision tool in two randomised trials. BMJ 2017;357:j1710. 10.1136/bmj.j1710 [DOI] [PMC free article] [PubMed] [Google Scholar]
- 115. Kent DM, Selker HP, Ruthazer R, Bluhmki E, Hacke W. The stroke-thrombolytic predictive instrument: a predictive instrument for intravenous thrombolysis in acute ischemic stroke. Stroke 2006;37:2957-62. 10.1161/01.STR.0000249054.96644.c6 [DOI] [PubMed] [Google Scholar]
- 116. Tibshirani R, Bien J, Friedman J, et al. Strong rules for discarding predictors in lasso-type problems. J R Stat Soc Series B Stat Methodol 2012;74:245-66. 10.1111/j.1467-9868.2011.01004.x [DOI] [PMC free article] [PubMed] [Google Scholar]
- 117. Tibshirani R. Regression shrinkage and selection via the lasso. J Royal Stat Soc 1996;B:267-88. [Google Scholar]
- 118. Hoerl AE, Kennard R. Ridge regression: biased estimation for nonorthogonal problems. Technometrics 1970;12:55-67 10.1080/00401706.1970.10488634 . [DOI] [Google Scholar]
- 119. Le Cessie S, Van Houwelingen JC. Ridge estimators in logistic regression. Statistics 1992;41:191-201. 10.2307/2347628 [DOI] [Google Scholar]
- 120. Simon N, Friedman J, Hastie T, Tibshirani R. Regularization paths for Cox’s proportional hazards model via coordinate descent. J Stat Softw 2011;39:1-13. 10.18637/jss.v039.i05 [DOI] [PMC free article] [PubMed] [Google Scholar]
- 121. Basu S, Sussman JB, Rigdon J, Steimle L, Denton BT, Hayward RA. Benefit and harm of intensive blood pressure treatment: Derivation and validation of risk models using data from the SPRINT and ACCORD trials. PLoS Med 2017;14:e1002410. 10.1371/journal.pmed.1002410 [DOI] [PMC free article] [PubMed] [Google Scholar]
- 122. Powers S, Qian J, Jung K, et al. Some methods for heterogeneous treatment effect estimation in high dimensions. Stat Med 2018;37:1767-87. 10.1002/sim.7623 [DOI] [PMC free article] [PubMed] [Google Scholar]
- 123. Athey S, Imbens G. Recursive partitioning for heterogeneous causal effects. Proc Natl Acad Sci U S A 2016;113:7353-60. 10.1073/pnas.1510489113 [DOI] [PMC free article] [PubMed] [Google Scholar]
- 124. Wager S, Athey S. Estimation and inference of heterogeneous treatment effects using random forests. J Am Stat Assoc 2018. 10.1080/01621459.2017.1319839 [DOI] [Google Scholar]
- 125. Claggett B, Tian L, Castagno D, Wei LJ. Treatment selections using risk-benefit profiles based on data from comparative randomized clinical trials with multiple endpoints. Biostatistics 2015;16:60-72. 10.1093/biostatistics/kxu037 [DOI] [PMC free article] [PubMed] [Google Scholar]
- 126. Cai T, Tian L, Wong PH, Wei LJ. Analysis of randomized comparative clinical trial data for personalized treatment selections. Biostatistics 2011;12:270-82. 10.1093/biostatistics/kxq060 [DOI] [PMC free article] [PubMed] [Google Scholar]
- 127. van der Laan MJ, Luedtke AR. Targeted learning of the mean outcome under an optimal dynamic treatment rule. J Causal Inference 2015;3:61-95. 10.1515/jci-2013-0022 [DOI] [PMC free article] [PubMed] [Google Scholar]
- 128. Zhao L, Tian L, Cai T, Claggett B, Wei LJ. Effectively selecting a target population for a future comparative study. J Am Stat Assoc 2013;108:527-39. 10.1080/01621459.2013.770705 [DOI] [PMC free article] [PubMed] [Google Scholar]
- 129. Luedtke AR, van der Lann MJ. Statistical inference for the mean outcome under a possibly non-unique optimal treatment strategy. Ann Stat 2016;44:713-42 10.1214/15-AOS1384 [DOI] [PMC free article] [PubMed] [Google Scholar]
- 130. Luedtke AR, van der Laan MJ. Optimal dynamic treatments in resource-limited settings. Int J Biostat 2016;12:283-303. 10.1515/ijb-2015-0007 [DOI] [PMC free article] [PubMed] [Google Scholar]
- 131. Lipkovich I, Dmitrienko A, B R. Tutorial in biostatistics: data-driven subgroup identification and analysis in clinical trials. Stat Med 2017;36:136-96. 10.1002/sim.7064 [DOI] [PubMed] [Google Scholar]
- 132. Serruys PW, Morice MC, Kappetein AP, et al. SYNTAX Investigators Percutaneous coronary intervention versus coronary-artery bypass grafting for severe coronary artery disease. N Engl J Med 2009;360:961-72. 10.1056/NEJMoa0804626 [DOI] [PubMed] [Google Scholar]
- 133. Farooq V, van Klaveren D, Steyerberg EW, et al. Anatomical and clinical characteristics to guide decision making between coronary artery bypass surgery and percutaneous coronary intervention for individual patients: development and validation of SYNTAX score II. Lancet 2013;381:639-50. 10.1016/S0140-6736(13)60108-7 [DOI] [PubMed] [Google Scholar]
- 134. Janes H, Pepe MS, McShane LM, Sargent DJ, Heagerty PJ. The fundamental difficulty with evaluating the accuracy of biomarkers for guiding treatment. J Natl Cancer Inst 2015;107:djv157. 10.1093/jnci/djv157 [DOI] [PMC free article] [PubMed] [Google Scholar]
- 135. Holland PW. Statistics and causal inference. J Am Stat Assoc 1986;81:945-60 10.1080/01621459.1986.10478354 [DOI] [Google Scholar]
- 136. van Klaveren D, Steyerberg EW, Serruys PW, Kent DM. The proposed ‘concordance-statistic for benefit’ provided a useful metric when modeling heterogeneous treatment effects. J Clin Epidemiol 2018;94:59-68. 10.1016/j.jclinepi.2017.10.021 [DOI] [PMC free article] [PubMed] [Google Scholar]
- 137. Huang Y, Gilbert PB, Janes H. Assessing treatment-selection markers using a potential outcomes framework. Biometrics 2012;68:687-96. 10.1111/j.1541-0420.2011.01722.x [DOI] [PMC free article] [PubMed] [Google Scholar]
- 138. Vickers AJ, Elkin EB. Decision curve analysis: a novel method for evaluating prediction models. Med Decis Making 2006;26:565-74. 10.1177/0272989X06295361 [DOI] [PMC free article] [PubMed] [Google Scholar]
- 139. Vickers AJ, Kattan MW, Daniel S. Method for evaluating prediction models that apply the results of randomized trials to individual patients. Trials 2007;8:14. 10.1186/1745-6215-8-14 [DOI] [PMC free article] [PubMed] [Google Scholar]
- 140. Vickers AJ, Van Calster B, Steyerberg EW. Net benefit approaches to the evaluation of prediction models, molecular markers, and diagnostic tests. BMJ 2016;352:i6. 10.1136/bmj.i6 [DOI] [PMC free article] [PubMed] [Google Scholar]
- 141. Selker HP, Beshansky JR, Griffith JL, TPI Trial Investigators Use of the electrocardiograph-based thrombolytic predictive instrument to assist thrombolytic and reperfusion therapy for acute myocardial infarction. A multicenter, randomized, controlled, clinical effectiveness trial. Ann Intern Med 2002;137:87-95. 10.7326/0003-4819-137-2-200207160-00006 [DOI] [PubMed] [Google Scholar]
- 142. Wallace PJ, Shah ND, Dennen T, Bleicher PA, Crown WH. Optum Labs: building a novel node in the learning health care system. Health Aff (Millwood) 2014;33:1187-94. 10.1377/hlthaff.2014.0038 [DOI] [PubMed] [Google Scholar]
- 143. Krumholz HM. Big data and new knowledge in medicine: the thinking, training, and tools needed for a learning health system. Health Aff (Millwood) 2014;33:1163-70. 10.1377/hlthaff.2014.0053 [DOI] [PMC free article] [PubMed] [Google Scholar]
- 144. Agoritsas T, Merglen A, Shah ND, O’Donnell M, Guyatt GH. Adjusted analyses in studies addressing therapy and harm: users’ guides to the medical literature. JAMA 2017;317:748-59. 10.1001/jama.2016.20029 [DOI] [PubMed] [Google Scholar]
- 145. Li F, Morgan LK, Zaslavsky AM. Balancing covariates via propensity score weighting. J Am Stat Assoc 2018;113:390-400 10.1080/01621459.2016.1260466 [DOI] [Google Scholar]
- 146. Goodman SN, Schneeweiss S, Baiocchi M. Using design thinking to differentiate useful from misleading evidence in observational research. JAMA 2017;317:705-7. 10.1001/jama.2016.19970 [DOI] [PubMed] [Google Scholar]
- 147. Franklin JM, Schneeweiss S. When and how can real world data analyses substitute for randomized controlled trials? Clin Pharmacol Ther 2017;102:924-33. 10.1002/cpt.857. [DOI] [PubMed] [Google Scholar]
- 148. Salisbury AC, Spertus JA. Realizing the potential of clinical risk prediction models: where are we now and what needs to change to better personalize delivery of care? Circ Cardiovasc Qual Outcomes 2015;8:332-4. 10.1161/CIRCOUTCOMES.115.002038 [DOI] [PubMed] [Google Scholar]
- 149. Decker C, Garavalia L, Garavalia B, et al. Understanding physician-level barriers to the use of individualized risk estimates in percutaneous coronary intervention. Am Heart J 2016;178:190-7. 10.1016/j.ahj.2016.03.027 [DOI] [PMC free article] [PubMed] [Google Scholar]
- 150. Collins GS, Reitsma JB, Altman DG, Moons KG, TRIPOD Group Transparent reporting of a multivariable prediction model for individual prognosis or diagnosis (TRIPOD): the TRIPOD statement. Circulation 2015;131:211-9. 10.1161/CIRCULATIONAHA.114.014508 [DOI] [PMC free article] [PubMed] [Google Scholar]
- 151. Krumholz HM, Ross JS, Gross CP, et al. A historic moment for open science: the Yale University Open Data Access project and medtronic. Ann Intern Med 2013;158:910-1. 10.7326/0003-4819-158-12-201306180-00009 [DOI] [PMC free article] [PubMed] [Google Scholar]
- 152. Dahabreh IJ, Kent DM. Can the learning health care system be educated with observational data? JAMA 2014;312:129-30. 10.1001/jama.2014.4364 [DOI] [PubMed] [Google Scholar]