

Supplemental Digital Content is available in the text.
Keywords: Artificial intelligence, Melbourne thunderstorm, Natural language processing, Social media, Social media analytics, Syndromic surveillance, Time series analysis
Background:
Melbourne, Australia, witnessed a thunderstorm asthma outbreak on 21 November 2016, resulting in over 8,000 hospital admissions by 6 p.m. This is a typical acute disease event. Because the time to respond is short for acute disease events, an algorithm based on time between events has shown promise. Shorter the time between consecutive incidents of the disease, more likely the outbreak. Social media posts such as tweets can be used as input to the monitoring algorithm. However, due to the large volume of tweets, a large number of alerts may be produced. We refer to this problem as alert swamping.
Methods:
We present a four-step architecture for the early detection of the acute disease event, using social media posts (tweets) on Twitter. To curb alert swamping, the first three steps of the algorithm ensure the relevance of the tweets. The fourth step is a monitoring algorithm based on time between events. We experiment with a dataset of tweets posted in Melbourne from 2014 to 2016, focusing on the thunderstorm asthma outbreak in Melbourne in November 2016.
Results:
Out of our 18 experiment combinations, three detected the thunderstorm asthma outbreak up to 9 hours before the time mentioned in the official report, and five were able to detect it before the first news report.
Conclusions:
With appropriate checks against alert swamping in place and the use of a monitoring algorithm based on time between events, tweets can provide early alerts for an acute disease event such as thunderstorm asthma.
Epidemic intelligence involves the systematic detection of disease outbreaks from formal and informal sources.1 Although formal sources (such as hospital records) can provide incidence counts, informal sources (such as social media) can be used to detect these outbreaks before they are apparent in the formal sources.1 The popularity of social media makes it a valuable source of information for epidemic intelligence2,3
In this article, we demonstrate that early detection using social media posts published on Twitter (i.e., tweets) is feasible for an acute disease event. Specifically, we focus on thunderstorm asthma, a form of asthma that is triggered by an allergen or irritant dispersed by a storm.4,5 An outbreak of thunderstorm asthma occurred in Melbourne, Australia, in 2016. This event occurred within minutes to hours of a storm. This is a more rapid timescale than infectious disease outbreaks, which occur after the disease incubation period of days to weeks. Therefore, the challenge in the case of an acute disease event is to detect it with as much lead time as possible, so as to assist appropriate reports/responses published by the concerned health agencies. Because we rely on publicly available social media posts alone, the early notification in the case of acute disease events may also be useful for stakeholders outside health agencies, where the access to health department data or the integration of health department data with social media data may not be possible.
The goal of this article is to describe the automated identification of reports of asthma in tweets and use the tweets to detect the outbreak. To that end, we present a four-step architecture that combines natural language processing with statistical monitoring. The architecture takes as input a large stream of tweets, employs natural language processing techniques to curate the stream, and then applies a monitoring algorithm to predict the disease outbreak.
OUR CASE STUDY
Thunderstorm asthma is a form of asthma caused due to an increase in the level of pollen and a certain kind of thunderstorm. Thunderstorm asthma may impact individuals with no history of asthma. Asthma is associated with symptoms such as breathlessness, wheezing, and a continuing cough.6 On 21 November 2016, a thunderstorm asthma outbreak occurred in Melbourne, Australia.7 As per the Chief Health Officer’s report8 published in April 2017, there was a 73% increase in the number of phone calls to emergency services and a 10-fold increase in the number of presentations in hospitals for respiratory cases. The report mentions that “by 6 p.m. … the shock of this unprecedented surge in patients with asthma symptoms and respiratory distress” was felt.
Challenges
For acute disease events, outbreak detection algorithms based on counts are insufficient. This is because the counts are computed at the end of a predetermined time period (such as a day or an hour), which is only when the outbreak can be predicted. The time period determines the level of granularity of the algorithm (e.g., end-of-the-day or end-of-the-hour, respectively). As an alternative, time between events can be used.9 Time between events is the time elapsed between the occurrences of two consecutive events. Instead of counting the number of events per time period, the algorithm relies on the change in the time between events as an indicator of an outbreak. The shorter the time between events, the more likely an outbreak.
As a starting point, we apply the time between events–based algorithm to a stream of tweets that contain inflected forms of the word “breath,” posted in Melbourne between 2014 and 2016. Figure 1 shows the results for the monitoring algorithm9 for these tweets. The y axis represents the adapted exponentially weighted moving average of time between events over time on the x axis. The algorithm states that when the value of adapted moving average is lower than one, an alert is triggered. The horizontal line indicates the threshold of one. The points below the line indicate an alert. The figure shows long tails below the line, indicating that the alerts are far too frequent. We refer to this situation as “alert swamping,” that is, too many positive alerts. This is likely to result in a high false-positive rate because outbreaks are not as frequent. Because an outbreak detection algorithm would require actions from the emergency services, the goal would be to keep the alerts to as few as possible, without missing out the real outbreaks. This means that a direct application of time between events–based monitoring to a large dataset of tweets filtered merely on the basis of keywords may not work, because the volume of tweets may be high without all of them being related to the disease event.
FIGURE 1.
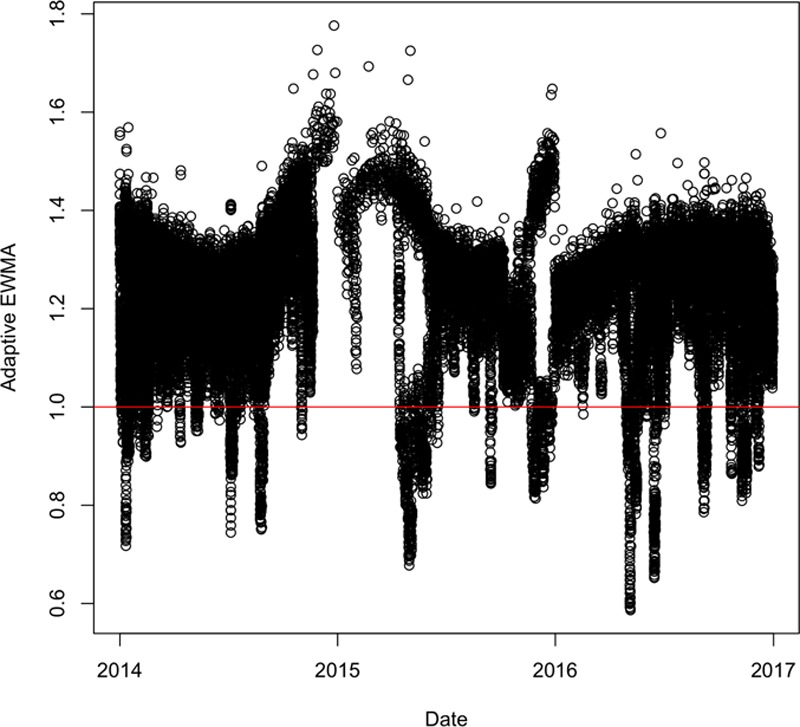
An example of alert swamping: tweets containing inflected forms of “Breath.”
Thus, the two key challenges of using social media text for an acute disease event are the time-criticality of the detection (due to the nature of the event), and alert swamping (due to the nature of the data).
METHODS
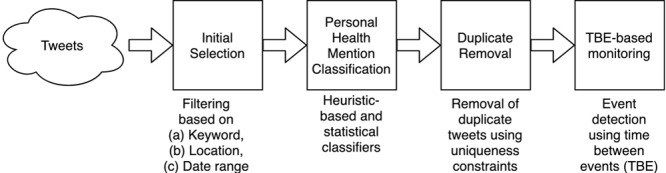
The four-step architecture of our system is shown in Figure 2. The four steps were as follows: initial selection, personal health mention classification, duplicate removal, and time between events–based monitoring. The first three steps dealt with alert swamping, while the last step related to the time-criticality of the detection of the outbreak. The first three steps of the architecture altered the notion of an event which then becomes an input to the monitoring algorithm. Instead of a tweet as an event, we defined an event as “a uniquely worded tweet that reports a health incident, posted by a unique user on any given day.” Because a person may report an incident multiple times through multiple tweets, it was reasonable to restrict to the first personal health mention per user, per day. In addition, we assumed that the likelihood of more than one incident per day is rare. The word “personal health mention” implies that a person reports the health incident (which is not restricted to merely mentioning a symptom word in the tweet). Automatic prediction of whether or not a tweet is a personal health mention is handled in step 2. In addition, the restriction on uniqueness is handled in step 3. The following subsections describe the details of each of the steps. This work used only publicly available tweets as provided by Twitter endpoints at the time of conducting the experiments. Ethics clearance was provided by the Ethics Review Committee with the identifier 080/15 titled “Exploring salient themes in public discourse through a social media lens.”
FIGURE 2.
Our architecture.
Step 1: Initial Selection
The input to this step was a set of filtering parameters applied to a database of tweets. The output of this step was a dataset of tweets where each tweet contains the text, timestamp, and the username of the author on Twitter. We used the Emergency System Awareness (ESA) Historical database10 as the source of tweets. This database contained tweets that were downloaded according to a predetermined set of keywords and geolocation boundaries to capture content posted in Australia. These data were collected using the Twitter Streaming and REST Application Programming Interfaces.11 The Streaming Application Programming Interface limits the number of tweets returned in response to queries. If there are more than a rate limit, only a sample was returned. The Representational State Transfer (Representational State Transfer (REST)) API only allowed a fixed number of calls to be made per time interval. Due to these restrictions, the ESA database contained a subset of all tweets that are posted. However, due to ESA’s combined usage of the Streaming and REST APIs and the focus on the Australian region, the tweets were a reasonable sample of the volume of tweets.
In this first step, we performed an initial selection based on the following filtering parameters:
Time period: We selected tweets that were posted from 2014 to 2016;
Location: We selected tweets that contain Melbourne either in the tweet location or the user location; and
Keyword: We created three sets of tweets: (a) tweets that contain the word “breath” and its inflected forms, (b) tweets that contain the word “cough” and its inflected forms, and (c) tweets that contain names of two closely linked illnesses, i.e., thunderstorm asthma and hay fever. While (a) and (b) correspond to symptoms, (c) indicated the name of the illness. The three sets represented three kinds of information to the system: (a) in the case of the thunderstorm asthma outbreak, many reported breathing difficulties. Therefore, “breath” represented breathing difficulties, a well-known symptom of the outbreak; (b) coughing is a related symptom; (c) alerts may be triggered based on when the actual names of the illness appear in the social media posts. We drew observations from the three datasets separately so as to understand what kind of keywords are useful for the task.
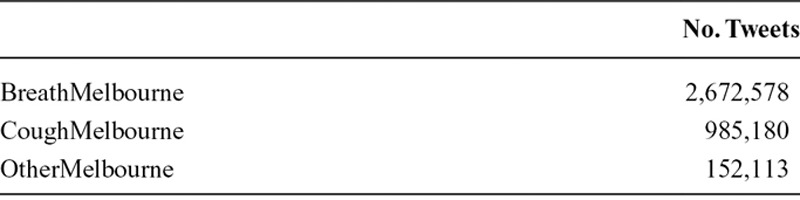
The three datasets created in (a), (b), and (c) are referred to as “BreathMelbourne,” “CoughMelbourne,” and “OtherMelbourne,” respectively. The statistics of the dataset are shown in Table 1.
TABLE 1.
Dataset Statistics
Step 2: Personal Health Mention Classification
Tweets containing words indicating diseases or symptoms may not necessarily be reports of the disease or symptom (e.g., the sentence “we use our lungs to breathe” contains the word “breathe” but is not the report of a breathing difficulty). Therefore, the next step in the architecture was personal health mention classification.12 The goal was to predict whether or not a tweet indicates a personal health mention. A personal health mention is defined as a person’s report of a disease or symptom affecting themselves or others.
The input to this step was the dataset of tweets from the previous step. Each tweet contained the text, the author’s Twitter username, and the timestamp. The output of this step was the tweets which have been predicted as personal health mentions. The information corresponding to these personal health mentions was retained, namely, the text, the username, and the timestamp. We experimented with two alternatives for personal health mention classification:
Heuristic-based classification: This was a rule-based approach where we selected tweets containing symptom words along with words that express inability/difficulty, like “difficult, unable, cannot.” We referred to this classifier as “Heur.”
Statistical classification: This was a statistical approach where each tweet is represented as a fixed-length tweet vector based on word embeddings, and used in a statistical classifier. The tweet vector for a tweet was obtained as shown in Figure 3. We used a model that learns fixed-length vectors (known as “word embeddings”) to represent words, as trained on a large corpus. These distributional representations (or “embeddings”) were real-valued vectors that represent the meaning of a word, as learned from large textual corpora. The tweet vector was an average of word vectors of content words present in the tweet. We obtained the word vectors from a publicly available, pretrained model by GloVe.13 The GloVe algorithm takes word co-occurrence statistics as input and computes vectors for words. When trained on a large corpus, the GloVe embeddings capture meanings of words.13 This meant that vectors of words with similar meaning can be expected to have high cosine similarity. In the case of GloVe, 200-dimension vectors are learned from a corpus with 27 billion unique words. We compared these classifiers with feature vector representations based on n-grams in the eAppendix; http://links.lww.com/EDE/B609.
FIGURE 3.
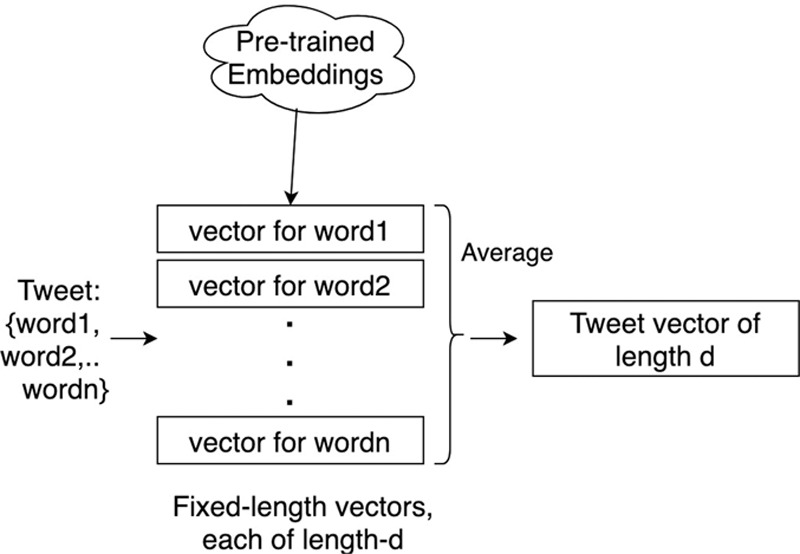
Tweet vector creation for personal health mention classification.
Using tweet vectors as feature representations, we trained two classifiers. The first was based on support vector machines, specifically the LIBSVM implementation,14 while the other was based on SVM Perf.15 Also, for both LIBSVM and SVM Perf, we used nonuniform misclassification costs. The cost for positive class was set to 5 in the case of LIBSVM and 30 in the case of SVM Perf. We refer to them as Stat-SVM and Stat-SVMPerf. These classifiers were trained a priori on a dataset of tweets,12 where each tweet is represented as a tweet vector. The distinction between LIBSVM and SVM Perf, a comparison of tweet vectors with typical n-gram–based vectors, and the details of the misclassification costs are included in the eAppendix; http://links.lww.com/EDE/B609, section 1. The code corresponding to this step is written in Python 3.7.4 due to its ease of use with large, text-based datasets.
Step 3: Duplication Removal
Epidemic intelligence using hospital records considers a hospital presentation or a hospital admission as an event. We observe that social media poses peculiar challenges when tweets are used. While a person presenting themselves to a hospital got counted as one event, a person reporting their health condition in multiple tweets or replying to the comments on their tweet(s) results in multiple events. Similarly, the person could also retweet related tweets. As a result, a tweet by itself could be regarded as an event.
The third step involved removal of potentially duplicate tweets. The input was the set of tweets that have been predicted as health reports. The output was a subset of these tweets with duplicates removed. We did so as follows:
For every user, we retained only the first tweet of the day. In this case, “tweet” indicated a tweet that has been predicted as true by the personal health mention classification step. Other posts by the same user on that day were removed. This helped to remove potentially duplicate reports of the disease by the same user.
Retweets and tweets with duplicate text were removed. If a tweet contained hyperlinks, the hyperlinks were ignored when checking for duplicate tweets. This was because a lot of shortened hyperlinks may have different text (e.g., bit.ly links and a longer hyperlink could point to the same web page). This helped to avoid potential duplicate reports of the disease by different users.
It must be noted that the duplication removal step was applied after personal health classification step. Therefore, it was not the first tweet per day by a user that we retained. It was the first tweet predicted to be a health report, per day, per user. We felt that all datasets would experience some selection biases and we attempt to only count a person’s symptom once during an outbreak event in attempt to not over-represent the same individual during the event. The duplication removal code was written in Python for its ease of use with textual datasets.
Step 4: Time Between Events–based Monitoring Algorithm
We adapted the monitoring algorithm.9 The algorithm computes an adapted expected weighted moving average of time-between-event values. The adapted expected weighted moving average is defined for heterogeneous usual time series trends, such that the metric provides a ballpark measure for flagging outbreaks.
The pseudocode of the algorithm is shown in Figure 4. The algorithm is summarized as follows. The timestamps of all events were converted to integers using the Julian value of the earliest timestamp as the starting point. For example, if the first tweet in the dataset was posted on 10 July 2016 at 10:00 a.m., the earliest timestamp is for Julian(10 July 2016) + (10/24). We accounted for daily, monthly, and yearly seasonality. The time-between-events values were computed as the difference between timestamps of consecutive events. We then fitted a Weibull distribution for the time-between-events values. After that, for every event, we computed the adapted exponentially weighted moving average as a function of time between events, false-discovery rate, and the scale and shape parameters obtained from the Weibull distribution.
FIGURE 4.
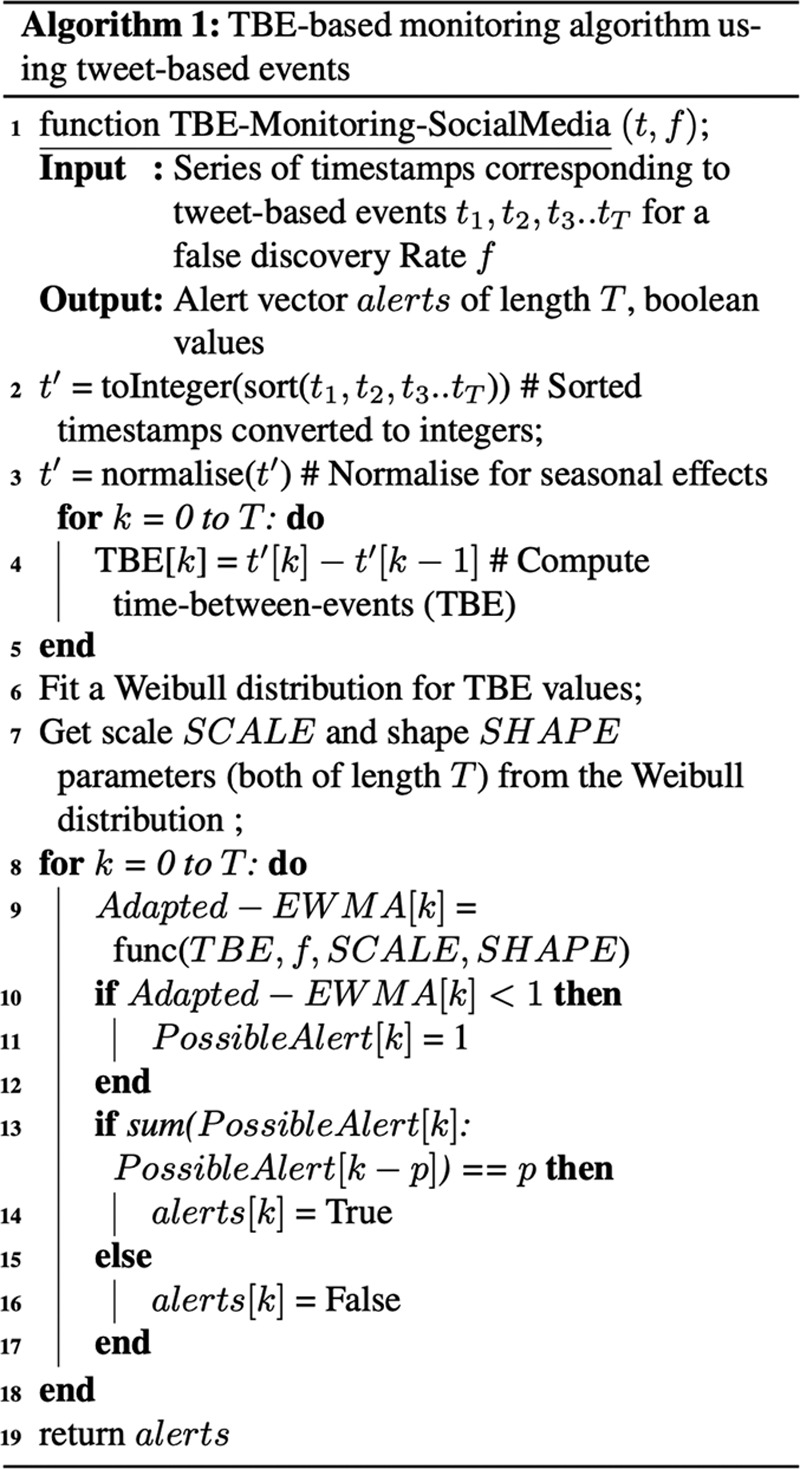
Monitoring algorithm (Step 4).
The false-discovery rate refers to the flagging of an outbreak when no outbreak has occurred, thus triggering a false alarm. We experimented with two values of the false-discovery rate: 1 in 1,000 and 1 in 2,000 events. Step 13 in the algorithm was different from the original article: the algorithm signaled an alert when at least P consecutive tweets have an adapted moving average lower than 1. The significance of using these consecutive alerts was described in the eAppendix; http://links.lww.com/EDE/B609. In the case of 1 in 1,000, the algorithm looked for four alerts in a sequence. On the other hand, in the case of 1 in 2,000, the algorithm looked for two alerts in a sequence. We used R to implement the algorithm, and the GAMLSS model16 to fit the Weibull distribution.
RESULTS
In this section, we evaluate a system that uses our four-step architecture. We first show alert graphs for three classifier–dataset–false discovery rate configurations, and then present a comprehensive summary of all configurations.
Alert Graphs
We first discuss how frequent the alerts generated by the architecture are. To do so, we use the alert graphs for the “Stat-SVMPerf” classifier. Figure 5A shows the alert graph for the “BreathMelbourne” dataset for the false-discovery rate of 1 in 1,000. The horizontal line indicates the threshold for the number of consecutive alerts. The points above the threshold indicate alerts because of the constraint in step 13 of the algorithm. Similarly, Figure 5B shows the alert graph for the “CoughMelbourne” dataset. Finally, Figure 5C shows the alert graph for the “OtherMelbourne” dataset. The three figures show that the alerts before 2016 are far few in number. This highlights that the four-step architecture also does not generate frequent alerts.
FIGURE 5.
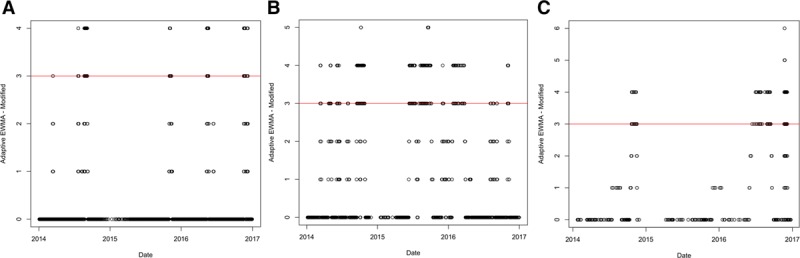
Alert graphs using Stat-SVMPerf for the three datasets: (A) BreathMelbourne, (B) CoughMelbourne, and (C) OtherMelbourne.
Relevant Alerts
We now discuss the accuracy of the architecture with respect to the relevant alerts for the acute disease event. Table 2 shows the timestamps for relevant alerts generated for all the classifier–dataset–false-discovery rate combinations described in our architecture. We consider an alert as relevant if it occurred within 5 days of our event of interest. “Within” implies before or after the alert, with “before” getting priority because we would want the algorithm to detect the outbreak as early as possible. Entries in bold are on or before 21 November 2016.
TABLE 2.
Relevant Alerts Generated Using Different Dataset and Classifier Combinations; Alerts Within 5 Days of the Actual Acute Disease Event Mentioned
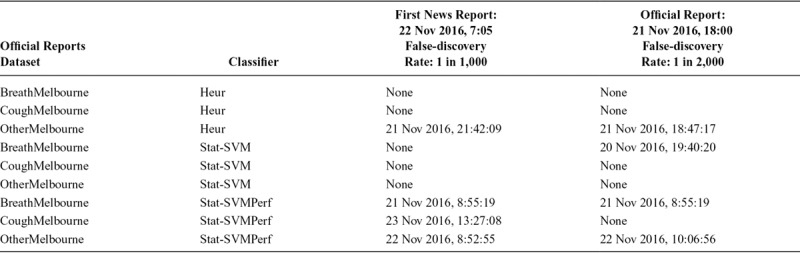
Three cells in the table contain timestamps before the time mentioned in the time in the official report (6 p.m.). This means that our system was able to detect the event before the official report in these three cases: namely, BreathMelbourne-StatSVMPerf-1 in 1000, BreathMelbourne StatSVMPerf-1 in 2,000, and BreathMelbourne-StatSVM-1 in 2,000. Similarly, in a total of five cases, our system was able to detect the event before the first news report.
In the case of the Heur classifier, both the symptom datasets are unable to detect an alert. This shows that naïve rules (based on merely presence of words) may not adequately capture personal health mentions, and, as a result, impact the performance of epidemic intelligence. This makes a case for more sophisticated natural language processing techniques. Similarly, the support vector machine—specifically LIBSVM—is a popular classifier for epidemic intelligence.12 However, we observe that SVMPerf obtains more relevant alerts than LIBSVM alone. In the case of LIBSVM, only one (out of six) configuration results in a relevant alert, while in the case of SVM Perf, five (out of six) configurations return relevant alerts.
Similarly, in the case of “Other,” all relevant alerts are after the official time. The dataset based on “Breath” also returns relevant alerts in more cases than the dataset based on “Cough.” This is a useful pointer to what symptom words are useful when social media–based streams are used for detecting such acute disease events. We also point the reader to eAppendix; http://links.lww.com/EDE/B609, part 2 for a related discussion on classifiers that use n-grams as features. It highlights the value of the specific feature representation based on word embeddings. The comparison between “breath,” “cough,” and “other” also holds in the case of n-gram–based classification.
DISCUSSION
The goal of this study was to use natural language processing (specifically, the task of statistical text classification) and time series monitoring for the early detection of the thunderstorm asthma outbreak in Melbourne in 2016.
The main findings of our article are two-fold. First, there has been past study that uses social media posts to detect epidemic outbreaks, as described in the Discussion. However, to the best of our knowledge, this is the first study that does so for an acute disease event, and, specifically, for this incident of thunderstorm asthma. The thunderstorm asthma event in Melbourne was an acute event that transpired over a period of 30 hours, with sudden, rapid onset triggered by an allergen or irritant dispersed by a storm. While individual doctors or hospitals may have seen individual patients, an overall population picture of a severe event only became apparent to authorities as the evening progressed and ambulance services and emergency departments became stressed. We report a 9-hour advantage. In such a rapid onset event, the advantage is potentially valuable to health authorities, as it could assist with surge capacity preparation and also with putting out public alerts to warn asthmatics to remain indoors.
Second, we identify a peculiar problem of “alert swamping” that occurs when tweets are selected only because they contain a keyword. We adapt the notion of an event in a monitoring algorithm to mitigate alert swamping, by using natural language processing techniques to automate the selection of health reporting tweets instead of tweets that contain a symptom keyword. In general, our alternative notion of an event when using tweet-based datasets will be useful for future study that uses social media for health monitoring.
Because our study combines recent study in statistical text classification with a time series monitoring algorithm for an acute disease event, we describe past study in three parts: (a) past study in statistical text classification for similar tasks and using similar classification techniques; (b) past study that is similar because it also focuses on a disease event; and, (c) past study that uses similar monitoring algorithms to detect these disease events.
Statistical Text Classification
Several approaches that use text classification techniques for the detection of relevant health tweets have been reported in the past.12,17–19 These approaches use a combination of features in statistical classifiers. In contrast, our classification technique uses a sentence vector as a feature representation for a statistical classifier. Support vector machines trained on word embedding-based vectors have been found to be useful for sentiment detection,20 clinical information extraction,21 or vaccine usage detection.22 To our knowledge, this has not been applied thus far for personal health mention classification.
Disease Events in Focus
Our study focuses on the thunderstorm asthma outbreak in Melbourne. Similarly, there has been past study that focuses on certain disease events. Counts of search queries to predict counts of influenza-like infections have been used.18 Similarly, clusters of entities extracted from large datasets have been used to predict influenza and Lyme outbreaks.3 Frequency counts of social media posts have also been used to predict outbreaks for influenza.23 Research focused on other disease events such as the Ebola outbreak in London24 and a Zika virus outbreak25 has also been reported. In terms of the specific thunderstorm asthma outbreak that we focus on, a sentiment analysis service has been applied to detect sentiment in tweets in Melbourne on 21 November, and report a rise in negative sentiments.26 However, they do not perform monitoring or prediction of the event. To the best of our knowledge, ours is the first study that deals with the use of social media data for the thunderstorm asthma event.
Monitoring Algorithms
The novelty of our study is in social media–based monitoring of disease outbreaks in general. A time series monitoring algorithm to keywords used in search engines can be applied to predict outbreaks.27 Similarly, a monitoring algorithm has been applied on counts of keywords present in search queries or social media posts to monitor the Zika epidemic, for 1- to 3-week-ahead predictions.28 Google search counts in a similar algorithm can be used to monitor influenza epidemics.29 In each of these cases, textual entities (tweets or search queries) that are not health reports may still be counted. We aim to avoid this with the personal health mention classification step in our architecture. The work close to ours9 uses the presence of keywords in social media posts. However, they do not incorporate duplicate removal and personal health mention classification, which our architecture does.
Therefore, in terms of how we combine text classification with monitoring algorithms, our study has three strengths:
a. While search queries reflect the popularity of certain symptoms or illnesses, they may describe fear and not necessarily infection. Also, in most cases, search queries or their counts are not available. In contrast, social media datasets are publicly available. This accessibility makes social media text a useful source.
b. We select tweets as accurately as possible to ensure that they report a health condition (i.e., a personal health mention) and do not just mention a keyword. Therefore, we use statistical classifiers trained on word embeddings. Similarly, the duplication removal step ensures that the tweets are as selective as possible. This helps to avoid a high rate of false alarms.
c. Most of the past study for other disease events deals with a lead time of a few days. Our four-step architecture can achieve a lead time of 9 hours. This is critical for acute disease events.
Conclusions and Future Study
This article shows that social media text can be a viable alternative to detect an acute disease event. We focused on the thunderstorm asthma outbreak in Melbourne in 2016. Thunderstorm asthma is known to be an acute disease event.30 To detect the outbreak using tweets, we used a monitoring algorithm based on time-between-events to detect the outbreak from a dataset of tweets. Given the volume of the tweets, the algorithm may suffer from far too many alerts, a problem we called alert swamping. To mitigate alert swamping, we presented a four-step architecture. We first selected tweets using a set of keywords, location, and date range. We then performed health mention classification using three classifiers, followed by duplicate removal. The remaining tweets were used as input to the monitoring algorithm. Using the first three steps resulted in few alerts. For configurations comprising of different dataset, classifier, and discovery rate combinations, we observed that, in three cases, our system was able to detect the outbreak before the official time. In five cases, our system was able to detect the outbreak before the news report. Our investigation leads to two key takeaways. The first points to rule-based classification being insufficient and the need of classifiers such as SVM Perf for epidemic intelligence using social media. The second takeaway is our alternative notion of an event (“a tweet mentioning a health concern by a unique user” as opposed to a “tweet”) to avoid alert swamping. This notion would be useful for time between events–based monitoring algorithms that use social media data.
Official health surveillance and reporting at a population level is delayed, as it requires validation. However, timeliness can be critical in the case of acute disease events. We show that harnessing open-source data such as social media can be automated to alert health authorities to a potential event before official notification. The other application of our methods is that they could be used to detect early signals for other health events such as epidemics, which have a longer lead time, defined by the incubation period of the relevant infection. Toward this, we are currently exploring outbreaks that were unverified for a long time. Our architecture may also be used to identify possible outbreaks for other acute disease events over several years.
Supplementary Material
Footnotes
The authors report no conflicts of interest.
Supplemental digital content is available through direct URL citations in the HTML and PDF versions of this article (www.epidem.com).
The tweet IDs are available on request. The monitoring code is included in the supplementary section.
REFERENCES
- 1.https://www.who.int/csr/alertresponse/epidemicintelligence/en/. Accessed 28 August 2019.
- 2.Woo H, Cho Y, Shim E, Lee JK, Lee CG, Kim SH. Estimating influenza outbreaks using both search engine query data and social media data in South Korea. J Med Internet Res. 2016;18:e177. [DOI] [PMC free article] [PubMed] [Google Scholar]
- 3.Huang P, MacKinlay A, Yepes AJ. Syndromic surveillance using generic medical entities on Twitter. 2016. In Proceedings of the Australasian Language Technology Association Workshop 2016 (5–7 December, 2016). Melbourne, Australia pp. 35–44. [Google Scholar]
- 4.D’Amato G, Liccardi G, Frenguelli G. Thunderstorm-asthma and pollen allergy. Allergy. 2007;62:11–16. [DOI] [PubMed] [Google Scholar]
- 5.Taylor PE, Jonsson H. Thunderstorm asthma. Curr Allergy Asthma Rep. 2004;4:409–413. [DOI] [PubMed] [Google Scholar]
- 6.https://www.asthmaaustralia.org.au/sa/about-asthma/resources/onair/2017/feb/thunderstorm-asthma. Accessed 9 April 2019.
- 7.Thien F, Beggs PJ, Csutoros D, Darvall J, Hew M, Davies JM, et al. The Melbourne epidemic thunderstorm asthma event 2016: an investigation of environmental triggers, effect on health services, and patient risk factors. Lancet Planet Health. 2018;2:e255–e263. [DOI] [PubMed] [Google Scholar]
- 8.https://www2.health.vic.gov.au/Api/downloadmedia/%7B459A8B36-7C70-4C0E-861E-C648BBF4C818%7D. Accessed 14 March 2019.
- 9.Sparks R, Jin B, Karimi S, Paris C. Real-time monitoring of events applied to syndromic surveillance. Quality Engineering. 2019;31:73–90. [Google Scholar]
- 10.Cameron M, Power R, Robinson B, Yin J. Emergency situation awareness from Twitter for crisis management. 2012. In Proceedings of the 21st International Conference on World Wide Web (16–20 April, 2012). Lyon, France pp. 695–698. [Google Scholar]
- 11.https://developer.twitter.com/en/docs.html. Accessed 28 August 2019.
- 12.Lamb A, Paul MJ, Dredze M. Separating fact from fear: Tracking flu infections on Twitter. 2013b. In Proceedings of the 2013 Conference of the North American Chapter of the Association for Computational Linguistics: Human Language Technologies (9–14 June, 2013). Atlanta, GA pp. 789–795. [Google Scholar]
- 13.Pennington J, Socher R, Manning C. Glove: Global vectors for word representation. 2014. In Proceedings of the 2014 conference on empirical methods in natural language processing (EMNLP) pp. 1532–1543. [Google Scholar]
- 14.Chang CC, Lin CJ. Libsvm: a library for support vector machines. ACM Trans Intell Syst Technol. 2011;2:27. [Google Scholar]
- 15.Joachims T. Training linear svms in linear time. 2006. In Proceedings of the 12th ACM SIGKDD international conference on Knowledge discovery and data mining (20–23 August, 2006). Philadelphia, PA ACM; pp. 217–226. [Google Scholar]
- 16.https://cran.r-project.org/web/packages/gamlss/index.html Accessed 14 March 2019.
- 17.Aramaki E, Maskawa S, Morita M. Twitter catches the flu: detecting influenza epidemics using Twitter. 2011. In Proceedings of the conference on empirical methods in natural language processing (27–31 July, 2011). Edinburgh, Scotland Association for Computational Linguistics; pp. 1568–1576. [Google Scholar]
- 18.Ginsberg J, Mohebbi MH, Patel RS, Brammer L, Smolinski MS, Brilliant L. Detecting influenza epidemics using search engine query data. Nature. 2009;457:1012. [DOI] [PubMed] [Google Scholar]
- 19.Culotta A. Towards detecting influenza epidemics by analyzing Twitter messages. 2010. pp. In Proceedings of the first workshop on social media analytics (25–28 July, 2010 Washington, DC ACM; 115, 122. [Google Scholar]
- 20.Tkachenko M, Chia CC, Lauw H. Searching for the x-factor: Exploring corpus subjectivity for word embeddings. 2018. In Proceedings of the 56th Annual Meeting of the Association for Computational Linguistics Association for Computational Linguistics (Melbourne, Australia. 15–20 July, 2018); pp. 1212–1221. [Google Scholar]
- 21.Kholghi M, De Vine L, Sitbon L, Zuccon G, Nguyen A. “The Benefits of Word Embeddings Features for Active Learning in Clinical Information Extraction.” 2016. In Proceedings of the Australasian Language Technology Association Workshop 2016 (5–7 December, 2016 Melbourne, Australia pp. 25–34. [Google Scholar]
- 22.Joshi A, Dai X, Karimi S, Sparks R, Paris C, MacIntyre CR. “Shot Or Not: Comparison of NLP Approaches for Vaccination Behaviour Detection.” 2018. In Proceedings of the 2018 EMNLP Workshop SMM4H: The 3rd Social Media Mining for Health Applications Workshop & Shared Task (1 November, 2018). Brussels, Belgium pp. 43–47. [Google Scholar]
- 23.Sparks R, Robinson B, Power R, Cameron M, Woolford S. An investigation into social media syndromic monitoring. Communications in Statistics-Simulation and Computation. 2017;46:5901–5923. [Google Scholar]
- 24.Ofoghi B, Mann M, Verspoor K. “Towards early discovery of salient health threats: A social media emotion classification technique.” 2016. In Biocomputing 2016: Proceedings of the Pacific Symposium (Hawaii. 408 January, 2016) pp. 504–515. [PubMed] [Google Scholar]
- 25.Adam DC., Jonnagaddala J, Han-Chen D, Batongbacal S, Almeida L, Zhu JZ, et al. ZikaHack 2016: A digital disease detection competition. 2017. In Proceedings of the International Workshop on Digital Disease Detection using Social Media 2017 (27 November 2017). Taipei, Taiwan pp. 39–46. [Google Scholar]
- 26.Ali K, Dong H, Bouguettaya A, Erradi A, Hadjidj R. Sentiment analysis as a service: a social media-based sentiment analysis framework. 2017. In 2017 IEEE International Conference on Web Services (ICWS) (25–30 June, 2017). Honolulu, Hawaii pp. 660–667. [Google Scholar]
- 27.Santillana M, Nguyen AT, Dredze M, Paul MJ, Nsoesie EO, Brownstein JS. Combining search, social media, and traditional data sources to improve influenza surveillance. PLoS Comput Biol. 2015;11:e1004513. [DOI] [PMC free article] [PubMed] [Google Scholar]
- 28.McGough SF, Brownstein JS, Hawkins JB, Santillana M. “Forecasting zika incidence in the 2016 latin America outbreak combining traditional disease surveillance with search, social media, and news report data.” PLoS Negl Trop Dis. 2017;11:e0005295. [DOI] [PMC free article] [PubMed] [Google Scholar]
- 29.Yang S, Santillana M, Kou SC. “Accurate estimation of influenza epidemics using google search data via ARGO.” Proc Natl Acad Sci. 2015;112:14473–14478. [DOI] [PMC free article] [PubMed] [Google Scholar]
- 30.Elliot AJ, Hughes HE, Hughes TC, et al. The impact of thunderstorm asthma on emergency department attendances across London during July 2013. Emerg Med J. 2014;31:675–678. [DOI] [PubMed] [Google Scholar]