

Supplemental Digital Content is available in the text.
Keywords: Falsification, Instrumental inequalities, Instrumental variable, Mendelian randomization
Background:
Investigators often support the validity of Mendelian randomization (MR) studies, an instrumental variable approach proposing genetic variants as instruments, via. subject matter knowledge. However, the instrumental variable model implies certain inequalities, offering an empirical method of falsifying (but not verifying) the underlying assumptions. Although these inequalities are said to detect only extreme assumption violations in practice, to our knowledge they have not been used in settings with multiple proposed instruments.
Methods:
We applied the instrumental inequalities to an MR analysis of the effect of maternal pregnancy vitamin D on offspring psychiatric outcomes, proposing four independent maternal genetic variants as instruments. We assessed whether the proposed instruments satisfied the instrumental inequalities separately and jointly and explored the instrumental inequalities’ properties via simulations.
Results:
The instrumental inequalities were satisfied (i.e., we did not falsify the MR model) when considering each variant separately. However, the inequalities were violated when considering four variants jointly and for some combinations of two or three variants (two of 36 two-variant combinations and 18 of 24 three-variant combinations). In simulations, the inequalities detected structural biases more often when assessing proposed instruments jointly, although falsification in the absence of structural bias remained rare.
Conclusions:
The instrumental inequalities detected violations of the MR assumptions for genetic variants jointly proposed as instruments in our study, although the instrumental inequalities were satisfied when considering each proposed instrument separately. We discuss how investigators can assess instrumental inequalities to eliminate clearly invalid analyses in settings with many proposed instruments and provide appropriate code.
Mendelian randomization (MR), an increasingly popular tool for studying causal effects even when unmeasured confounding appears insurmountable, is a type of instrumental variable (IV) model where genetic variants are proposed as instruments. Briefly, a valid MR analysis with one genetic variant requires:
(1) The genetic variant Z is associated with the exposure X
(2) The genetic variant Z does not affect the outcome Y except through its effect on the exposure X
(3) Individuals at different levels of the genetic variant Z are exchangeable (i.e., comparable) with regard to counterfactual outcome
Conditions 2 and 3 are unverifiable. Forms of these conditions are necessary but not usually sufficient for all versions of MR analyses: obtaining point estimates of an average causal effect requires additional assumptions,1 although these three conditions suffice for estimating bounds and sharp causal null testing.2–4
Frequently, MR analyses propose that multiple single-nucleotide polymorphisms (SNPs) act as instruments and therefore that those SNPs “jointly” satisfy the MR assumptions. Leveraging multiple proposed instruments mitigates issues with power and weak instrument biases that can arise in analyses with a single proposed instrument,5,6 although investigators are then challenged to support that the MR assumptions are satisfied for each SNP and for all SNPs jointly. As many genetic loci jointly proposed as instruments are derived from genome-wide association studies and the exact biologic mechanisms are often poorly understood, it is likely that these required assumptions do not hold for many MR analyses. Given this, several recently developed estimators allow for specific relaxations in exchange for additional, different assumptions.7–12 For example, some approaches only require a subset of proposed instruments are true instruments.8,13
Often missing from the MR literature, however, is any discussion of whether the data are consistent with the MR model proposed. Over 2 decades ago, Pearl14 showed that the IV assumptions imply the following inequality for discrete proposed instruments, exposures, and outcomes:
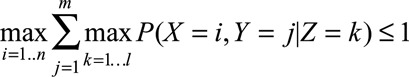 |
which is equivalent to the set of inequalities4 resulting from
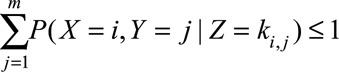 |
for all 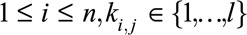
Later, Bonet15 proved the IV model also implies additional constraints, and that such inequalities can be generalized to settings in which the proposed instrument and outcome, but not the exposure, are continuous. Although additional constraints by Bonet15 are often difficult to state with straightforward equations, he did provide one expression for the case of a trichotomous instrument, dichotomous exposure, and dichotomous outcome:
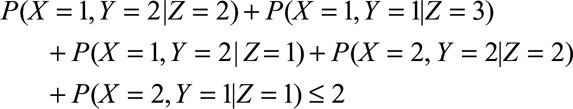 |
If the inequalities presented by Pearl14 and Bonet15, known as instrumental inequalities, do not hold, the IV model cannot hold. This means that investigators can attempt to falsify the IV model with their data alone when they have a dataset with measures of the proposed instrument, exposure, and outcome: if the instrumental inequalities are not satisfied, the data tell us that one or more of our assumptions are not satisfied. Recognizing the importance of falsification strategies (when available) for causal inference, multiple reporting guidelines recommend assessing the instrumental inequalities in all IV analyses.16–18 Despite this, few MR analyses use them, perhaps because, for dichotomous proposed instruments, it has been suggested that only extreme assumption violations will be detected in practice.17,18 No study has applied the instrumental inequalities to investigate the validity of multiple genetic loci jointly proposed as instruments. Here, we aim to explore the utility of the instrumental inequalities in identifying violations of the assumptions required for MR with multiple proposed instruments in real and simulated data and to provide adaptable software for the implementation and visualization of the instrumental inequalities. We begin by describing how to interpret the results of the instrumental inequalities when applied to a specific MR model and dataset.
INTERPRETATION OF THE INSTRUMENTAL INEQUALITIES
Because such falsification tests are relatively uncommon, let us begin by considering for illustrative purposes a scenario in which we believe that the two causal diagrams in Figure 1 are the only possible relationships between a particular SNP, exposure, and outcome. If the instrumental inequalities failed to hold, Figure 1A could not be true, meaning that Figure 1B must be true and the SNP has a direct effect on the outcome. However, if the instrumental inequalities hold, the data are consistent with the SNP having a direct effect or having no direct effect on the outcome, as we have failed to falsify Figure 1A.
FIGURE 1.
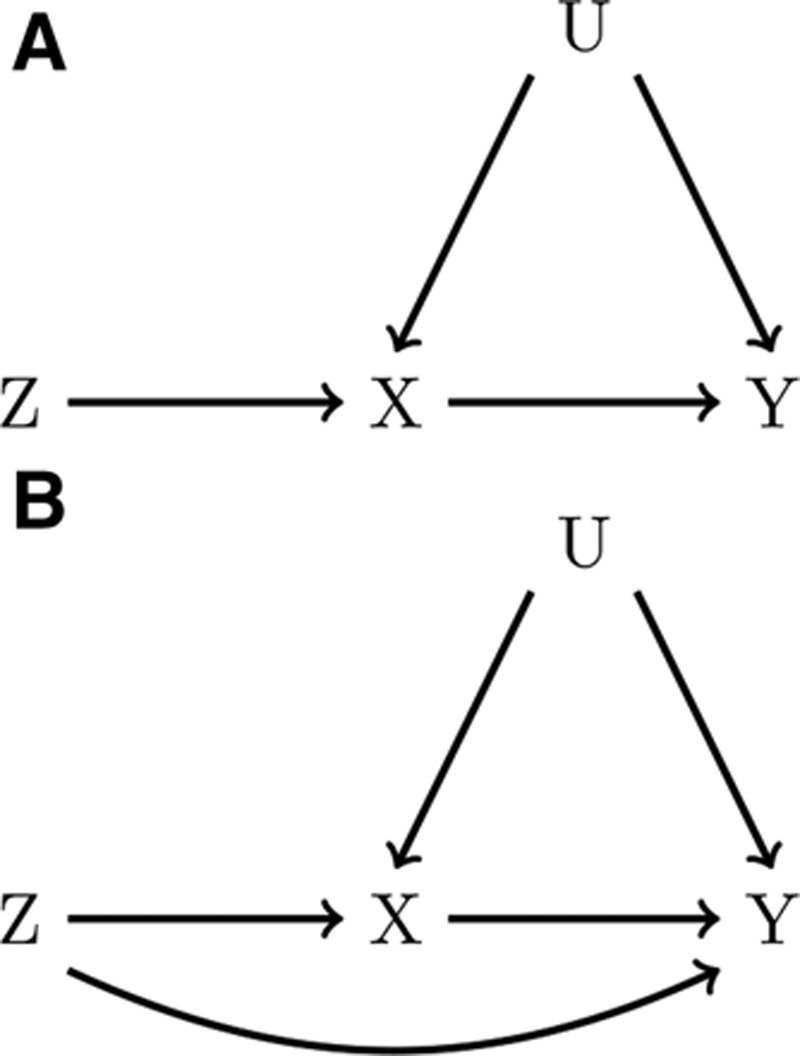
Causal diagrams representing a Mendelian randomization (MR) study with one genetic variant, Z, proposed as an instrument for the effect of X on Y. In A, Z is a valid instrument. In B, the MR assumptions are violated by a direct effect of Z on Y.
The same logic applies where multiple SNPs are believed to be instruments. Figure 2 presents a causal diagram in which four independent SNPs are valid instruments both individually and as a single joint variable. When multiple SNPs are available, MR analyses using different subsets of SNPs, and thus slightly different assumptions, can be proposed. As such, the instrumental inequalities can be applied to each SNP individually, to any combination of two, three, or four of the SNPs, or to a summary score derived from these SNPs (e.g., an allele score) to evaluate the validity of each subset as a (jointly) proposed instrument. For example, one could propose all four SNPs jointly as instruments by combining the SNPs into a 3^4 = 81 level variable, where each level represents a different possible combination of alleles for the four SNPs. Violations of the instrumental inequalities when proposing this combination variable as an instrument provide evidence against the causal diagram in Figure 2. Likewise, violations of the instrumental inequalities when considering any SNP individually or any subset of SNPs would also provide evidence against this particular causal diagram.
FIGURE 2.
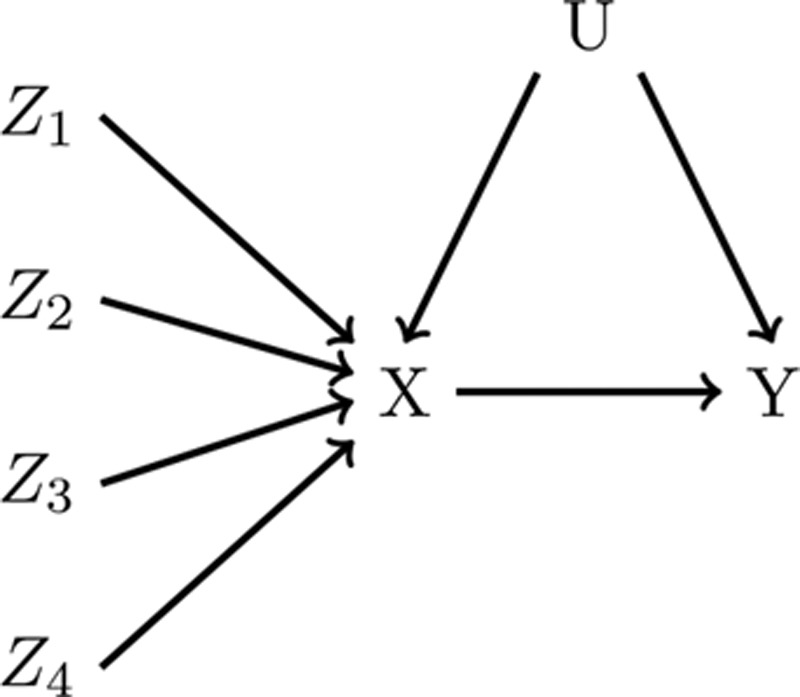
A causal diagram representing a Mendelian randomization study with four independent genetic variants, Z1, Z2, Z3, and Z4, proposed as instruments for the effect of X on Y. Here, all four genetic variants are valid instruments individually and jointly.
It is possible to apply the instrumental inequalities directly to an allele score. Violations of the instrumental inequalities when proposing this allele score as an instrument could also provide evidence against the causal diagram in Figure 2. However, allele scores imply additional linearity and additivity assumptions, which are not required for the use of MR or the instrumental inequalities, and may result in loss of power,6 although this approach may be useful to investigators considering using the allele score in their particular MR analysis.
Importantly, the instrumental inequalities do not actually require us to specify an alternative causal diagram like we did in Figure 1. The instrumental inequalities simply show us whether a proposed MR model is false. In fact, without additional assumptions, the instrumental inequalities do not give evidence as to “how” the MR assumptions are violated, only that the MR model cannot be true in the dataset.
In practice, the usefulness of the instrumental inequalities for evaluating many proposed instruments may be hindered by sample size. As the number of SNPs jointly proposed as instruments increases, the number of individuals within a given stratum of the proposed joint instrument becomes increasingly small, and it becomes more likely that the instrumental inequalities will fail to hold by random chance. The concept of random violations of MR assumptions is similar to that of “random confounding”1,19: in randomized trials, although randomization implies we expect balance of covariates across trial arms on average, it does not guarantee balance within a particular study. If there are imbalances in the distribution of a risk factor for the outcome in a study, adjustment for the imbalanced risk factor is recommended to produce unbiased causal effect estimates. Analogously, even if the MR assumptions for a proposed joint instrument are met in a theoretical super-population, the distribution of the proposed instrument, exposure, and outcome within a particular sample might deviate substantially from the expected distribution in the super-population, especially in small samples, which are more prone to notable deviations from what is expected. As a result, the MR assumptions, and thus, the instrumental inequalities could fail to hold by chance. Such violations may occur more often in small samples. As in a randomized trial with “random confounding,” an MR analysis in a sample where the assumptions were violated by chance is expected to produce biased estimates of causal effects. Thus, any evidence of a violation of the MR assumptions should be considered as important evidence about the validity of an MR analysis for that specific dataset. It remains important to understand the impact of sample size on the ability to detect structural violations of the MR assumptions, as it would otherwise remain unclear whether a violation found in one dataset provides evidence against a similar MR model in another dataset.
The application of the instrumental inequalities to multiple proposed instruments allows for many layers of falsification strategies: we can attempt to falsify the model for any proposed instrument individually, any combination of proposed instruments jointly, and any summary score. A potential advantage of applying the instrumental inequalities to each of these is that they might be used to identify subsets of SNPs for which the MR assumptions definitely do not hold, and subsets of SNPs where an MR analysis could be pursued with caution.
In the next section, we explore this possibility in a study of the effects of maternal prenatal vitamin D levels on childhood behavioral health outcomes and introduce a new visualization for the instrumental inequalities. We follow this application with a simulation study in order to better understand the impact of sample size on the instrumental inequalities. All analyses were conducted in R 3.4.1 (www.r-project.org, R Core Development Team). We provide adaptable R functions, available in the eAppendix; http://links.lww.com/EDE/B605, that allow the user to calculate the instrumental inequalities for multiple proposed instruments and display the results in a novel graph format.
DATA EXAMPLE: ESTIMATING THE EFFECTS OF MATERNAL PREGNANCY VITAMIN D ON CHILDHOOD BEHAVIORAL HEALTH OUTCOMES IN GENERATION R
Study Population
Generation R is a population-based cohort from fetal life to young adulthood, based in Rotterdam, the Netherlands. Mothers with a delivery date between April 2002 and January 2006 who lived in the study area were eligible for participation. Further information about the study is available elsewhere.20 In total, 8,880 mothers were enrolled during pregnancy. To avoid overt violation of the MR assumptions by population stratification or relatedness, we restrict our analysis to the 3,188 mother-child pairs for which mothers were of self-reported Dutch ancestry and the child was the first offspring of the mother included in the cohort. For each MR model investigated, analysis was restricted to individuals with complete data available on exposure, outcome, and all proposed instruments, resulting in analytic samples of 1,970 (pervasive developmental problems [PDP]), 1,971 (mother-reported attention deficit hyperactivity disorder [ADHD] symptoms), and 1,146 (teacher-reported ADHD symptoms) for each outcome studied, respectively (see eTable 1; http://links.lww.com/EDE/B605 for descriptive statistics). This complete case analysis approach aligns with common practices in MR analyses, but it can violate the MR assumptions (and in fact may be the reason for violations of the instrumental inequalities in these samples).21,22 Future studies might mitigate this issue by conducting the instrumental inequalities and MR models in samples weighted by the inverse probability of selection.21 The study was approved by the Medical Ethics Committee of Erasmus Medical Center and was in accordance with the World Medical Association Declaration of Helsinki.
Proposed Instruments
Maternal genotyping was performed using Taqman allelic discrimination assay (Applied Biosystems, Foster City, CA), with an error rate of less than 1% confirmed in a random subsample (n = 276).23 Based on existing literature, we proposed four independent maternal SNPs (rs2282679, rs12785878, rs6013897, rs10741657) as instruments. These SNPs have been associated genome-wide with serum vitamin D in a sample of 42,274 individuals,24 and are often used in MR studies of vitamin D.25–27 For all models, we coded SNPs trichotomously, based on the presence of 0, 1, or 2 risk alleles.
Exposure
Pregnancy serum vitamin D status was defined using the storage form of vitamin D, total 25OHD, measured in venous blood taken between 18.1 and 24.9 weeks gestation.28 We defined exposure dichotomously and trichotomously, based on established clinical cutoffs at which treatment for vitamin D is recommended.29–32 Total serum 25OHD was dichotomized at 75 nmol/L based on sufficiency; and trichotomized as deficiency (0–50 nmol/L), insufficiency (50–74.99 nmol/L), and sufficiency (≥ 75 nmol/L). Although these categorizations imply strong assumptions about a step-function relationship between vitamin D and offspring behavioral health, it is important to recognize that modeling vitamin D continuously in MR typically makes a likewise strong and potentially inaccurate assumption of a linear relationship.
Outcomes
Maternal-reported pervasive developmental problems (PDP) and ADHD symptoms at age 5 years were assessed from the Persistent Developmental Problems and the Attention Deficit-Hyperactivity subscales, respectively, of the Dutch translation of the Child Behavior Checklist.33,34 The former subscale has been used as a screening tool to identify children with autism spectrum disorder,35 while the latter has shown good convergent validity with clinician ratings.36,37 We used the 98th percentile of each subscale’s T-scores (PDP: T ≥ 8.98; ADHD: T ≥ 9) as cutoffs to classify children with mother-reported PDP and ADHD symptoms in the clinical range. Teacher-reported ADHD symptoms at age 7 were defined as a T-score above the 98th percentile on the Teacher Report Form Attention Problems subscale (T ≥ 15).38–40
Analysis
We assessed whether the instrumental inequalities would identify violations of MR models for the causal effect of maternal serum vitamin D during pregnancy on offspring PDP and ADHD symptoms, using the above-mentioned four SNPs proposed as instruments. For each possible combination of SNPs, we applied the instrumental inequalities to MR models for the causal effect of maternal vitamin D on an outcome. We then extracted the maximum value of the instrumental inequalities, along with the number of strata of the proposed instrument with exactly 0 or fewer than 10 individuals. For binary exposure models, we also applied the Bonet15 inequality for trichotomous instruments to each SNP marginally. Although in any plausible scenario where an allele score satisfies the MR assumptions, each contributing SNP would also individually and jointly satisfy those assumptions,5 we also applied the instrumental inequalities to MR models with a categorical, unweighted allele score proposed as an instrument.
Although the instrumental inequalities cannot be applied to continuous measures of exposures, evaluating models based on categorized measures could still be informative. However, the MR assumptions can be violated if the exposure is inappropriately categorized,41 implying the instrumental inequalities might be detecting this mismeasurement rather than another MR assumption violation. If that were the case, we may expect to see decreasing instances in which the instrumental inequalities were violated as the number of categories of the exposure increases, although evaluating this property might require prohibitively large samples. To see if coding of the exposure variable altered the conclusions, we evaluated the instrumental inequalities using dichotomous and trichotomous exposure definitions, as described above.
Results
For all definitions of exposures and outcomes, the instrumental inequalities, including the stronger inequalities developed by Bonet15, held for each SNP individually, indicating that there was no evidence in the data alone against each specific proposed instrument being valid. However, as the number of SNPs jointly proposed as instruments increased, the instrumental inequalities increasingly failed to hold (Figure 3).
FIGURE 3.
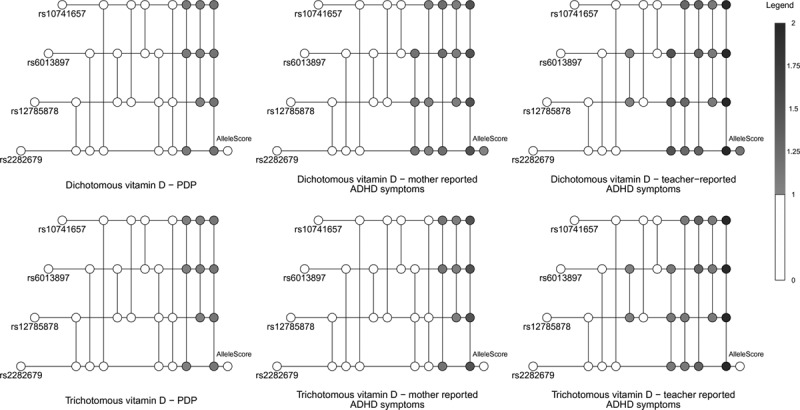
In these visualizations, each horizontal line represents a single nucleotide polymorphism (SNP), and each vertical line connects a set of SNPs proposed as instruments (with the number of included SNPs increasing from left to right). The color of each node represents the maximum value of the instrumental inequalities, with white indicating a value less than one and darker colors indicating larger values that represent violations (see Legend). See eAppendix; http://links.lww.com/EDE/B605 for further details of visualization technique.
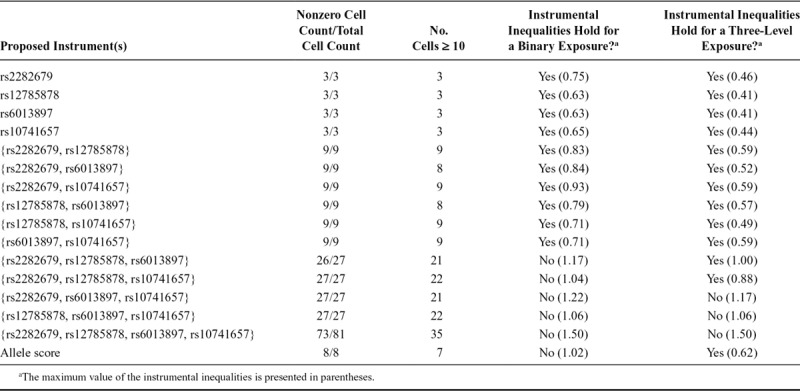
When the instrumental inequalities were applied to MR models for the causal effect of maternal vitamin D coded dichotomously on mother-reported PDP symptoms, the instrumental inequalities failed to hold for half of the combinations of three SNPs jointly proposed as instruments and the combination of all four SNPs (Tables 1–3). When applied to MR models for the causal effect of maternal vitamin D on mother-reported ADHD symptoms, the instrumental inequalities failed to hold for all three SNP and four SNP combinations, as well as the allele score. For teacher-reported ADHD symptoms, the instrumental inequalities failed to hold for the allele score, all three SNP and four SNP combinations, and one two-SNP combination.
TABLE 1.
Summary of Instrumental Inequalities for Studying the Effect of Maternal Vitamin D on Mother-reported Pervasive Developmental Problems Symptoms With Varying Combinations of Proposed Instruments and Definitions of Exposure
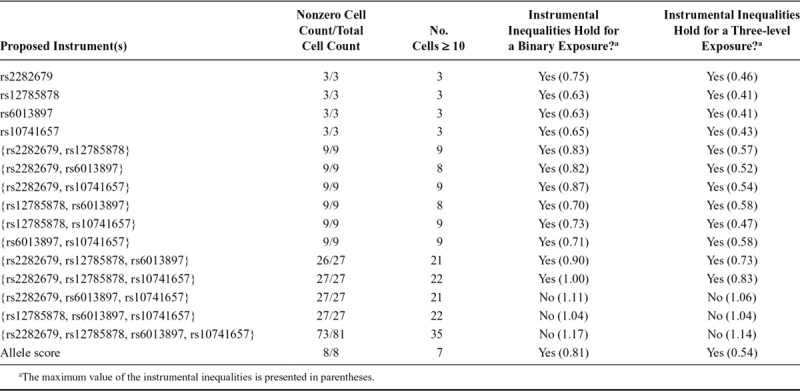
TABLE 3.
Summary of Instrumental Inequalities for Studying the Effect of Maternal Vitamin D on Teacher-reported Attention Deficit Hyperactivity Disorder Symptoms With Varying Combinations of Proposed Instruments and Definitions of Exposure
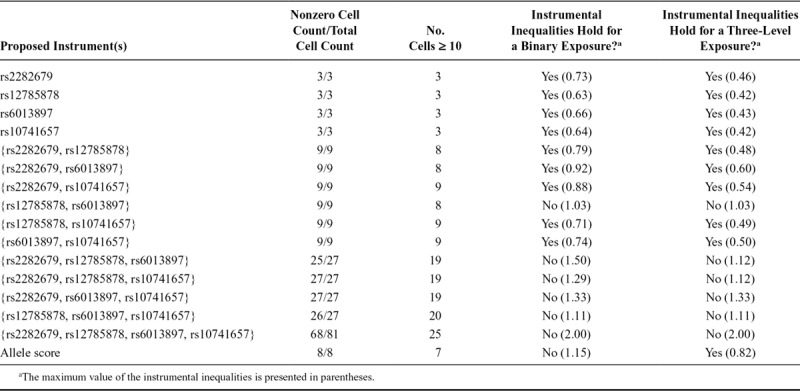
TABLE 2.
Summary of Instrumental Inequalities for Studying the Effect of Maternal Vitamin D on Mother-reported Attention Deficit Hyperactivity Disorder Symptoms With Varying Combinations of Proposed Instruments and Definitions of Exposure
When we coded maternal vitamin D trichotomously, the maximum value of the instrumental inequalities for each possible combination of SNPs proposed as instruments was less than or equal to the maximum value of the inequalities in models with a dichotomized measure of maternal vitamin D. For some models, the instrumental inequalities held in the trichotomous exposure case but not the dichotomous exposure case, including two settings in which the allele score was the proposed instrument.
SIMULATION STUDY
Methods
We simulated four independent binary genetic variants Z1–Z4 with causal effects on the exposure X. Although Z2, Z3, and Z4 were true causal instruments, Z1 also had a direct causal effect on the outcome Y, thereby violating the MR assumptions. We then applied the instrumental inequalities in scenarios with varying sample sizes (n = 1,000; 10,000; 100,000), proposed instrument strengths, and strengths of the direct effect of Z1 on Y. R code for the simulations and details of simulated parameters are available in the eAppendix; http://links.lww.com/EDE/B605.
Results
The instrumental inequalities were increasingly violated for combinations of proposed instruments including Z1 as the strength of violation and number of proposed instruments included in a combination increased (Figure 4). When the strength of violation was relatively weak, the instrumental inequalities were more often violated for combinations including Z1 in the smaller (n = 1,000) samples.
FIGURE 4.
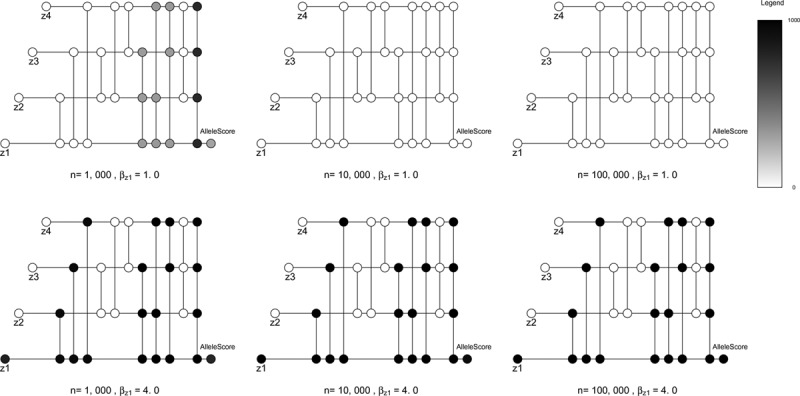
Results of six simulations with four dichotomous proposed instruments Z1, Z2, Z3, and Z4, a dichotomous exposure X, dichotomous outcome Y, and continuous exposure-outcome confounder U. For each setting, we simulated 1,000 samples such that Z1i~bernoulli (0.5), Z2i~bernoulli (0.5), Z3i~bernoulli (0.5), Z4i~bernoulli (0.5), Ui~norm (0, 1), Xi~bernoulli (expit [0.6 + 0.1 × Ui + 0.1 × Z1i + 0.1 × Z2i + 0.1 × Z3i + 0.1 × Z4i]). We varied sample sizes (n = 1,000, 10,000, 100,000) across simulations. In addition, in each of the six depicted simulations, Z1 violated the Mendelian randomization (MR) conditions, with Yi~bernoulli (expit [0.02 + 0.1 × Ui + βz1 × Z1i]). Thus, each simulation represents a setting where one of the four proposed instruments violates the MR assumptions, with differing degrees of violation of the MR assumptions and differing sample sizes. In these visualizations, each horizontal line represents a genetic variant, and each vertical line connects a set of genetic variants proposed as instruments (with the number of included genetic variants increasing from left to right). Unlike in Figure 3, in which connected nodes indicate a particular application of the instrumental inequalities, here nodes indicate the number of simulated samples in which the MR inequalities were violated. The color of each node represents the number of samples where the instrumental inequalities were violated, out of 1,000 total samples for each setting. Note that this is in contrast to Figure 3, where the color of each node represented the maximum value of the instrumental inequalities for each set of genetic variants jointly proposed as instruments within a particular dataset. See eAppendix; http://links.lww.com/EDE/B605 for further details of visualization technique.
In samples of 100,000 individuals, the instrumental inequalities were never violated for combinations not including Z1, regardless of instrument strength or strength of violation (eAppendix; http://links.lww.com/EDE/B605). In simulated samples of 10,000 and 1,000 individuals, the instrumental inequalities were occasionally violated for some combinations not including Z1 (i.e., for combinations when no structural bias was present), although this occurred in less than 1% of simulations for each true instrument marginally (eAppendix; http://links.lww.com/EDE/B605). This was especially likely when considering the three valid instruments jointly in the smallest sample size and the strongest proposed instrument strength simulated, in which 90% of the time the inequalities were violated. In all cases in which the inequalities were violated for a combination that did not include Z1, the instrumental inequalities were also always violated for combinations including Z1. When we proposed Z1–Z4 jointly as instruments in these settings, the instrumental inequalities were violated in more than 95% of simulations.
DISCUSSION
Our results indicate that, for studies of the causal effect of maternal pregnancy vitamin D on offspring PDP and ADHD within Generation R, there are clear violations of the MR assumptions when proposing four SNPs (rs2282679, rs12785878, rs6013897, rs10741657) jointly as instruments, as well as for several combinations of three of the four SNPs. We did not detect violations of the MR assumptions when each SNP was proposed as an instrument marginally, or for most combinations of two of the four SNPs. The results of our simulations suggest that the instrumental inequalities will be increasingly violated as the magnitude of the violation of the MR assumptions grows, are more sensitive to violations of the MR assumptions when multiple instruments are proposed jointly, and that small sample sizes appear to increase the probability of finding a true structural violation with limited risk of incorrectly detecting a structural violation when none existed.
Because a violation of the instrumental inequalities for any of the sets of SNPs proposed as instruments would indicate that the four SNPs are not jointly valid instruments, our results clearly demonstrate that certain MR analyses would be biased if conducted in our dataset. Moreover, for teacher-reported and mother-reported ADHD using a dichotomous exposure, the MR assumptions fail to hold when every possible overlapping combination of three of the four SNPs are proposed jointly as instruments, which for independent SNPs logically implies that the MR assumptions cannot hold for at least two of the included SNPs individually. Altogether, our results then suggest that MR analyses requiring all four SNPs are jointly instruments (e.g., analyses proposing an allele score) are inappropriate in our dataset, and also that MR analyses that only require a subset of SNPs are instruments (e.g., the median-based approach8) should be pursued with extreme caution. Our dataset found no particular pattern suggestive of a specific problematic SNP and thus is not helpful in pruning clearly invalid instruments. On the other hand, our simulations suggest that a pattern consistent with one “bad apple” is possible to detect and may aid in pruning clearly invalid instruments: investigators might consider removing the offending SNP from their proposed instrument set and continuing with an MR analysis. It is also possible for investigators to consider MR estimators that allow for all proposed instruments to be invalid in specific ways, although these methods require alternative assumptions beyond those considered here7,10 and the results of the instrumental inequalities would only be informative if coupled with a strong biologic rationale for these alternative assumptions. Finally, it is worth reiterating two important points on interpretation. First, the instrumental inequalities falsify but do not verify the MR model. Thus, if an application of the inequalities detects no violation, it is still possible for the MR analysis to be biased. Investigators should still weigh subject matter knowledge, perform other falsification strategies and sensitivity analyses, and choose an appropriate method if they decide to pursue an MR analysis, as outlined in prior guidelines.17 The relevance of this point is underscored by our simulations, in which a bias was always structurally present but remained undetected in several simulated samples. Second, the instrumental inequalities are a falsification strategy for the core MR assumptions but do not assess the additional point-identifying assumptions.18
Finding the instrumental inequalities are not satisfied, however, does not tell us “why” they are not satisfied. In our data example, there are several structural reasons why the MR assumptions could be violated, some of which are depicted in Figure 5 and described in the eAppendix; http://links.lww.com/EDE/B605.7,8,11,41–43 It is also possible that the falsification of the MR model indicated by our findings are specific to our dataset, which motivated our simulations. As previously discussed, as sample size decreases and the number of proposed instruments increases, the MR assumptions, and thus the instrumental inequalities, can be more readily violated by chance. In the simple scenario constructed in our simulations, the instrumental inequalities appear to be violated for combinations excluding the invalid proposed instrument only when the bias for the invalid instrument is very strong and the sample is relatively small, in which cases the instrumental inequalities also indicate that the set of four jointly proposed instruments violate the MR conditions. The frequency of this type of sample-specific violation appears to decline with sample size, and there was no evidence of finding violations for combinations with no structural bias in simulated samples of 100,000 participants. Overall, the results of our simple simulations suggest that, even in settings with small samples and strong instruments, where it is possible detected violations are sample-specific, the instrumental inequalities still provide strong evidence regarding the validity of MR analyses within a particular dataset. However, in such settings, it may be difficult, if not impossible, to determine the source of said violations if it is truly limited to a subset of the proposed instruments. It is unclear how this property of the inequalities will be affected when larger numbers of SNPs are proposed as instruments. Although the instrumental inequalities may be impacted by sample size, outside of the all-binary case, statistical inference procedures have not been fully developed.44,45
FIGURE 5.
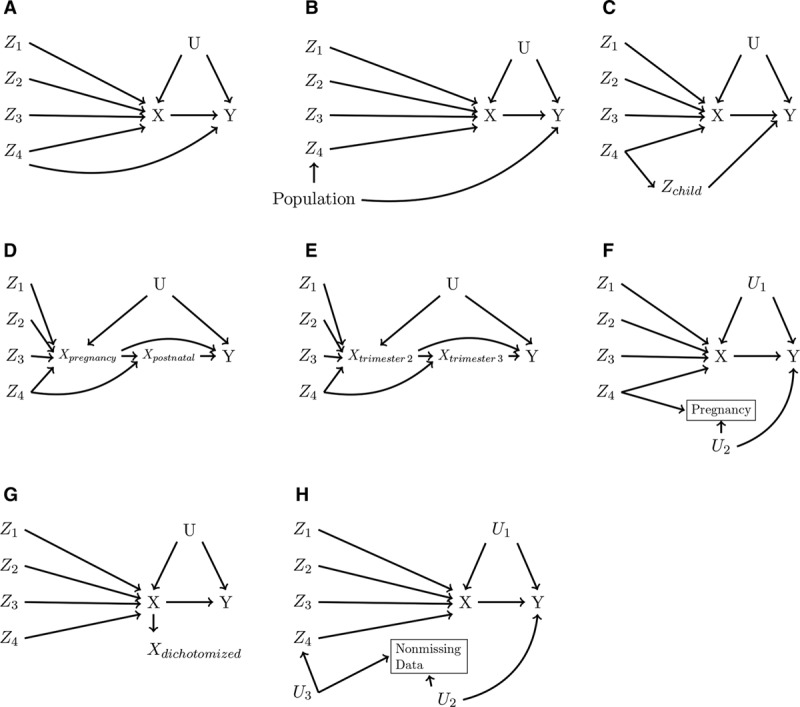
Causal diagrams depicting some reasons for possible violations of the Mendelian randomization (MR) assumptions. For simplicity, in each causal diagram, Z4 alone (and therefore any combination involving Z4) violates the MR assumptions: (A) pleiotropy, (B) violation by population stratification, (C) violation by offspring genotype, (D) violation by postnatal effects of exposure, (E) violation by changing exposure-instrument association over pregnancy, (F) violation by selection on fertility, (G) violation by exposure dichotomization, (H) violation by missing data. See eAppendix; http://links.lww.com/EDE/B605 for further discussion of each of these possible violations in the context of our data analysis.
In our data example, the fact that violations by SNPs jointly proposed as instruments were detected by some of the instrumental inequalities applied to allele scores, which have a smaller number of strata, as well as the relative weakness of the proposed instruments, suggests that not all the violations in our dataset are attributable to sample size. If the violations detected are not sample-specific, but rather indicative of structural biases related to the SNPs proposed as instruments, this might suggest these four SNPs should not be used as instruments for the effect of maternal vitamin D on offspring behavioral outcomes.
More broadly, our data example provides a concrete case in which the instrumental inequalities falsified a model proposing multiple variables jointly as instruments, underscoring previous calls for the use of the instrumental inequalities in all IV analyses.16–18 Like all observational research, MR requires strong, unverifiable assumptions. However, in the context of one-sample MR with multiple proposed instruments, the instrumental inequalities may allow us to eliminate clearly invalid analyses and focus efforts on more potentially informative studies.
ACKNOWLEDGMENTS
We thank Vanessa Didelez for helpful discussions.
Supplementary Material
Footnotes
This project is supported by an innovation program under the Marie Sklodowska-Curie grant agreement number 721567. S.A.S. is further supported by a NWO/ZonMW Veni Grant (91617066).
The authors report no conflicts of interest.
Description: Code is available in the eAppendix. Generation R cohort data is available to researchers who request access through Vincent Jaddoe (v.jaddoe@erasmusmc.nl) and the Generation R Study Management Team.
Supplemental digital content is available through direct URL citations in the HTML and PDF versions of this article (www.epidem.com).
REFERENCES
- 1.Hernán MA, Robins JM. Causal Inference: What If. 2020Boca Raton, FL. Chapman & Hall/CRC. [Google Scholar]
- 2.Robins JM. Sechrest L, Freeman H, Mulley A. The analysis of randomized and non-randomized AIDS treatment trials using a new approach to causal inference in longitudinal studies. In: Health Service Research Methodology: A Focus on AIDS. 1989:Washington, DC: U.S. Public Health Service, National Center for Health Services Research; 113–159. [Google Scholar]
- 3.Manski CF. Nonparametric bounds on treatment effects. Am Eco Rev. 1990;80:319–323. [Google Scholar]
- 4.Balke A, Pearl J. Bounds on treatment effects from studies with imperfect compliance. J Am Stat Assoc. 1997;92:1171–1176. [Google Scholar]
- 5.Burgess S, Thompson SG. Use of allele scores as instrumental variables for Mendelian randomization. Int J Epidemiol. 2013;42:1134–1144. [DOI] [PMC free article] [PubMed] [Google Scholar]
- 6.Pierce BL, Ahsan H, Vanderweele TJ. Power and instrument strength requirements for Mendelian randomization studies using multiple genetic variants. Int J Epidemiol. 2011;40:740–752. [DOI] [PMC free article] [PubMed] [Google Scholar]
- 7.Bowden J, Davey Smith G, Burgess S. Mendelian randomization with invalid instruments: effect estimation and bias detection through Egger regression. Int J Epidemiol. 2015;44:512–525. [DOI] [PMC free article] [PubMed] [Google Scholar]
- 8.Bowden J, Davey Smith G, Haycock PC, Burgess S. Consistent estimation in Mendelian randomization with some invalid instruments using a weighted median estimator. Genet Epidemiol. 2016;40:304–314. [DOI] [PMC free article] [PubMed] [Google Scholar]
- 9.Kang H, Zhang A, Cai TT, Small DS. Instrumental variables estimation with some invalid instruments and its application to Mendelian randomization. J Am Stat Assoc. 2016;111:132–144. [Google Scholar]
- 10.Tchetgen EJT, Sun B, Walter S. The GENIUS approach to robust Mendelian randomization inference. 2017arXiv preprint arXiv:1709.07779.
- 11.Verbanck M, Chen CY, Neale B, Do R. Detection of widespread horizontal pleiotropy in causal relationships inferred from Mendelian randomization between complex traits and diseases. Nat Genet. 2018;50:693. [DOI] [PMC free article] [PubMed] [Google Scholar]
- 12.Zhu Z, Zheng Z, Zhang F, et al. Causal associations between risk factors and common diseases inferred from GWAS summary data. Nat Commun. 2018;9:224. [DOI] [PMC free article] [PubMed] [Google Scholar]
- 13.Hartwig FP, Davey Smith G, Bowden J. Robust inference in summary data Mendelian randomization via the zero modal pleiotropy assumption. Int J Epidemiol. 2017;46:1985–1998. [DOI] [PMC free article] [PubMed] [Google Scholar]
- 14.Pearl J. On the testability of causal models with latent and instrumental variables. In: Proceedings of the Eleventh Conference on Uncertainty in Artificial Intelligence August 18–20, 1995San Francisco, CA: Morgan Kaufmann Publishers Inc. [Google Scholar]
- 15.Bonet B. Instrumentality tests revisited. In: Proceedings of the Seventeenth Conference on Uncertainty in Artificial Intelligence August 2–5, 2001San Francisco, CA: Morgan Kaufmann Publishers Inc. [Google Scholar]
- 16.Labrecque J, Swanson SA. Understanding the assumptions underlying instrumental variable analyses: a brief review of falsification strategies and related tools. Curr Epidemiol Rep. 2018;5:1–7. [DOI] [PMC free article] [PubMed] [Google Scholar]
- 17.Swanson SA, Hernán MA. Commentary: how to report instrumental variable analyses (suggestions welcome). Epidemiology. 2013;24:370–374. [DOI] [PubMed] [Google Scholar]
- 18.Glymour MM, Tchetgen Tchetgen EJ, Robins JM. Credible Mendelian randomization studies: approaches for evaluating the instrumental variable assumptions. Am J Epidemiol. 2012;175:332–339. [DOI] [PMC free article] [PubMed] [Google Scholar]
- 19.Greenland S, Mansournia MA. Limitations of individual causal models, causal graphs, and ignorability assumptions, as illustrated by random confounding and design unfaithfulness. Eur J Epidemiol. 2015;30:1101–1110. [DOI] [PubMed] [Google Scholar]
- 20.Jaddoe VW, van Duijn CM, van der Heijden AJ, et al. The generation R study: design and cohort update 2010. Eur J Epidemiol. 2010;25:823–841. [DOI] [PMC free article] [PubMed] [Google Scholar]
- 21.Canan C, Lesko C, Lau B. Instrumental variable analyses and selection bias. Epidemiology. 2017;28:396–398. [DOI] [PMC free article] [PubMed] [Google Scholar]
- 22.Swanson SA. A practical guide to selection bias in instrumental variable analyses. Epidemiology. 2019;30:345–349. [DOI] [PubMed] [Google Scholar]
- 23.Kruithof CJ, Kooijman MN, van Duijn CM, et al. The generation R study: biobank update 2015. Eur J Epidemiol. 2014;29:911–927. [DOI] [PubMed] [Google Scholar]
- 24.Wang TJ, Zhang F, Richards JB, et al. Common genetic determinants of vitamin D insufficiency: a genome-wide association study. Lancet. 2010;376:180–188. [DOI] [PMC free article] [PubMed] [Google Scholar]
- 25.Mokry LE, Ross S, Ahmad OS, et al. Vitamin D and risk of multiple sclerosis: a Mendelian randomization study. PLoS Med. 2015;12:e1001866. [DOI] [PMC free article] [PubMed] [Google Scholar]
- 26.Ong JS, Cuellar-Partida G, Lu Y, et al. Association of vitamin D levels and risk of ovarian cancer: a Mendelian randomization study. Int J Epidemiol. 2016;45:1619–1630. [DOI] [PMC free article] [PubMed] [Google Scholar]
- 27.Vimaleswaran KS, Berry DJ, Lu C, et al. Causal relationship between obesity and vitamin D status: bi-directional Mendelian randomization analysis of multiple cohorts. PLoS Med. 2013;10:e1001383. [DOI] [PMC free article] [PubMed] [Google Scholar]
- 28.Vinkhuyzen AAE, Eyles DW, Burne THJ, et al. Gestational vitamin D deficiency and autism-related traits: the generation R study. Mol Psychiatry. 2018; 23:240–246. [DOI] [PMC free article] [PubMed] [Google Scholar]
- 29.Holick MF. Vitamin D status: measurement, interpretation, and clinical application. Ann Epidemiol. 2009;19:73–78. [DOI] [PMC free article] [PubMed] [Google Scholar]
- 30.Holick MF, Binkley NC, Bischoff-Ferrari HA, et al. ; Endocrine Society. Evaluation, treatment, and prevention of vitamin D deficiency: an endocrine society clinical practice guideline. J Clin Endocrinol Metab. 2011;96:1911–1930. [DOI] [PubMed] [Google Scholar]
- 31.Ross AC, Taylor CL, Yaktine AL, et al. ; Institute of Medicine (US) Committee to Review Dietary Reference Intakes for Vitamin D and Calcium. Dietary Reference Intakes for Calcium and Vitamin D. 2011Washington, DC: The National Academies Press. [PubMed] [Google Scholar]
- 32.Vieth R. Why the minimum desirable serum 25-hydroxyvitamin D level should be 75 nmol/L (30 ng/ml). Best Pract Res Clin Endocrinol Metab. 2011;25:681–691. [DOI] [PubMed] [Google Scholar]
- 33.Achenbach TM, Rescorla LA. Manual for the ASEBA Preschool Forms and Profiles. 2000Burlington, VT: University of Vermont, Research Center for Children, Youth, & Families. [Google Scholar]
- 34.Tick NT, Koot HM, Verhulst FC. 14-year changes in emotional and behavioral problems of very young Dutch children. J Am Acad Child Adolesc Psychiatry. 2007;46:1333–1340. [DOI] [PubMed] [Google Scholar]
- 35.Sikora DM, Hall TA, Hartley SL, et al. Does parent report of behavior differ across ADOS-G classifications: analysis of scores from the CBCL and GARS. J Autism Dev Disord. 2008;38:440–448. [DOI] [PubMed] [Google Scholar]
- 36.Soma Y, Nakamura K, Oyama M, Tsuchiya Y, Yamamoto M. Prevalence of attention-deficit/hyperactivity disorder (ADHD) symptoms in preschool children: discrepancy between parent and teacher evaluations. Environ Health Prev Med. 2009;14:150–154. [DOI] [PMC free article] [PubMed] [Google Scholar]
- 37.Hudziak JJ, Copeland W, Stanger C, Wadsworth M. Screening for DSM-IV externalizing disorders with the Child Behavior Checklist: a receiver-operating characteristic analysis. J Child Psychol Psychiatry. 2004;45:1299–1307. [DOI] [PubMed] [Google Scholar]
- 38.Achenbach TM. Integrative Guide for the 1991 CBCL/4-18, YSR, and TRF Profiles. 1991Burlington, VT: Department of Psychiatry, University of Vermont. [Google Scholar]
- 39.de Groot A, Koot HM, Verhulst FC. Cross-cultural generalizability of the Youth Self-Report and Teacher’s Report Form cross-informant syndromes. J Abnorm Child Psychol. 1996;24:651–664. [DOI] [PubMed] [Google Scholar]
- 40.Verhulst FC, Akkerhuis GW, Althaus M. Mental health in Dutch children: (I). A cross-cultural comparison. Acta Psychiatr Scand Suppl. 1985;323:1–108. [DOI] [PubMed] [Google Scholar]
- 41.VanderWeele TJ, Tchetgen Tchetgen EJ, Cornelis M, Kraft P. Methodological challenges in Mendelian randomization. Epidemiology. 2014;25:427–435. [DOI] [PMC free article] [PubMed] [Google Scholar]
- 42.Lawlor D, Richmond R, Warrington N, et al. Using Mendelian randomization to determine causal effects of maternal pregnancy (intrauterine) exposures on offspring outcomes: sources of bias and methods for assessing them. Wellcome Open Res. 2017;2:11. [DOI] [PMC free article] [PubMed] [Google Scholar]
- 43.Swanson SA, Labrecque J, Hernán MA. Causal null hypotheses of sustained treatment strategies: what can be tested with an instrumental variable? Eur Epidemiol. 2018;33:723–728. [DOI] [PMC free article] [PubMed] [Google Scholar]
- 44.Ramsahai RR, Lauritzen SL. Likelihood analysis of the binary instrumental variable model. Biometrika. 2011;98:987–994. [Google Scholar]
- 45.Wang L, Robins JM, Richardson TS. On falsification of the binary instrumental variable model. Biometrika. 2017;104:229–236. [DOI] [PMC free article] [PubMed] [Google Scholar]