Optical coherence tomography angiography quantitative data in pediatric eyes with unilateral Coats disease found significant differences in vascular density and foveal avascular zone area between disease and fellow eyes that precede clinical signs.
Key words: Coats disease, OCTA, OCTA, PAR, pediatric, unilateral
Abstract
Purpose:
To determine vascular change at the macula in both eyes in unilateral pediatric Coats disease using optical coherence tomography angiography.
Methods:
Retrospective case-series. Thirteen eyes of pediatric patients with a diagnosis of unilateral Coats disease of various stages were compared with 13 fellow eyes. Optical coherence tomography angiography images were acquired using the RTVue XR Avanti. Scans were analyzed with novel projection artifact removal software and improved segmentation. Vascular density and foveal avascular zone area were calculated.
Results:
Vascular density was significantly decreased in eyes with Coats disease in comparison with fellow eyes in both the superficial capillary plexus and deep capillary plexus (43.7 ± 4.7 vs. 45.9 ± 4.4 [P = 0.000] and 43.0 ± 6.3 vs. 50.3 ± 2.2 [P = 0.001], respectively). The difference was also significant for most sectors of the macula. Foveal avascular zone area was significantly larger in eyes with Coats disease in comparison with fellow eyes (0.29 ± 0.1 vs. 0.24 ± 0.09 [P = 0.003]). These significant differences appeared as early as Stage 2A, preceding clinical findings.
Conclusion:
The findings support the unilaterality of Coats disease and show that vascular changes on optical coherence tomography angiography precede clinical staging of the condition.
Coats disease is a rare, predominantly unilateral retinal vascular developmental disorder characterized by retinal telangiectasia, areas of peripheral avascular retina, vascular leakage, and exudation resulting in visual impairment.1 It predominantly affects males, with an average age of onset of five years. The severity of the condition is classified based on funduscopic examination or color fundus photographs.2 Stage 1 is characterized by the presence of retinal telangiectasias only. In Stage 2, exudation accompanies telangiectasia, either extrafoveally (Stage 2A) or foveally (Stage 2B). In Stage 3, there is exudative retinal detachment, which can be subtotal (Stage 3A) or total (Stage 3B). In Stage 4, the condition advances to a total retinal detachment and glaucoma, whereas Stage 5 represents advanced end-stage disease. Recently, Daruich et al3 have suggested a change to the classification, further dividing Stage 2B into 2B1 and 2B2, with the latter including a subfoveal nodule and the former lacking this feature. Fluorescein angiography is the confirmatory diagnostic test used to confirm the diagnosis. Angiographic features include the presence of unilateral telangiectatic and light bulb aneurysmal vessels and peripheral retinal capillary nonperfusion, whereas macular findings include dilated capillaries, capillary closure, microaneurysms, and leakage.4–6
Adult cases of Coats disease are similar in terms of unilateral clinical presentation and disease course, but generally have a more limited area of retinal involvement and slower disease progression.7 Indeed, it has been shown that an inverse relationship exists between age at presentation and the severity of disease.8
The exact mechanism of the disease is unknown. It is thought to be a nonhereditary disease and probably caused by a somatic mutation of the Norrie disease protein gene.9 However, with the advent of wide-field imaging, there have been reports that Coats disease may be a bilateral disease because of the presence of peripheral vascular changes in the fellow eyes.10,11 Such peripheral changes may also be seen in healthy eyes, further confounding the matter.12 Bilaterality also questions whether there is a hereditary element to the condition. Therefore, it is important to study the macula in Coats disease in more detail to better understand the laterality of the condition.
Optical coherence tomography angiography (OCTA) is a novel and noninvasive technique for demonstrating the microvascular blood flow within the macula. It produces depth-resolved evaluation of the reflectance data from retinal tissue, providing a three-dimensional volume of information.13 Its noninvasiveness and speed of use are advantageous in the pediatric population. In addition, development of handheld devices show promise for their use in neonates and in the setting of examination under anesthesia.14,15 A limited number of previous studies described qualitative OCTA findings in Coats disease, predominantly in the adult population, with no mention of disease stage.16–19
Recently, different quantification algorithms have been used to extract angiographic data, including vascular density and the area of the foveal avascular zone (FAZ), from OCTA scans.20,21 The aim of this study was to quantify vascular density at the macula and FAZ area in a pediatric population with different stages of unilateral Coats disease and compare these parameters with those of the fellow eyes to determine whether there is any evidence to the laterality of the disease based on macular findings.
Methods
Institutional review board committee approval was obtained for the study. Pediatric patients with a diagnosis of Coats disease who underwent OCTA of both eyes at the pediatric clinic of Moorfields Eye Hospital between May 2016 and October 2017 were retrospectively evaluated. Data collected included findings of ophthalmologic examination, best-corrected visual acuity (in logarithm of the minimal angle of resolution) as measured by specialist orthoptists, and OCTA data.
Inclusion and Exclusion Criteria
Pediatric patients with the diagnosis of unilateral Coats disease based on clinical examination and confirmed on examination under anesthesia and fluorescein angiography (under anesthesia) were retrospectively enrolled. Patients were excluded if they had a systemic disease or another retinal pathology.
Optical Coherence Tomography Angiography Image Acquisition
Optical coherence tomography angiography images were acquired using the RTVue XR Avanti spectral domain OCT device with AngioVue software (Optovue, Fremont, CA). This system uses an SSADA software algorithm (version 2016.2.0.35) with a high speed of 70,000 axial scans per second, wavelength of 840 nm, and an axial resolution of 5 μm to acquire OCTA volumes consisting of 304 × 304 A-scans. The scanning area was captured in 3 × 3 mm sections centered on the fovea, capturing both eyes of each subject. Acquisition of scans was performed in clinic, after disease stabilization.
Optical Coherence Tomography Angiography Image Analysis
Image analysis was performed using a noncommercially available version of the AngioAnalytics software (version 2017.1.0.144), which was very similar to the future commercial version. This software uses a proprietary three-dimensional projection artifact removal algorithm (3D PAR), allowing for the removal of projection artifacts from deeper layers. The algorithm removes projection artifacts from the OCTA volume on a per voxel basis, using information from the OCT and OCTA volume to differentiate in situ OCTA signal from projection artifacts.
The software segments the macular vasculature into a superficial capillary plexus (SCP), extending from the internal limiting membrane to the inner plexiform layer − 10 μm. Similarly, the deep capillary plexus (DCP) is segmented from the inner plexiform layer − 10 μm to the outer plexiform layer + 10 μm. The software allows for manual editing of segmentation lines and propagation of the change over the selected region of interest in areas where automated segmentation is incorrect. The segmentation was carefully examined for each case and corrected as needed to delineate the appropriate layers, including in cases of anatomical complications (i.e., edema or scarring) (Figure 1).
Fig. 1.
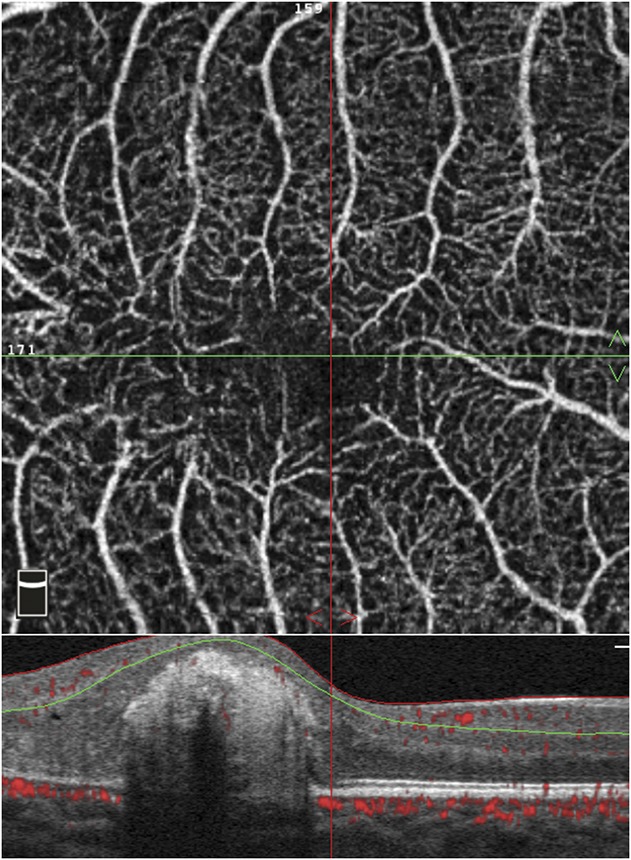
Manual segmentation of an OCTA scan of the right eye of an 8-year-old patient with Stage 2B Coats disease. The patient had a central subfoveal scar, necessitating manual segmentation of the layers on the OCTA B-scan (bottom of image). The red and green lines delineate the superficial capillary plexus, as manually adjusted to bypass the scar. The top image is the resultant en face optical coherence tomography angiography scan.
The software assigns a scan quality measure to each image, ranging from 1 to 10. Images with a scan quality <6 (due to motion or blink artifacts, lack of focus, etc.) or with otherwise poor image quality (i.e., due to vessel doubling, cropping, or low signal due to floaters) were excluded from the study.
Using the automated software, vascular density was measured using a partial Early Treatment Diabetic Retinopathy Study grid overlay that is superimposed on the automatically detected center of the fovea to generate vascular density in different areas of interest. The grid centration was adjusted manually when needed. It is composed of two circles: an inner circle with a diameter of 1 mm, covering the foveal region; and an outer circle with a diameter of 3 mm, corresponding to the parafovea. The outer circle is divided into sectors (nasal, temporal, superior, and inferior). For each predefined region, vascular density is calculated as percentage of the area occupied by vessels out of all region area (Figure 2).
Fig. 2.
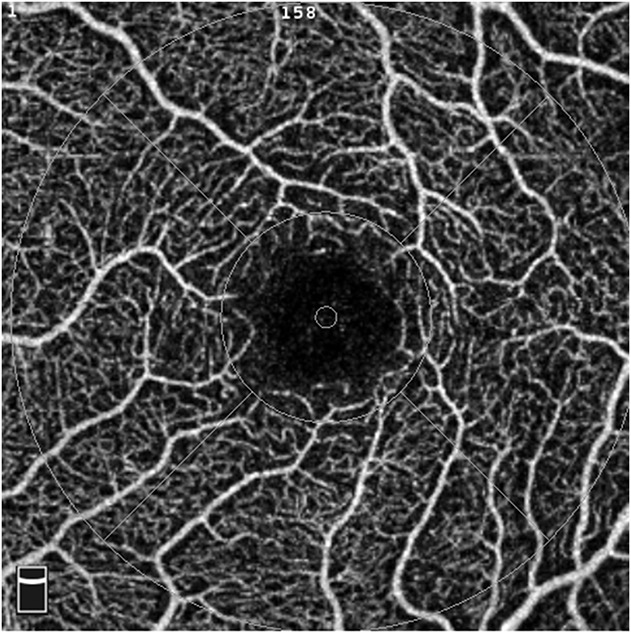
Macular vascular density measurement in the left eye of a 17-year-old patient with Stage 2A Coats disease. A 3 × 3 mm optical coherence tomography angiography scan of the macula at the level of the superficial capillary plexus. The vascular density is measured in the whole image and in each sector of the grid.
The FAZ area parameter is calculated automatically by the software, and the detection boundary is based on inner plexiform layer to outer plexiform layer + 10 μm slab. In cases of incorrect automatic delineation, manual delineation adjustment was made.
Statistical Analysis
Continuous variables were tested for normality distribution (Shapiro–Wilk test). The paired t-test or Wilcoxon nonparametric test was used to compare the logarithm of the minimal angle of resolution visual acuity, vascular density, and FAZ area between eyes with Coats disease and fellow eyes. The Pearson or Spearman correlation coefficients were used to study the correlation between logarithm of the minimal angle of resolution visual acuity, vascular density, and FAZ area. A P value of <0.05 was considered statistically significant.
Statistical analyses were performed with SPSS-25 IBM, Armonk (NY, USA).
Results
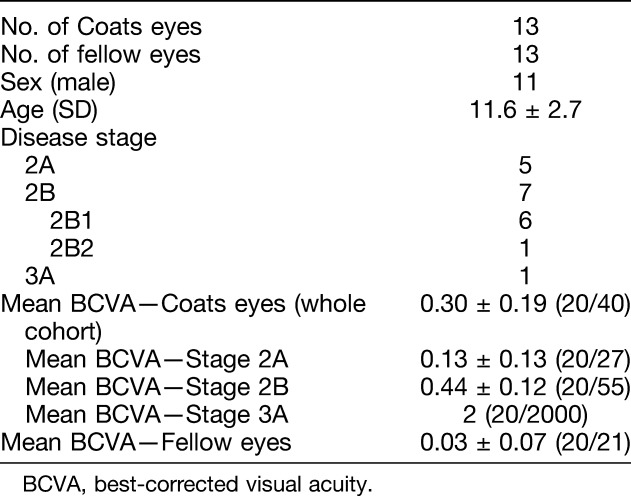
Patient characteristics are listed in Table 1. A total of 26 eyes of 13 patients (11 male and 2 female) were included in the study. The mean age was 11.6 ± 2.7 (range 8–17) years. The mean age at time of diagnosis was 8.9 ± 4.0 years. Five patients had Stage 2A disease, 7 had Stage 2B, and 1 had Stage 3A. Two of the patients with Stage 2B disease had macular pathology that required manual segmentation of retinal layers due to cystoid macular edema and a macular scar (Figure 1). Notably, the patient with a macular scar had a nodule before development of the scar and was therefore Stage 2B2. The rest were Stage 2B1.
Table 1.
Patient Characteristics of the Study Population (N = 14)
Vascular density and FAZ values are presented in Table 2. Vascular density was significantly decreased in eyes with Coats disease in comparison with fellow eyes in the whole SCP and DCP images (43.7 ± 4.7 vs. 45.9 ± 4.4 [P = 0.000] and 43.0 ± 6.3 vs. 50.3 ± 2.2 [P = 0.001], respectively). The difference was also significant for all sectors of the SCP and DCP except for the fovea in the SCP layer. The FAZ area was significantly larger in eyes with Coats disease in comparison with fellow eyes (0.29 ± 0.1 vs. 0.24 ± 0.09 [P = 0.003]).
Table 2.
Comparison of Vascular Density and Foveal Avascular Zone Area in all 13 Coats Eyes Versus 13 Unaffected Fellow Eyes
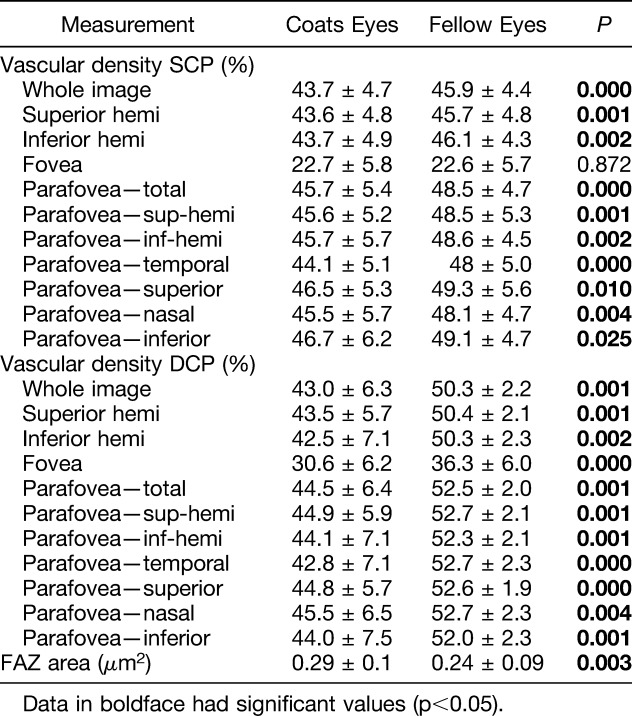
Two patients with Stage 2B disease had macular edema or scarring, necessitating manipulation of the automatic segmentation performed by the OCTA algorithm. To rule out possible skewing of data due to these significant changes, data analysis was also performed for the other 11 patients only. For this group of patients, the statistical significance remained the same except for the inferior parafoveal region of the SCP layer, for which the difference between eyes with Coats disease and fellow eyes became borderline significant (P = 0.056).
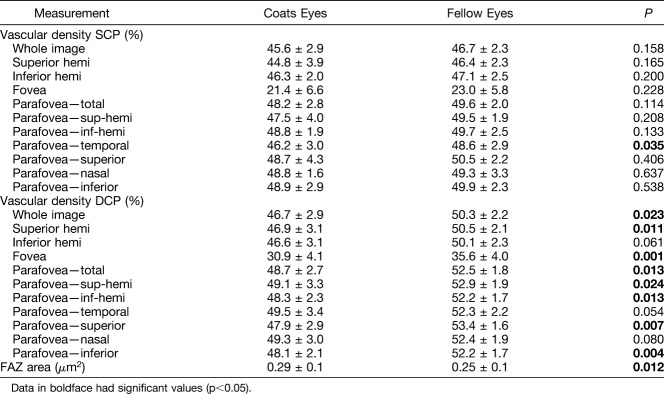
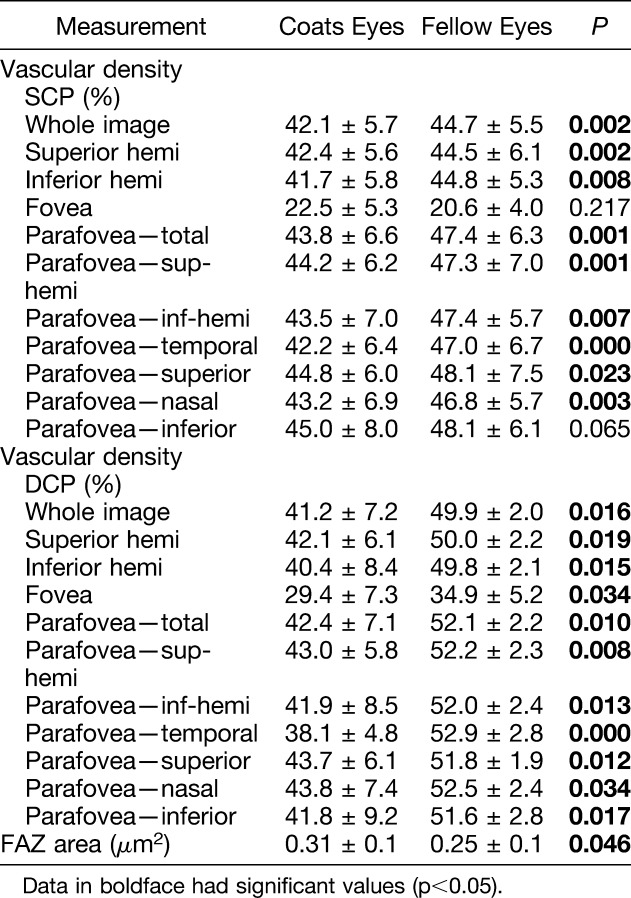
Table 3 shows vascular density and FAZ data for the five patients with Stage 2A disease and Table 4 presents these data for the seven patients with Stage 2B disease. In the group of patients with Stage 2A disease, there were no significant differences in vascular density at the level of the SCP except for the temporal parafoveal area. However, most sections in the DCP layer (except for the inferior hemifovea, nasal, and temporal parafoveal areas) showed a significant decrease in vascular density in Coats eyes in comparison with fellow eyes. The FAZ area was also larger in the eyes with Coats disease (0.29 ± 0.1 vs. 0.25 ± 0.1, P = 0.012). In comparison, in the group of patients with Stage 2B disease, vascular density was decreased in both the SCP and DCP layers in almost all segments (except for the fovea and inferior parafovea in the SCP layer). The FAZ area was larger in eyes with Coats disease (0.31 ± 0.1 vs. 0.25 ± 0.1, P = 0.046).
Table 3.
Comparison of Vascular Density and Foveal Avascular Zone Area in 5 Coats Eyes With Stage 2A Disease Versus 5 Unaffected Fellow Eyes
Table 4.
Comparison of Vascular Density and Foveal Avascular Zone Area in 7 Coats Eyes With Stage 2B Disease Versus 7 Unaffected Fellow Eyes
Discussion
This study provides quantitative data of the vessel density and FAZ in a pediatric population with Coats disease. We found that in all patients, vascular density was decreased in the eyes affected by Coats disease compared with the fellow eyes. The FAZ area was also significantly larger in eyes with Coats disease in comparison with fellow eyes. In a subgroup analysis, we found that in patients with Stage, 2A there was a decrease in vascular density in the DCP layer in comparison with the fellow eyes, whereas in patients with Stage 2B, the decrease in vascular density involved both the SCP and DCP layers. The significant differences found in both vascular density and FAZ area between eyes with Coats disease and fellow eyes lends further evidence that Coats disease is a unilateral disease. However, larger studies are required to support these data.
Different studies quote different prevalence of unilaterality in Coats disease ranging from 80% to 95%.4,22,23 This study also reiterates that in patients with presumed bilateral Coats disease, one should investigate secondary bilateral Coats disease–like retinopathy with systemic conditions such as facioscapulohumeral dystrophy.24
Decreased vascular density has been reported in several retinal vascular diseases, including diabetic retinopathy (DR) (mostly in the DCP),25,26 retinal vein occlusion,27 and sickle cell retinopathy.28 It is not surprising then that according to our data, Coats disease exhibits the same changes to vascular density. In our group of patients, the decrease in vascular density was seen in both the superficial plexus and the deep plexus in patients with Stage 2B disease. According to the accepted clinical classification, Stage 2B disease involves the macula.2 However, we also found a significant decrease in the vascular density in patients with Stage 2A disease, which, according to the classification, should not involve the center. This is a new finding for this disease. Nevertheless, considering data from different vascular diseases, it is not a surprise. Optical coherence tomography angiography has proven to be a sensitive device for the detection of early subclinical changes in the macula. Vascular density changes are seen in diabetics even before the development of overt DR.26 Our data suggest that such subclinical changes also occur in Coats disease before the apparent involvement of the macula as seen by other imaging modalities and with biomicroscopy.
Interestingly, the DCP seems to be the first layer involved in the condition. This is consistent with previous studies that have shown more frequent and more pronounced changes to vascular perfusion in the DCP in both DR25 and retinal vein occlusion (RVO).29 Recent literature suggests that these findings are a result of this layer being the most likely to be confounded by projection artifacts and segmentation error.30 However, given the use of the 3D PAR algorithm in our study, designed to remove projection artifacts from deeper layers, it is possible that such findings may be true. Because the SCP is directly connected to the retinal arterioles, it may have greater perfusion pressure than the DCP.29 In addition, the DCP is located in a watershed-like area where oxygen saturation may be lower than in the inner and outer retina,31 suggesting higher vulnerability to ischemic or any other insults.
The FAZ area has been shown to be increased in different retinal vascular diseases. Optical coherence tomography angiography of 63 eyes of 64 patients with diabetes mellitus showed significant enlargement of FAZ from 0.25 mm2 in controls to 0.37 mm2 in diabetic eyes without DR, and to 0.38 mm2 in eyes with DR.32 A study of 23 subjects with RVO (15 central RVO and 8 branch RVO) and 8 eyes of 8 age-matched controls assessed FAZ size in both groups. Mean FAZ was larger in RVO eyes than in both fellow eyes and control eyes.29 In the above-mentioned study comparing patients with sickle cell disease to normal subjects, the FAZ area was significantly larger in affected eyes than in the control group.28
As with vascular density, our data suggest that Coats disease also leads to FAZ enlargement similarly to other retinal vascular diseases, a finding that is seen as early as Stage 2A of the disease. The enlargement may represent macular vessel compromise and serves as an additional marker for central changes in this disease. Longitudinal studies exploring the change of FAZ and vessel density over time may provide a clue of the threshold of these parameters below which visible clinical findings occur.
Optical coherence tomography angiography has been limited by various image artifacts. Projection artifacts, in particular, pose a challenge, causing superficial vessels to be incorrectly detected as deeper vessels.33 This may lead to erroneous quantification at the level of the DCP. The current study used AngioAnalytics research software (Optovue), using the 3D PAR algorithm. This algorithm has been shown to effectively reduce projection artifacts. Studies have demonstrated a decreased two-dimensional correlation coefficient between plexuses (indicating that the plexuses are more dissimilar) and suppression of projection artifacts with reduced vascular density measurements in the deeper layers, which are mostly affected by projection artifacts.34
In addition, the AngioAnalytics version used in this study includes a segmentation editing and propagation tool, allowing for correction of automatic segmentation errors. This was used in two patients in our study, one with a macular scar and the other with macular edema. The data from these patients were similar to that seen with the other patients not needing segmentation correction. This technique may improve the ability to analyze and follow-up on patients with significant macular changes, including Coats disease.
Our study was limited by a small sample size, resulting from the rarity of the condition and the elimination of patients with poor image quality. However, this group was sufficient to produce highly significant results, suggesting that the changes seen are indeed real and substantial.
In conclusion, this is the first study to provide quantitative data of the macular vascular density and FAZ area in a cohort of pediatric patients with Coats disease to lend evidence to the unilaterality of Coats disease and strengthen the evidence that a somatic mutation is a likely explanation for the disease. The findings in the eyes affected by Coats disease suggest that this vascular condition behaves similarly to other retinal vascular diseases, with FAZ enlargement and reduction in vascular density. However, the study also provides evidence of overt macular changes at Stage 2A, which is currently classified clinically as a stage of nonmacular involvement. Given its noninvasiveness, OCTA may prove to be a valuable tool in the evaluation and follow-up of pediatric patients with Coats disease, including the potential impact of treatment on macular vascular density.
Footnotes
Presented at the 5th International Congress on OCT Angiography, “en face” OCT, and advances in OCT, Rome, Italy, December 15, 2017.
Publication of this work was supported by Moorfields Eye Charity. None of the authors has any financial/conflicting interests to disclose.
References
- 1.Kelly J. Coats Disease. Online Mendelian Inheritance in Man; 1986. Available at: http://omim.org/entry/300216. Accessed 2013. [Google Scholar]
- 2.Shields JA, Shields CL. Review: coats disease: the 2001 LuEsther T. Mertz lecture. Retina 2002;22:80–91. [DOI] [PubMed] [Google Scholar]
- 3.Daruich AL, Moulin AP, Tran HV, et al. Subfoveal nodule in Coats' disease. Retina 2017;37:1591–1598. [DOI] [PMC free article] [PubMed] [Google Scholar]
- 4.Shields JA, Shields CL, Honavar SG, Demirci H. Clinical variations and complications of Coats disease in 150 cases: the 2000 Sanford Gifford Memorial Lecture. Am J Ophthalmol 2001;131:561–571. [DOI] [PubMed] [Google Scholar]
- 5.Grosso A, Pellegrini M, Cereda MG, et al. Pearls and pitfalls in diagnosis and management of coats disease. Retina 2015;35:614–623. [DOI] [PubMed] [Google Scholar]
- 6.Tarkkanen A, Laatikainen L. Coat's disease: clinical, angiographic, histopathological findings and clinical management. Br J Ophthalmol 1983;67:766–776. [DOI] [PMC free article] [PubMed] [Google Scholar]
- 7.Smithen LM, Brown GC, Brucker AJ, et al. Coats' disease diagnosed in adulthood. Ophthalmology 2005;112:1072–1078. [DOI] [PubMed] [Google Scholar]
- 8.Daruich A, Matet A, Munier FL. Younger age at presentation in children with Coats disease is associated with more advanced stage and worse visual prognosis. Retina 2017:1. 10.1097/IAE.0000000000001866. [DOI] [PubMed] [Google Scholar]
- 9.Black GC, Perveen R, Bonshek R, et al. Coats' disease of the retina (unilateral retinal telangiectasis) caused by somatic mutation in the NDP gene: a role for norrin in retinal angiogenesis. Hum Mol Genet 1999;8:2031–2035. [DOI] [PubMed] [Google Scholar]
- 10.Blair MP, Ulrich JN, Elizabeth Hartnett M, Shapiro MJ. Peripheral retinal nonperfusion in fellow eyes in coats disease. Retina 2013;33:1694–1699. [DOI] [PubMed] [Google Scholar]
- 11.Rabiolo A, Marchese A, Sacconi R, et al. Refining Coats' disease by ultra-widefield imaging and optical coherence tomography angiography. Graefes Arch Clin Exp Ophthalmol 2017;255:1881–1890. [DOI] [PubMed] [Google Scholar]
- 12.Lu J, Mai G, Luo Y, et al. Appearance of far peripheral retina in normal eyes by ultra-widefield fluorescein angiography. Am J Ophthalmol 2017;173:84–90. [DOI] [PubMed] [Google Scholar]
- 13.Spaide RF, Fujimoto JG, Waheed NK. Optical coherence tomography angiography. Retina 2015;35:2161–2162. [DOI] [PMC free article] [PubMed] [Google Scholar]
- 14.Campbell JP, Nudleman E, Yang J, et al. Handheld optical coherence tomography angiography and ultra–wide-field optical coherence tomography in retinopathy of prematurity. JAMA Ophthalmol 2017;135:977. [DOI] [PMC free article] [PubMed] [Google Scholar]
- 15.Yang J, Liu L, Campbell JP, et al. Handheld optical coherence tomography angiography. Biomed Opt Express 2017;8:2287. [DOI] [PMC free article] [PubMed] [Google Scholar]
- 16.Muakkassa NW, de Carlo TE, Choudhry N, et al. Optical coherence tomography angiography findings in Coats' disease. Ophthalmic Surg Lasers Imaging Retina 2016;47:632–635. [DOI] [PubMed] [Google Scholar]
- 17.Yonekawa Y, Todorich B, Trese MT. Optical coherence tomography angiography findings in Coats' disease. Ophthalmology 2016;123:1964. [DOI] [PubMed] [Google Scholar]
- 18.Stanga PE, Papayannis A, Tsamis E, et al. Swept-source optical coherence tomography angiography of paediatric macular diseases. Dev Ophthalmol 2016;56:166–173. [DOI] [PubMed] [Google Scholar]
- 19.Hautz W, Gołębiewska J, Kocyła-Karczmarewicz B. Optical coherence tomography and optical coherence tomography angiography in monitoring Coats' disease. J Ophthalmol 2017;2017:7849243. [DOI] [PMC free article] [PubMed] [Google Scholar]
- 20.Samara WA, Shahlaee A, Sridhar J, et al. Quantitative optical coherence tomography angiography features and visual function in eyes with branch retinal vein occlusion. Am J Ophthalmol 2016;166:76–83. [DOI] [PubMed] [Google Scholar]
- 21.Dimitrova G, Chihara E, Takahashi H, et al. Quantitative retinal optical coherence tomography angiography in patients with diabetes without diabetic retinopathy. Invest Opthalmol Vis Sci 2017;58:190. [DOI] [PubMed] [Google Scholar]
- 22.Egerer I, Tasman W, Tomer TT. Coats disease. Arch Ophthalmol 1974;92:109–112. [DOI] [PubMed] [Google Scholar]
- 23.Shields JA, Shields CL. Differentiation of coats' disease and retinoblastoma. J Pediatr Ophthalmol Strabismus 2001;38:262–266; 303. [DOI] [PubMed] [Google Scholar]
- 24.London JSN, Shields CL, Haller JA. Coats disease. In: Ryan's Retina. New York, NY: Elsevier Inc; 2018:1188–1202. [Google Scholar]
- 25.Agemy SA, Scripsema NK, Shah CM, et al. Retinal vascular perfusion density mapping using optical coherence tomography angiography in normals and diabetic retinopathy patients. Retina 2015;35:2353–2363. [DOI] [PubMed] [Google Scholar]
- 26.Carnevali A, Sacconi R, Corbelli E, et al. Optical coherence tomography angiography analysis of retinal vascular plexuses and choriocapillaris in patients with type 1 diabetes without diabetic retinopathy. Acta Diabetol 2017;54:695–702. [DOI] [PubMed] [Google Scholar]
- 27.Koulisis N, Kim AY, Chu Z, et al. Quantitative microvascular analysis of retinal venous occlusions by spectral domain optical coherence tomography angiography. PLoS One 2017;12:e0176404. [DOI] [PMC free article] [PubMed] [Google Scholar]
- 28.Minvielle W, Caillaux V, Cohen SY, et al. Macular microangiopathy in sickle cell disease using optical coherence tomography angiography. Am J Ophthalmol 2016;164:137–144.e1. [DOI] [PubMed] [Google Scholar]
- 29.Adhi M, Filho MAB, Louzada RN, et al. Retinal capillary network and foveal avascular zone in eyes with vein occlusion and fellow eyes analyzed with optical coherence tomography angiography. Invest Ophthalmol Vis Sci 2016;57:OCT486–94. [DOI] [PubMed] [Google Scholar]
- 30.Kashani AH, Chen CL, Gahm JK, et al. Optical coherence tomography angiography: a comprehensive review of current methods and clinical applications. Prog Retin Eye Res 2017;60:66–100. [DOI] [PMC free article] [PubMed] [Google Scholar]
- 31.Chen X, Rahimy E, Sergott RC, et al. Spectrum of retinal vascular diseases associated with paracentral acute middle maculopathy. Am J Ophthalmol 2015;160:26–34.e1. [DOI] [PubMed] [Google Scholar]
- 32.Takase N, Nozaki M, Kato A, et al. Enlargement of foveal avascular zone in diabetic eyes evaluated by en face optical coherence tomography angiography. Retina 2015;35:2377–2383. [DOI] [PubMed] [Google Scholar]
- 33.Spaide RF, Fujimoto JG, Waheed NK. Image artifacts in optical coherence tomography angiography. Retina 2015;35:2163–2180. [DOI] [PMC free article] [PubMed] [Google Scholar]
- 34.Garrity ST, Iafe NA, Phasukkijwatana N, et al. Quantitative analysis of three distinct retinal capillary plexuses in healthy eyes using optical coherence tomography angiography. Invest Ophthalmol Vis Sci 2017;58:5548–5555. [DOI] [PubMed] [Google Scholar]


