Abstract
Recent reductions in readmission rates have been attributed to public reporting and pay-for-performance initiatives focused on readmissions. However, admission rates also declined during the same period. We demonstrate that, because the probability of an admission occurring soon after another is lower when there are fewer admissions per patient, the reduction in admission rates may have explained much of the reduction in readmission rates.
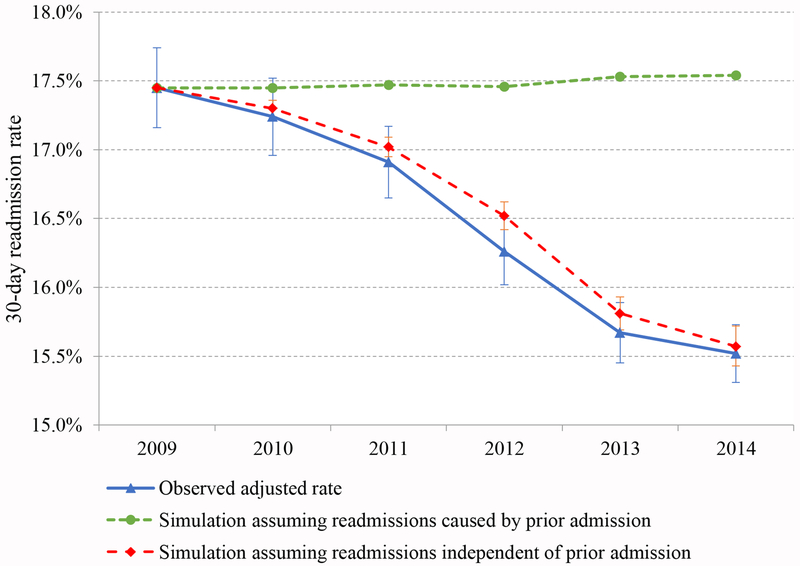
The announcement of the Hospital Readmissions Reduction Program (HRRP) in 2010 was followed by a progressive decline in 30-day readmissions rates through 2014,1,2 leading many to conclude that hospital responses to HRRP incentives caused the decline. Largely overlooked in the literature, however, is that the decline in readmission rates roughly coincided with a period of declining admission rates. In general, readmission rates should fall as admission rates fall because the probability of an admission occurring soon after another is lower when there are fewer admissions per patient. In this study, we examine the potential contribution of the decrease in admission rates to the decrease in readmission rates by conducting a simulation in which we remove random samples of admissions from Medicare claims data and recalculate readmission rates. As previewed in Exhibit 1, we find that the decline in admission rates may have been responsible for much of the decline in readmissions.
Exhibit 1. Observed readmission rates and readmission rates expected from falling admission rates under assumption that readmissions are vs. are not caused by care in prior admission, 2009-2014.
Source: Authors’ analysis of Medicare claims from 2009-2014
Notes: Simulated readmission rates and observed adjusted readmission rates are displayed by year. Error bars for observed readmission rates indicate 95% CIs that account for clustering within hospital referral regions. Simulated readmission rates were calculated for each year under each of the two assumptions about the causal link between index admissions and readmissions. Error bars for the simulated readmission rates indicate 95% CIs that reflect the uncertainty with which changes in index admission rates (the basis for the simulation) were estimated. Under the first assumption (readmissions caused entirely by care received in preceding admission), simulated readmission rates remained constant, regardless of the change in index admission rates, so there was no uncertainty to reflect. Our analysis of observed readmission rates from 2009-2014 included 6,399,320 admissions among 2,587,197 beneficiaries, and our simulation analysis was based on the 1,134,760 admissions occurring in 2009 among 733,255 beneficiaries.
Our study builds on recent findings that challenge the attribution of improved readmission rates to the HRRP. For example, two recent studies concluded that the reduction in readmissions was overstated because of increased coding of diagnoses used to risk-adjust readmission rates.3,4 The increase in coding resulted largely from the allowance of more secondary diagnoses in Medicare inpatient claims starting in January 2011 and accounted for approximately half of the previously reported decline in adjusted readmission rates. Moreover, one of the studies, by Ody et al., found that, after correcting for the change in diagnosis coding, reductions in readmissions following admissions targeted by the HRRP were similar to reductions for non-targeted admissions.4 Nevertheless, the residual reductions in readmission rates (after correcting for coding changes) that occurred across conditions and payers may be interpreted by some as spillover effects of the HRRP mediated by systemic changes in hospital coordination of post-discharge care.5 Whether the HRRP and related initiatives have been responsible for the widespread reduction in readmission rates remains a topic of debate.
In this study, we consider how recent reductions in per-capita hospital admissions could have contributed to the reduction in readmission rates. Multiple lines of evidence suggest the decrease in admissions was unrelated to the HRRP. In particular, admission rates fell substantially across all payers.6 All else equal, we would not expect hospitals to respond to the HRRP by broadly reducing admissions because the associated revenue losses would more than offset the avoided penalties. In addition, the admission decline occurred during a national slowdown in health care spending growth, started before the HRRP and other value-based payment initiatives, and accelerated with the implementation of the Recovery Audit Contractor Program to limit unnecessary short stays, suggesting contributions from multiple factors.6,7
STUDY DATA AND METHODS
Using fee-for-service Medicare claims data for a 20% sample of beneficiaries, we conducted a simulation in which we removed random samples of admissions to match national trends in admission rates and recalculated readmission rates from the data with fewer admissions. We conducted the simulation under two alternate assumptions about the causal link between admissions and readmissions: 1) readmissions are caused entirely by deficient quality of care during preceding admissions; and 2) readmissions are causally unrelated to preceding admissions. Because the precise extent to which readmissions reflect preceding deficits in quality is unknown, considering both scenarios helped to bound estimates of the effect of a hypothetical admission rate reduction on the readmission rate.
Using claims from 2009-2014, we first estimated changes in population rates of index admissions (admissions that are not readmissions) from 2009 to each subsequent year, adjusting for patient characteristics (see online Appendix for details).8 Using 2009 claims and following specifications for the hospital-wide readmission measure,9 we then simulated the 30-day all-cause readmission rate that would have been expected in each subsequent year through 2014 if a random sample of admissions had not occurred. For each simulated year, the proportion of admissions dropped from the 2009 claims was based on the adjusted change in the index admission rate from 2009 to that year. Because admissions were removed randomly, the case mix of admissions remained constant, allowing us to isolate the expected effect of lowering the admission rate on the readmission rate. In an alternate simulation (Appendix),8 we varied the proportion of admissions dropped by patients’ risk of admission to reflect the greater declines in admission rates among lower-risk patients over the study period.7,10
Under the assumption that readmissions are caused entirely by deficient quality of care during preceding admissions, admissions classified as readmissions would not occur absent a preceding admission and would be affected by factors responsible for the decline in admissions only if the preceding admission was affected. Accordingly, when simulating readmission rates under this assumption, we randomly removed only index admissions that were not readmissions, and then removed any readmissions following the dropped index admissions. Because this procedure removed expectedly equal proportions of index admissions and readmissions, simulated readmission rates through 2014 under this first assumption were expected to remain close to the observed 2009 rate (Appendix).8 Thus, this simulation illustrates that only under an extreme assumption would the readmission rate be unaffected by a reduction in the admission rate.
Under the assumption that readmissions are causally unrelated to preceding admissions, readmissions would be directly affected by factors driving the decline in admissions, and readmissions would still occur (as admissions) without a preceding index admission. Thus, when simulating under this assumption, we removed a random sample of all admissions (including readmissions) and then reclassified a readmission as an index admission if its preceding index admission was dropped. Because the proportion of readmissions dropped or reclassified by this procedure was expectedly greater than the proportion of admissions dropped, the simulated readmission rates under this second assumption were expectedly lower than the observed 2009 rate. To convey the intuition as to why, we present a stylized example for a hypothetical patient in Appendix Exhibit 1.8
As a reference point for interpreting simulated readmission trends, we also report observed readmissions rates from 2009-2014. To hold case mix constant over time (for consistency with the constant case mix in simulated trends), we adjusted observed rates for the same patient characteristics for which we adjusted admission rates (Appendix).8 We additionally adjusted observed readmission rates for the principal diagnosis of the index admission but not for secondary diagnoses because of the documented increase in coding.3,4
Finally, we estimated the correlation between observed and simulated changes in readmission rates from 2009-2014 at the hospital referral region (HRR) level (Appendix).8 This characterized how geographic variation in changes in readmission rates tracked with predictions based on HRR-specific changes in admission rates.
Limitations
Factors contributing to the decline in admission rates likely caused a more complicated pattern of reductions than the random drops considered in our simulation. However, we found substantively similar results when allowing the proportion of admissions dropped to vary (widely) according to patients’ admission risk. Moreover, our simulation was not intended to establish a counterfactual (i.e., the readmission rate expected from exogenous declines in admissions) by reproducing a complicated pattern of admission reductions. In other words, the objective of our analysis was not to isolate the share of the reduction in readmissions that can be attributed to falling admission rates vs. the HRRP. On the contrary, a major motivation for our analysis is that analyses of trends without a valid control group (to establish a counterfactual) are insufficient to support inferences about the causal impact of the HRRP. Our analysis intends only to demonstrate the relationship between trends in admissions and readmissions; if strong, one must consider the contribution of falling admission rates to falling readmission rates when attempting to draw conclusions about the success of the HRRP from trends in readmission rates.
RESULTS
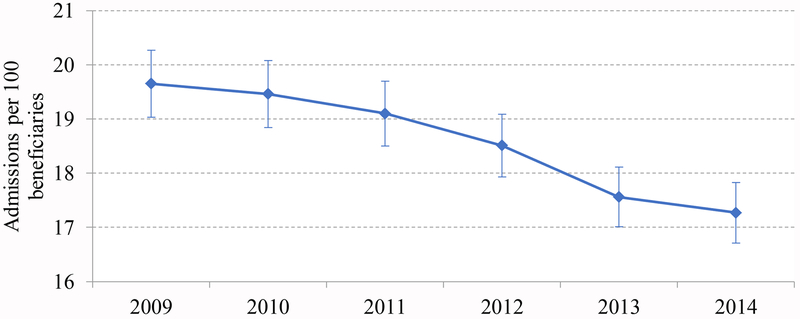
From 2009-2014, the adjusted rate of index admissions declined by 12.1% (Exhibit 2, Appendix Exhibit 2).8 Under the assumption that readmissions are caused entirely by deficient quality of care during preceding admissions, simulated readmission rates through 2014 remained close to the observed rate in 2009, as expected (Exhibit 1).
Exhibit 2. Adjusted rate of index admissions, 2009-2014.
Source: Authors’ analysis of Medicare claims from 2009-2014
Notes: Error bars for index admission rates and observed readmission rates indicate 95% CIs that account for clustering within hospital referral regions. Our analysis of admission rates from 2009-2014 included 28,458,493 beneficiary-year observations among 6,733,838 Medicare beneficiaries.
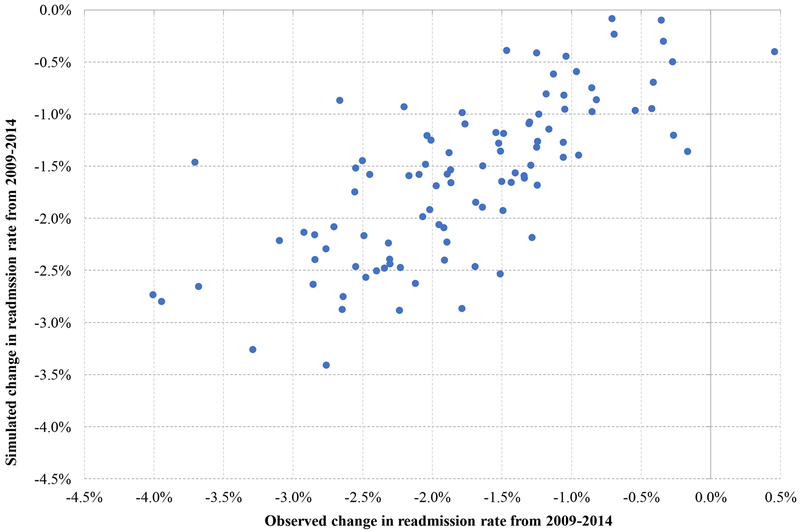
Under the assumption that readmissions are causally unrelated to preceding admissions, the simulated decreases in readmission rates were substantial and similar to the changes in adjusted observed rates, both in our main analysis (Exhibit 1) and an alternate simulation reflecting the changes in case mix of admitted patients over the study period (Appendix Exhibits 3–4).8 Across HRRs (Exhibit 3), simulated decreases in readmission rates were strongly correlated with observed decreases (r=0.73; P<0.001).
Exhibit 3. Correlation between simulated and observed changes in readmission rates from 2009-2014 at the HRR level.
Source: Authors’ analysis of Medicare claims from 2009-2014
Notes: Simulated HRR-specific changes in readmission rates from 2009-2014 are plotted against observed HRR-specific changes. Simulated changes were produced under the assumption that readmissions are causally unrelated to preceding index admissions. To reduce attenuation bias from sampling error in the estimation of the correlation between the simulated and observed changes, we focused this analysis on the 100 largest HRRs accounting for 67% of the Medicare population and used claims for all beneficiaries in those HRRs (as opposed to claims for the 20% sample of beneficiaries). The correlation was even higher (0.84; P<0.001) among the 50 largest HRRs.
DISCUSSION
Our analysis demonstrates how factors responsible for declining admission rates may have explained much of the recent reduction in readmission rates. We could not quantify the precise impact of falling admission rates on readmission rates, but it was likely substantial because most admissions occurring within 30 days of another are probably not caused by lapses in quality during the preceding admission. For example, prior studies have found that, on average, only 27% of readmissions are potentially avoidable, including only 36% of early readmissions.11,12 It is therefore extreme to assume that readmissions are always caused by prior admissions. Thus, a decrease in readmission rates should be expected from a decrease in admission rates.
Our findings are consistent with prior research documenting a strong correlation between changes in admission and readmission rates across HRRs and build on recent findings that decreases in readmissions targeted by the HRRP have been proportionally similar to decreases in non-targeted readmissions (after correcting for diagnosis coding changes).4,10 These findings would not be expected from quality-improvement efforts specifically targeting readmissions in response to HRRP incentives, but all are consistent with broad decreases in admission rates causing readmission rates to fall. Readmission-reduction efforts could have plausibly contributed to some decline in admission rates but are unlikely to explain a large, all-payer decline in admissions. Therefore, our findings question the extent to which recent readmission reductions can be attributed to readmission-specific incentives and initiatives.
Our study also calls attention to the limitations of utilization-based quality measures. The validity of these measures assumes that instances of utilization resulting from deficient quality can be distinguished from utilization from other causes. Our study questions this assumption for readmissions by demonstrating that declines in readmission rates may reflect trends in admission rates rather than changes in the quality of transitional care, consistent with prior cross-sectional findings that local admission rates predict hospital readmission rates much more strongly than performance on discharge planning measures.13 Thus, caution is warranted when interpreting variation or trends in performance on utilization-based quality measures.
Supplementary Material
Acknowledgments
Funding:
This study was supported by grants from the National Institute on Aging of the National Institutes of Health (NIH) (Grant Nos. P01 AG032952 and K23 AG058806), the Laura and John Arnold Foundation, and the Agency for Healthcare Research and Quality (AHRQ) (Grant No. K01 HS026727). The content is solely the responsibility of the authors and does not necessarily represent the official views of the NIH, the Laura and John Arnold Foundation, or AHRQ. J. Michael McWilliams reports serving as a consultant to Abt Associates, Inc.
Contributor Information
J. Michael McWilliams, Warren Alpert Foundation Professor of Health Care Policy, Department of Health Care Policy, Harvard Medical School, in Boston, Massachusetts.
Michael L. Barnett, Department of Health Policy and Management, Harvard T. H. Chan School of Public Health, in Boston.
Eric T. Roberts, Department of Health Policy and Management, Graduate School of Public Health, University of Pittsburgh, in Pennsylvania.
Pasha Hamed, Department of Health Care Policy, Harvard Medical School.
Ateev Mehrotra, Department of Health Care Policy, Harvard Medical School.
REFERENCES
- 1.Zuckerman RB, Sheingold SH, Orav EJ, Ruhter J, Epstein AM. Readmissions, Observation, and the Hospital Readmissions Reduction Program. N Engl J Med 2016;374:1543–51. [DOI] [PubMed] [Google Scholar]
- 2.Desai NR, Ross JS, Kwon JY, et al. Association Between Hospital Penalty Status Under the Hospital Readmission Reduction Program and Readmission Rates for Target and Nontarget Conditions. JAMA 2016;316:2647–56. [DOI] [PMC free article] [PubMed] [Google Scholar]
- 3.Ibrahim AM, Dimick JB, Sinha SS, Hollingsworth JM, Nuliyalu U, Ryan AM. Association of Coded Severity With Readmission Reduction After the Hospital Readmissions Reduction Program. JAMA Intern Med 2018;178:290–2. [DOI] [PMC free article] [PubMed] [Google Scholar]
- 4.Ody C, Msall L, Dafny LS, Grabowski DC, Cutler DM. Decreases In Readmissions Credited To Medicare’s Program To Reduce Hospital Readmissions Have Been Overstated. Health Aff (Millwood) 2019;38:36–43. [DOI] [PubMed] [Google Scholar]
- 5.Chen M, Grabowski DC . Hospital Readmissions Reduction Program: Intended and Unintended Effects. Med Care Res Rev 2017:doi1077558717744611. [DOI] [PubMed] [Google Scholar]
- 6.Medicare Payment Advisory Commission. A Data Book. Health care spending and the Medicare program. 2016. (Accessed May 16, 2019, at http://www.medpac.gov/docs/default-source/data-book/june-2016-data-book-health-care-spending-and-the-medicare-program.pdf.)
- 7.Medicare Payment Advisory Commission. Report to Congress: Medicare and the Health Care Delivery System. Mandated report: effects fo the Hospital Readmissions Reduction Program. 2018. (Accessed May 16, 2019, at http://www.medpac.gov/docs/default-source/reports/jun18_ch1_medpacreport_sec.pdf?sfvrsn=0.)
- 8.To access the Appendix, click on the Details tab of the article online. (Accessed at
- 9.Centers for Medicare and Medicaid Services. Hospital Quality Initiative. Measure Methodology. (Accessed March 24, 2019, at https://www.cms.gov/medicare/quality-initiatives-patient-assessment-instruments/hospitalqualityinits/measure-methodology.html)
- 10.Dharmarajan K, Qin L, Lin Z, et al. Declining Admission Rates And Thirty-Day Readmission Rates Positively Associated Even Though Patients Grew Sicker Over Time. Health Aff (Millwood) 2016;35:1294–302. [DOI] [PubMed] [Google Scholar]
- 11.van Walraven C, Bennett C, Jennings A, Austin PC, Forster AJ. Proportion of hospital readmissions deemed avoidable: a systematic review. CMAJ 2011;183:E391–402. [DOI] [PMC free article] [PubMed] [Google Scholar]
- 12.Graham KL, Auerbach AD, Schnipper JL, et al. Preventability of Early Versus Late Hospital Readmissions in a National Cohort of General Medicine Patients. Ann Intern Med 2018;168:766–74. [DOI] [PMC free article] [PubMed] [Google Scholar]
- 13.Epstein AM, Jha AK, Orav EJ. The Relationship between Hospital Admission Rates and Rehospitalizations. N Engl J Med 2011;365:2287–95. [DOI] [PubMed] [Google Scholar]
Associated Data
This section collects any data citations, data availability statements, or supplementary materials included in this article.


