Abstract
We recently took advantage of the universal expression of cell adhesion molecule 1 (CADM1) by CD4+ cells infected with HTLV‐1 and the downregulation of CD7 expression that corresponds with the oncogenic stage of HTLV‐1‐infected cells to develop a flow cytometric system using CADM1 versus CD7 plotting of CD4+ cells. We risk‐stratified HTLV‐1 asymptomatic carriers (AC) and indolent adult T‐cell leukemia/lymphoma (ATL) cases based on the CADM1+ percentage, in which HTLV‐1‐infected clones are efficiently enriched. AC and indolent ATL cases were initially classified according to their CADM1+ cell percentage. Follow‐up clinical and flow cytometric data were obtained for 71 cases. In G1 (CADM1+ ≤ 10%) and G2 (10% < CADM1+ ≤ 25%) cases, no apparent clinical disease progression was observed. In G3 (25% < CADM1+ ≤ 50%) cases, five out of nine (55.5%) cases progressed from AC to smoldering‐type ATL. In G4 (50% < CADM1+) cases, the cumulative incidence of receiving systemic chemotherapy at 3 years was 28.4%. Our results indicate that the percentage of the CD4+CADM1+ population predicts clinical disease progression: G1 and G2 cases, including AC cases, are stable and considered to be at low risk; G3 cases, including advanced AC cases and smoldering‐type ATL cases based on the Shimoyama criteria, are considered to have intermediate risk; and G4 cases, which are mainly indolent ATL cases, are unstable and at high risk of acute transformation.
Keywords: asymptomatic carriers, ATL, CADM1, flow cytometry, HTLV‐1
In this study, we analyzed the clinical courses of HTLV‐1 asymptomatic carriers (AC) and indolent ATL cases, and demonstrated that the percentage of the CD4+CADM1+ population predicts clinical disease progression in AC and indolent ATL cases.
1. INTRODUCTION
HTLV‐1 is a human retrovirus that causes HTLV‐1‐associated diseases, including adult T‐cell leukemia/lymphoma (ATL).1, 2 HTLV‐1‐endemic regions include south‐western Japan, the Caribbean Islands, Central and South America, sub‐Saharan Africa, and the Middle East.3 A recent report estimated that 5‐10 million people worldwide are infected with HTLV‐1, an amount that is likely underestimated because of the lack of epidemiological data in developing countries.4 ATL still has a poor prognosis despite the development of various therapeutic options, such as intensive chemotherapy, allogeneic stem cell transplantation, antibody therapy targeting C‐C chemokine receptor type 4, lenalidomide, and anti–viral agents (eg, interferon alpha plus 3ʹ‐azido‐2ʹ,3ʹ‐deoxythymidine [zidovudine]).5, 6, 7, 8, 9, 10 Methods targeting molecular abnormalities, such as dysregulated signal transduction, gene mutation and epigenetic abnormality, are under development.11, 12, 13 In Japan, the estimated lifetime risk in HTLV‐1 asymptomatic carriers (AC) of developing ATL is 6%‐7% for males and 2%‐3% for females.3 Risk factors regarding ATL development have been reported to include HTLV‐1 infection through breastfeeding, advanced age, family history of ATL, and first opportunity for HTLV‐1 testing during treatment of other diseases.14, 15 In addition, a high HTLV‐1 proviral load (PVL), defined as >4 copies/100 peripheral blood mononuclear cells (PBMC), has been reported as one of the major risk factors for ATL development.14
For ATL and AC cases, cell adhesion molecule 1 (CADM1), which was previously discovered as a tumor suppressor in lung cancer,16 was revealed to be highly and exclusively expressed in HTLV‐1‐infected cells in the peripheral blood regardless of the ATL clinical subtype.17, 18 We recently took advantage of the universal expression of CADM1 in HTLV‐1‐infected cells and the downregulation of CD7 expression based on the oncogenic stage of HTLV‐1‐infected cells to develop a flow cytometric system using CADM1 versus CD7 plotting of CD4+ cells (named the HTLV‐1 analysis system by flow cytometry [HAS‐Flow]). We previously reported that HAS‐Flow enables an objective evaluation of the clinical disease progression of AC and indolent ATL cases.19, 20
In the present study, we analyzed the clinical courses of AC and indolent ATL cases and assessed if the percentage of the CD4+CADM1+ population predicts clinical disease progression in AC and indolent ATL cases.
2. MATERIALS AND METHODS
2.1. Samples and clinical data
Cases with AC and indolent ATL (ie smoldering‐type ATL and chronic‐type ATL without unfavorable prognostic factors) were enrolled. Chronic‐type ATL with unfavorable prognostic factors was defined by the presence of at least one of the following three factors: low serum albumin, high serum lactate dehydrogenase or high blood urea nitrogen concentration. In addition to the 60 cases analyzed in our previous report,20 11 cases were newly analyzed in this study. Cases were consecutively enrolled according to PVL levels, and peripheral blood samples were collected from inpatients and outpatients at our institute from June 2009 to December 2016 as described in our previous reports.19, 21 The clinical subtypes of ATL were classified in accordance with the Shimoyama criteria at the time of the initial flow cytometric analysis.22 Cases with various complications, such as active autoimmune disorders and active systemic infections, were excluded. PBMC were isolated using Lymphoprep (Axis‐Shield, Oslo, Norway), suspended in Cellbanker 1 (Takara Bio, Kusatsu, Japan) and cryopreserved in a deep freezer (−80°C) until use. The serum levels of soluble interleukin‐2 receptor (sIL‐2R) were collected from medical records. The percentages of abnormal lymphocytes in white blood cells were counted microscopically by clinical laboratory technicians as previously described.23 The HTLV‐1 PVL data were obtained from the Joint Study on Predisposing Factors of ATL Development (JSPFAD).14 These data were updated on December 2017. The present study was approved by the Institutional Review Board of our institute. Written informed consent was received for all cases.
2.2. Flow cytometry
Frozen cell suspensions were thawed and stained using a combination of monoclonal antibodies as previously described.19, 20 A biotinylated anti–CADM1 antibody (clone 3E1) was purchased from MBL (Nagoya, Japan). A Pacific Orange‐conjugated anti–CD14 antibody was purchased from Life Technologies (Carlsbad, CA, USA). All other antibodies (anti–CD3, anti–CD4 and anti–CD7) and streptavidin‐PE were obtained from BioLegend (San Diego, CA, USA). A FACSAria (BD Immunocytometry Systems, San Jose, CA, USA) was used for the flow cytometric analysis. Acquired raw data were analyzed using FlowJo software (TreeStar, San Carlos, CA, USA). The gating procedure used here was the same as that described previously.19 Briefly, PI+ cells were gated out, and then CD14+ cells were gated out. Next, a CADM1 versus CD7 plot was constructed for CD4+ cells. As in our previous reports, all analyzed cases were categorized into four groups based on the proportion of CADM1+CD7dim (D) and CADM1+CD7− (N) cells: G1 (D + N ≤ 10%), G2 (10% < D + N ≤ 25%), G3 (25% < D + N ≤ 50%) and G4 (50% < D + N).20
2.3. Statistical analyses
Comparisons among the groups were performed by using Fisher’s exact test as appropriate for categorical variables and the Kruskal‐Wallis test for continuous variables. Time to systemic chemotherapy was defined as the time from the day of initial data sampling to the day of initial systemic chemotherapy. Cases that were enrolled in the clinical trial were censored on the day of the enrollment. For AC cases, time to progression was defined as the time from the day of initial data sampling to the day when the proportion of abnormal lymphocytes in white blood cells reached 5% or more. The probabilities of receiving systemic chemotherapy and progression for AC cases were estimated as cumulative incidence, and the groups were compared using a Gray’s test.
All statistical analyses were performed using EZR (Saitama Medical Center, Jichi Medical University, Saitama, Japan), which is a graphical user interface for R (The R Foundation for Statistical Computing, Vienna, Austria, version 3.4.4). EZR is a modified version of R commander (version 2.4‐2), which was designed to add statistical functions that are frequently used in biostatistics.24 All P‐values were two‐sided, and P‐values of 0.05 or less were considered statistically significant.
3. RESULTS
3.1. Flow cytometric profile and characteristics
We first applied our HAS‐Flow method to the blood samples from enrolled participants to categorize them into groups G1‐G4 as described in the Materials and Methods. Flow cytometric profiles of representative cases are shown in Figure 1. The percentages of CADM1+ (D + N) cells in these plots were calculated and used to categorize the subjects into G1 to G4. For example, the percentage of CADM1+ (D + N) in case 1 was 22.9%, so this case was classified as G2. In the same manner, case 2, with a CADM1+ (D + N) percentage of 58.1%, was classified as G4. The characteristics of all cases are summarized in Table 1.
Figure 1.
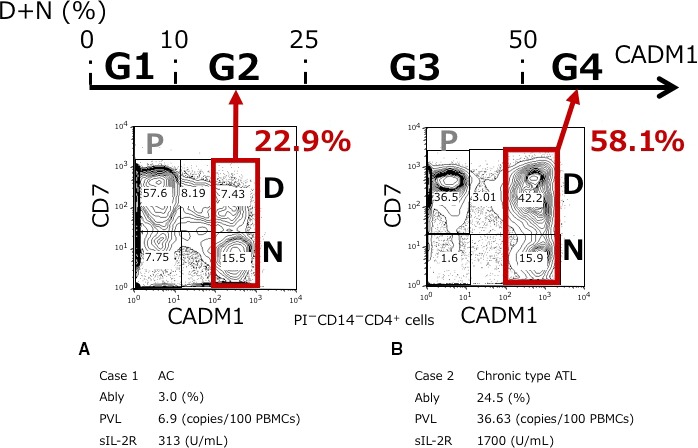
Classification based on the percentage of CADM1+ cells among the CD4+ cells according to a CADM1 versus CD7 plot. The CADM1 versus CD7 plot in CD4+ cells and clinical data of two representative cases are shown. The P (CADM1−CD7+), D (CADM1+CD7dim), and N (CADM1+CD7−) subpopulations were gated as described in our previous report. Cases were classified based on the percentage of CADM1+ (D + N) cells as follows: G1, D + N ≤ 10%; G2, 10% < D + N ≤ 25%; G3, 25% < D + N ≤ 50%; and G4, 50% < D + N. A, Case 1. D + N = 22.9%, which was classified as G2. B, Case 2. D + N = 58.1%, which was classified as G4. Ably, abnormal lymphocytes; AC, asymptomatic carrier; ATL, adult T‐cell leukemia/lymphoma; CADM1, cell adhesion molecule 1; PBMC, peripheral blood mononuclear cells; PVL, proviral load; sIL‐2R, soluble interleukin‐2 receptor
Table 1.
Characteristics of HTLV‐1 asymptomatic carriers and indolent ATL cases
|
G1 (n = 21) |
G2 (n = 17) |
G3 (n = 19) |
G4 (n = 14) |
P‐value | |
|---|---|---|---|---|---|
| Age, median (range) | 52 (31‐70) | 54 (32‐66) | 54 (44‐72) | 51 (43‐68) | 0.84 |
| <40 years old (%) | 2 (9.5) | 3 (17.6) | 0 | 0 | 0.14 |
| ≥40 years old (%) | 19 (90.5) | 14 (82.4) | 19 (100) | 14 (100) | |
| Female (%) | 15 (71.4) | 11 (64.7) | 10 (52.6) | 9 (64.3) | 0.68 |
| Abnormal lymphocytes (%), median (range) | 0.5 (0‐4.0) | 2.0 (0.5‐40.0) | 5.0 (1.3‐8.3) | 19.1 (3.7‐60.5) | <0.01 |
| sIL‐2R (U/mL), median (range) | 291 (181‐637) | 360 (220‐699) | 550 (272‐1310) | 1041 (483‐2490) | <0.01 |
| ≤1000 (%) | 21 (100) | 16 (94.1) | 16 (84.2) | 7 (50.0) | <0.01 |
| >1000, ≤6000 (%) | 0 | 0 | 2 (10.5) | 7 (50.0) | |
| Not evaluated (%) | 0 | 1 (5.9) | 1 (5.3) | 0 | |
| PVL (copies/100 PBMC), median (range) | 0.60 (0.01‐5.25) | 6.90 (2.56‐12.67) | 11.60 (5.51‐29.80) | 39.97 (10.93‐86.97) | <0.01 |
| <4 (%) | 20 (95.2) | 2 (11.8) | 0 | 0 | <0.01 |
| ≥4 (%) | 1 (4.8) | 13 (76.5) | 15 (78.9) | 11 (78.6) | |
| Not evaluated (%) | 0 | 2 (11.8) | 4 (21.1) | 3 (21.4) | |
| Initial diagnosis | <0.01 | ||||
| Asymptomatic carriers (%) | 21 (100) | 17 (100) | 9 (47.4) | 2 (14.3) | |
| Smoldering‐type ATL (%) | 0 | 0 | 9 (47.4) | 6 (42.9) | |
| Chronic‐type ATL (%) | 0 | 0 | 1 (5.3) | 6 (42.9) |
Abbreviations: ATL, adult T‐cell leukemia/lymphoma; PBMC, peripheral blood mononuclear cells; PVL, proviral load; sIL‐2R, soluble interleukin‐2 receptor.
A total of 71 cases were analyzed. All cases were categorized into G1 through G4 based on their initial flow cytometric profile. Although there was no significant difference in the age or gender distribution among the four groups, the percentage of abnormal lymphocytes, the serum levels of sIL‐2R, PVL levels, and the initial diagnosis all differed significantly among groups. In G1 and G2, all cases were diagnosed as AC. However, all but one case in G1 had a PVL of <4 copies/100 PBMC, whereas the majority of G2 cases had a PVL of ≥4 copies/100 PBMC. In G3, the median percentage of abnormal lymphocytes was 5.0% (range, 1.3%‐8.3%). In this group, nine cases (47.4%) were diagnosed as AC, and 10 cases (52.7%) were diagnosed with indolent ATL (nine with smoldering‐type ATL and one with chronic‐type ATL). In G4, only two cases (14.3%) were diagnosed as AC, and 12 cases (85.8%) were diagnosed with indolent ATL (six with smoldering‐type ATL and six with chronic‐type ATL). For the two G4 cases that were diagnosed as AC, the serum levels of sIL‐2R and PVL were 551 U/mL and 16.34 copies/100 PBMC, and 483 U/mL and not evaluated, respectively.
In this study, the flow cytometric analysis was performed several times in most cases during the clinical course. Serial changes in CADM1+ (%) of all cases are shown in Figure 2. In G1, the percentage of CADM1+ cells of all cases remained less than 10%, while this was between 10% and 25% in all but four cases in G2 throughout the clinical course. However, in G3, the percentage of CADM1+ cells of seven out of 19 cases (36.8%) exceeded 50% during the clinical course. In G4, no cases demonstrated less than 50% CADM1+ during the clinical course. In this study, we analyzed only the initial flow cytometric profiles because our purpose was to predict the prognosis of cases by evaluating the flow cytometric profiles at the first screening.
Figure 2.
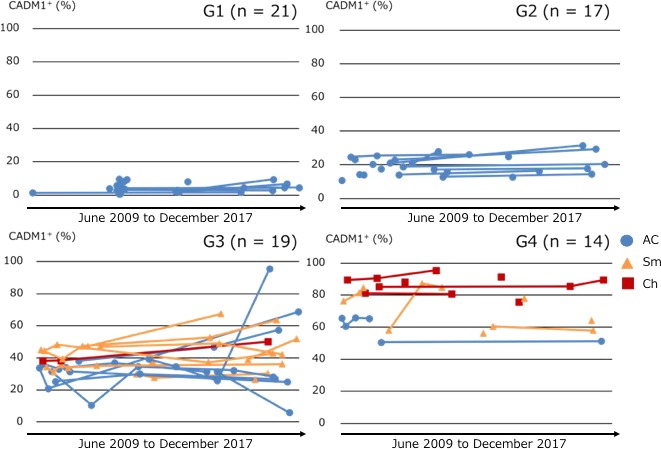
Serial changes in CADM1+ (%) of all cases classified by CADM1+ (%) in the CADM1 versus CD7 plot. AC, asymptomatic carrier (blue circles); Ch, chronic‐type; ATL, adult T‐cell leukemia/lymphoma (red squares); Sm, smoldering‐type ATL (yellow triangles)
3.2. Cumulative incidence of receiving systemic chemotherapy
We next assessed the cumulative incidence of receiving systemic chemotherapy in all cases using Gray’s test; these results are shown in Figure 3. The median observation period was 1347 days (range, 1‐2926 days). During this observation period, systemic chemotherapies were not introduced in G1 or G2 cases, even in those with a PVL of ≥4 copies/100 PBMC, while two cases in G3 received systemic chemotherapy. In G4, four cases received systemic chemotherapy (one with AC, two with smoldering‐type ATL and one with chronic‐type ATL), and the cumulative incidence of receiving systemic chemotherapy at 3 years was 28.4% (95% confidence interval [CI]: 0%‐51.2%). The G4 AC case receiving systemic chemotherapy demonstrated serum levels of sIL‐2R as 483 U/mL. According to the univariate analysis results, the G1‐G4 classification was significantly associated with the probability of receiving systemic chemotherapy (Gray’s test for the entire group, P = 0.001) (Figure 3A). Notably, there were more cases that received systemic chemotherapy in G4 compared with the other groups (Gray’s test, P < 0.001) (Figure S1). Even when limited to indolent ATL cases, cases in G4 tended to receive systemic chemotherapy compared with cases in G3 (Gray’s test, P = 0.06) (Figure 3B). These results indicate that the cases in G4 were at high risk of undergoing acute transformations.
Figure 3.
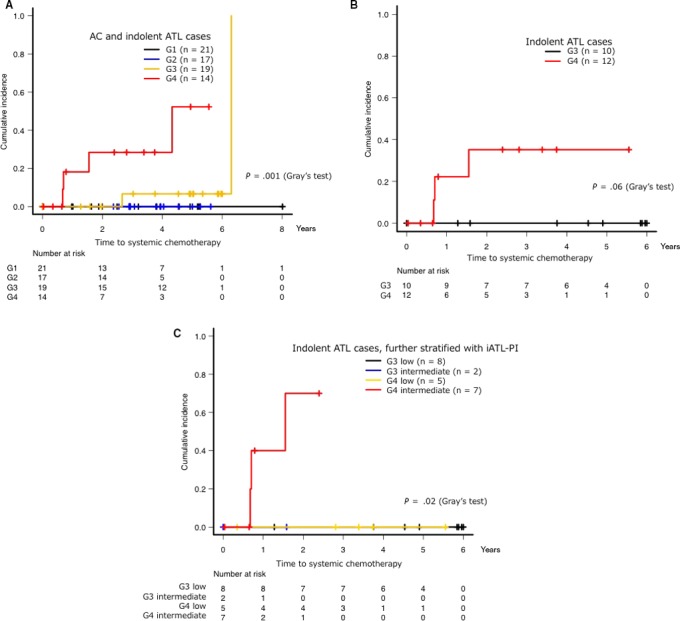
Cumulative incidence of receiving systemic chemotherapy based on the percentage of CADM1+ (D + N) cells. The use of topical chemotherapy, such as skin‐directed therapy and regional irradiation, were not counted as progression. iATL‐PI was categorized into three risk groups for clinical progression as follows: low risk, sIL‐2R ≤ 1000 U/mL; intermediate risk, 1000 U/mL < sIL‐2R ≤ 6000 U/mL; and high risk, sIL‐2R > 6000 U/mL. Cumulative incidence of receiving systemic chemotherapy in each group (A), in indolent adult T‐cell leukemia/lymphoma (ATL) cases (B), or in indolent ATL cases stratified by iATL‐PI (C). AC, asymptomatic carrier; ATL, adult T‐cell leukemia/lymphoma; iATL‐PI, indolent ATL prognostic index
The prognostic index based on the serum levels of sIL‐2R (iATL‐PI) is a promising tool for risk‐adapted therapeutic intervention.25 iATL‐PI was defined with three risk groups as follows: low risk, sIL‐2R ≤ 1000 U/mL; intermediate risk, 1000 U/mL < sIL‐2R ≤ 6000 U/mL; and high risk, sIL‐2R > 6000 U/mL. We further performed a subgroup analysis using stratification with the percentage of CADM1+ cells and the iATL‐PI for indolent ATL cases (Figure 3C). In G3, there were two cases classified as intermediate risk and eight cases classified as low risk; in G4, there were seven cases classified as intermediate risk and five cases classified as low risk. The median PVL of these five cases classified as low risk was 39.97 copies/100 PBMC (range, 10.93‐86.97 copies/100 PBMC). No G4 cases classified as low risk received systemic chemotherapy. In addition, there were more cases that received systemic chemotherapy in the group of patients classified as G4 and intermediate risk compared with the other groups (Gray’s test, P = 0.02), and the cumulative incidence of receiving systemic chemotherapy at 1 year in this group was 400.0% (95% CI: 0%‐70.7%).
3.3. Cumulative incidence of progression from asymptomatic carriers to indolent adult T‐cell leukemia/lymphoma
The AC cases in our study pool were extracted, and their cumulative incidence of progression to indolent ATL was analyzed. The median observation period was 1106 days (range, 1‐2926 days). There were no cases in G1 that progressed to indolent ATL during this observation period, and only one case in G2 that progressed to smoldering‐type ATL. This case had a PVL of 10.39 copies/100 PBMC. However, five out of nine cases (55.5%) in G3 clinically progressed to smoldering‐type ATL (Figure S2). The median percentage of abnormal lymphocytes, serum levels of sIL‐2R and PVL of these five cases were 2.7% (range, 1.3‐4.5%), 463 U/mL (range, 309‐640 U/mL) and 10.27 copies/100 PBMC (range, 9.72‐13.76 copies/100 PBMC), respectively. For G3 and G4 cases, the cumulative incidence of progression to indolent ATL at 3 years was 45.5% (95% CI: 6.5‐68.2%) (Figure 4), indicating that these cases were at high risk for clinical disease progression from AC to indolent ATL. All patients who were diagnosed as AC in G4 progressed to smoldering‐type ATL during the observation period. We further examined the cases in G3 and G4 to identify those with the highest risk of clinical disease progression. Figure 5 shows the scatter plot of PVL versus the percentage of CADM1+ cells from the CADM1 versus CD7 plot in the AC cases with or without progression to indolent ATL; cases with a PVL of > 10 copies/100 PBMC in either G3 or G4 appeared to have a higher risk for ATL progression than those with a lower PVL.
Figure 4.
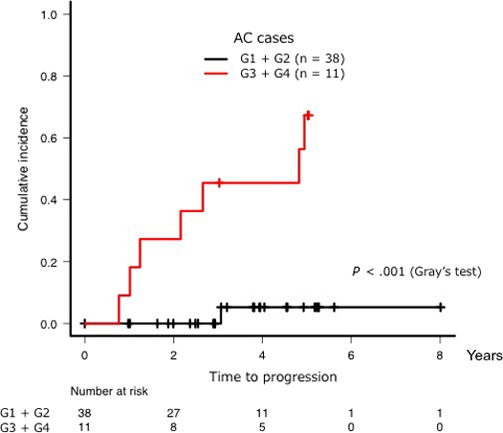
Cumulative incidence of progression to indolent adult T‐cell leukemia/lymphoma (ATL) from asymptomatic carrier (AC) when comparing G1 + G2 cases with G3 + G4 cases. Progression was defined as an increase in the percentage of abnormal lymphocytes in the white blood cell population to ≥ 5%
Figure 5.
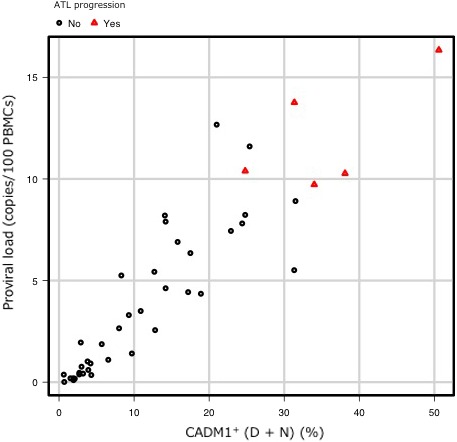
Scatter plot of the HTLV‐1 proviral load (PVL) versus the percentage of CADM1+ cells from the CADM1 versus CD7 plot. Scatter plot of the PVL versus the percentage of CADM1+ cells from the CADM1 versus CD7 plot in asymptomatic carrier (AC) cases with (red triangles) or without (black circles) progression to indolent adult T‐cell leukemia/lymphoma (ATL)
4. DISCUSSION
The CAMD1 versus CD7 plot produced by flow cytometry is useful for the analysis of progression from HTLV‐1 infection to ATL.19, 20 HTLV‐1 clones can be highly purified in the CADM1+CD7dim and CADM1+CD7− subpopulations in samples from AC as well as ATL patients. Sorting by flow cytometry enables a subsequent molecular analysis for purified HTLV‐1‐infected clones. It is also useful for clinical practice. The combination of flow cytometry, clonality analysis and conventional clinical data in our previous study revealed that classification based on the percentage of CADM1+ cells provides a useful representation of the early clinical stage of HTLV‐1 infection through to ATL development.20 In the present study, we performed a follow‐up analysis of the AC and indolent ATL cases. Our data reveal that although some fluctuation can be seen in the follow‐up period, this classification at the initial point of analysis predicts clinical disease progression in HTLV‐1 infected cases well despite this fluctuation.
The percentage of CADM1+CD4+ cells generally correlated with the clinical classification made based on the Shimoyama criteria (Table 1). G1 and G2 included only AC cases. Smoldering‐type ATL cases were found in both G3 and G4, and chronic‐type ATL cases were dominant in G4. As shown in Table 1 and Figure S3, although the percentage of abnormal lymphocytes was elevated in cases with the most advanced clinical stage, these levels overlapped among cases in G1 to G3. Therefore, these cases are difficult to distinguish using conventional methods such as the percentage of abnormal lymphocytes. However, approximately half of the AC cases in G3 clinically progressed from AC to smoldering‐type ATL (Figure S2). Thus, it appears that AC cases classified as G3 have a higher risk of clinical disease progression compared with AC cases classified as G1 or G2. Our previous study revealed that the CADM1+ HTLV‐1‐infected cells in G3 cases had oligoclonal or major HTLV‐1 clones.20 In addition, a previous gene expression microarray analysis revealed that these cells in advanced AC or indolent ATL cases formed one cluster distinct from those in aggressive ATL cases.19 These results suggested that the advanced AC cases and smoldering‐type ATL cases in G3 could not be distinguished and should be classified in the same progression stage of HTLV‐1 infection. Cases in G3 are, thus, considered to be on the boundary between AC and smoldering‐type ATL. In the present study, only two cases in G3 received systemic chemotherapy (Figure 3A). Our data show that although AC cases in G3 have a high risk of ATL progression, their prognosis might not be poor. They should be considered as having intermediate risk of acute transformation.
In clinical practice in Japan, indolent ATL cases are carefully observed until acute transformation is confirmed, and intensive chemotherapy is generally initiated after acute transformation.26, 27, 28 Here, the cumulative incidence of receiving systemic chemotherapy at 3 years was 28.4% in G4 cases (Figure 3A). All the cases that received chemotherapy were considered to have transformed into aggressive ATL. Notably, the cases in G4 included AC, smoldering‐type ATL, and chronic‐type ATL subjects. Our data indicate that the cases in G4 should all be considered as high‐risk cases, regardless of their clinical subtype. The values of sIL‐2R have been reported as a prognostic factor for indolent ATL,25 and high PVL levels have been reported as one of the major risk factors for ATL development.14 However, although high PVL levels can predict candidates for ATL progression, they do not necessarily reflect poor prognosis. As shown in Figure 5, most cases with PVL of more than 4 copies/100 PBMC in G1 and G2 did not progress to ATL during the observation period. Our results suggest that combining the flow cytometric analysis and clinical data, such as the sIL‐2R and PVL levels, might be useful for guiding the observation of high‐risk cases (Figures 3C and 5); in addition, cases with a PVL of >10 copies/100 PBMC form a true high‐risk group for ATL progression. Cases in G1 and G2 might not be distinguishable based on these criteria. Therefore, we provisionally defined cases in G1 and G2 as being at low risk of acute transformation. The establishment of an intervention therapy to prevent acute transformation will be necessary, especially for high‐risk cases.
In this study, there were four patients with chronic‐type ATL with unfavorable prognostic factors who did not receive chemotherapy at diagnosis according to the physician’s decision. They were all categorized into G4 and intermediate risk. The cumulative incidence of receiving systemic chemotherapy at 1 year in this group was 250.0% (95% CI: 0%‐57.4%). Regarding prognosis, there were no statistically significant differences between G4 or G4 classified as intermediate risk and chronic‐type ATL with unfavorable prognostic factors (Figure S4).
Our study has some limitations. First, our study is a single‐center retrospective study with a small number of cases, and the follow‐up period is relatively short. A large‐scale prospective follow‐up study for validation is warranted. Second, our flow cytometric analysis is difficult to apply for cases that have transformed into lymphoma‐type ATL with few abnormal lymphocytes in the peripheral blood. Third, we did not evaluate the proportion of CD4+CD25+ cells that are expressed in HTLV‐1 infected cells, and further investigation is required to compare the specificity of HAS‐Flow with other flow cytometric systems using CD4/CD25.
In conclusion, we were able to risk‐stratify AC and indolent ATL cases by their classification based on the percentage of CADM1+ cells as determined by a flow cytometric analysis. In combination with findings from our previous studies, this classification is useful for the prediction of the prognosis in HTLV‐1‐infected cases. Exploration of further molecular markers, such as gene mutations and epigenetic abnormalities, in each group from G1 to G4 is warranted.
CONFLICT OF INTEREST
The authors declare no conflict of interest.
Supporting information
ACKNOWLEDGMENTS
We thank Ms Kaori Sakurai and Ms Kiyomi Kubo in our laboratory for their assistance with collecting clinical data. We also thank JSPFAD for providing the PVL data. We are grateful to the hospital staff for their commitment to providing high‐quality care to all patients. We thank Katie Oakley, PhD, from Edanz Group (http://www.edanzediting.com/ac) for editing a draft of this manuscript. This work was supported by the Research Programs on Emerging and Re‐emerging Infectious Disease (No. JP 19fk010839 [KU, TW]) from the Japan Agency for Medical Research and Development (AMED) and by Health and Labour Sciences Research Grants (Grant Number H29‐ganseisaku‐shitei‐001. [KU, TW]) from the Ministry of Health, Labour and Welfare of Japan.
Makiyama J, Kobayashi S, Watanabe E, et al. CD4+CADM1+ cell percentage predicts disease progression in HTLV‐1 carriers and indolent adult T‐cell leukemia/lymphoma. Cancer Sci. 2019;110:3746–3753. 10.1111/cas.14219
Junya Makiyama and Seiichiro Kobayashi contributed equally to this work.
REFERENCES
- 1. Uchiyama T, Yodoi J, Sagawa K, et al. Adult T‐cell leukemia: clinical and hematologic features of 16 cases. Blood. 1977;50:481‐492. [PubMed] [Google Scholar]
- 2. Yoshida M, Miyoshi I, Hinuma Y. Isolation and characterization of retrovirus from cell lines of human adult T‐cell leukemia and its implication in the disease. Proc Natl Acad Sci U S A. 1982;79:2031‐2035. [DOI] [PMC free article] [PubMed] [Google Scholar]
- 3. Iwanaga M, Watanabe T, Yamaguchi K. Adult T‐cell leukemia: a review of epidemiological evidence. Front Microbiol. 2012;3:322. [DOI] [PMC free article] [PubMed] [Google Scholar]
- 4. Gessain A, Cassar O. Epidemiological aspects and world distribution of HTLV‐1 infection. Front Microbiol. 2012;3:388. [DOI] [PMC free article] [PubMed] [Google Scholar]
- 5. Tsukasaki K, Utsunomiya A, Fukuda H, et al. VCAP‐AMP‐VECP compared with biweekly CHOP for adult T‐cell leukemia‐lymphoma: Japan clinical oncology group study JCOG9801. J Clin Oncol. 2007;25:5458‐5464. [DOI] [PubMed] [Google Scholar]
- 6. Hishizawa M, Kanda J, Utsunomiya A, et al. Transplantation of allogeneic hematopoietic stem cells for adult T‐cell leukemia: a nationwide retrospective study. Blood. 2010;116:1369‐1376. [DOI] [PubMed] [Google Scholar]
- 7. Ishida T, Joh T, Uike N, et al. Defucosylated anti‐CCR4 monoclonal antibody (KW‐0761) for relapsed adult T‐cell leukemia‐lymphoma: a multicenter phase II study. J Clin Oncol. 2012;30:837‐842. [DOI] [PubMed] [Google Scholar]
- 8. Ishida T, Jo T, Takemoto S, et al. Dose‐intensified chemotherapy alone or in combination with mogamulizumab in newly diagnosed aggressive adult T‐cell leukaemia‐lymphoma: a randomized phase II study. Br J Haematol. 2015;169:672‐682. [DOI] [PMC free article] [PubMed] [Google Scholar]
- 9. Ishida T, Fujiwara H, Nosaka K, et al. Multicenter Phase II Study of Lenalidomide in Relapsed or Recurrent Adult T‐Cell Leukemia/Lymphoma: ATLL‐002. J Clin Oncol. 2016;34:4086‐4093. [DOI] [PubMed] [Google Scholar]
- 10. Bazarbachi A, Plumelle Y, Carlos Ramos J, et al. Meta‐analysis on the use of zidovudine and interferon‐alfa in adult T‐cell leukemia/lymphoma showing improved survival in the leukemic subtypes. J Clin Oncol. 2010;28:4177‐4183. [DOI] [PubMed] [Google Scholar]
- 11. Fujikawa D, Nakagawa S, Hori M, et al. Polycomb‐dependent epigenetic landscape in adult T‐cell leukemia. Blood. 2016;127:1790‐1802. [DOI] [PubMed] [Google Scholar]
- 12. Yamagishi M, Nakano K, Miyake A, et al. Polycomb‐mediated loss of miR‐31 activates NIK‐dependent NF‐kappaB pathway in adult T cell leukemia and other cancers. Cancer Cell. 2012;21:121‐135. [DOI] [PubMed] [Google Scholar]
- 13. Bangham CRM, Human T. Cell leukemia virus type 1: persistence and pathogenesis. Annu Rev Immunol. 2018;36:43‐71. [DOI] [PubMed] [Google Scholar]
- 14. Iwanaga M, Watanabe T, Utsunomiya A, et al. Human T‐cell leukemia virus type I (HTLV‐1) proviral load and disease progression in asymptomatic HTLV‐1 carriers: a nationwide prospective study in Japan. Blood. 2010;116:1211‐1219. [DOI] [PubMed] [Google Scholar]
- 15. Hino S. Establishment of the milk‐borne transmission as a key factor for the peculiar endemicity of human T‐lymphotropic virus type 1 (HTLV‐1): the ATL prevention program Nagasaki. Proc Jpn Acad Ser B Phys Biol Sci. 2011;87:152‐166. [DOI] [PMC free article] [PubMed] [Google Scholar]
- 16. Kuramochi M, Fukuhara H, Nobukuni T, et al. TSLC1 is a tumor‐suppressor gene in human non‐small‐cell lung cancer. Nat Genet. 2001;27:427‐430. [DOI] [PubMed] [Google Scholar]
- 17. Sasaki H, Nishikata I, Shiraga T, et al. Overexpression of a cell adhesion molecule, TSLC1, as a possible molecular marker for acute‐type adult T‐cell leukemia. Blood. 2005;105:1204‐1213. [DOI] [PubMed] [Google Scholar]
- 18. Nakahata S, Saito Y, Marutsuka K, et al. Clinical significance of CADM1/TSLC1/IgSF4 expression in adult T‐cell leukemia/lymphoma. Leukemia. 2012;26:1238‐1246. [DOI] [PubMed] [Google Scholar]
- 19. Kobayashi S, Nakano K, Watanabe E, et al. CADM1 expression and stepwise downregulation of CD7 are closely associated with clonal expansion of HTLV‐I‐infected cells in adult T‐cell leukemia/lymphoma. Clin Cancer Res. 2014;20:2851‐2861. [DOI] [PubMed] [Google Scholar]
- 20. Kobayashi S, Watanabe E, Ishigaki T, et al. Advanced human T‐cell leukemia virus type 1 carriers and early‐stage indolent adult T‐cell leukemia‐lymphoma are indistinguishable based on CADM1 positivity in flow cytometry. Cancer Sci. 2015;106:598‐603. [DOI] [PMC free article] [PubMed] [Google Scholar]
- 21. Tian Y, Kobayashi S, Ohno N, et al. Leukemic T cells are specifically enriched in a unique CD3(dim) CD7(low) subpopulation of CD4(+) T cells in acute‐type adult T‐cell leukemia. Cancer Sci. 2011;102:569‐577. [DOI] [PubMed] [Google Scholar]
- 22. Shimoyama M. Diagnostic criteria and classification of clinical subtypes of adult T‐cell leukaemia‐lymphoma. A report from the lymphoma study group (1984–87). Br J Haematol. 1991;79:428‐437. [DOI] [PubMed] [Google Scholar]
- 23. Ishigaki T, Zaike Y, Nojima M, et al. Quantification of adult T‐cell leukemia/lymphoma cells using simple four‐color flow cytometry. Clin Chem Lab Med. 2015;53:85‐93. [DOI] [PubMed] [Google Scholar]
- 24. Kanda Y. Investigation of the freely available easy‐to‐use software ‘EZR’ for medical statistics. Bone Marrow Transplant. 2013;48:452‐458. [DOI] [PMC free article] [PubMed] [Google Scholar]
- 25. Katsuya H, Shimokawa M, Ishitsuka K, et al. Prognostic index for chronic‐ and smoldering‐type adult T‐cell leukemia‐lymphoma. Blood. 2017;130:39‐47. [DOI] [PubMed] [Google Scholar]
- 26. Tsukasaki K, Hermine O, Bazarbachi A, et al. Definition, prognostic factors, treatment, and response criteria of adult T‐cell leukemia‐lymphoma: a proposal from an international consensus meeting. J Clin Oncol. 2009;27:453‐459. [DOI] [PMC free article] [PubMed] [Google Scholar]
- 27. Cook LB, Fuji S, Hermine O, et al. Revised adult T‐Cell leukemia‐lymphoma international consensus meeting report. J Clin Oncol. 2019;37:677‐687. [DOI] [PMC free article] [PubMed] [Google Scholar]
- 28. Tsukasaki K, Fukushima T. JSH Practical Guidelines for Hematological Malignancies, 2018: II. Lymphoma‐8. Adult T‐cell leukemia‐lymphoma. Int J Hematol. 2019;109(3):249‐259. [DOI] [PubMed] [Google Scholar]
Associated Data
This section collects any data citations, data availability statements, or supplementary materials included in this article.
Supplementary Materials


