Abstract
The incidence of rare neuroendocrine tumors (NET) is rapidly increasing. Neuroendocrine carcinoma (NEC) is a NET with poorly differentiated histological features, high proliferative properties and associated poor prognoses. As these carcinomas are so rare and, thus, affect only a small number of patients allowing for few cell lines to be derived from patient biopsies, the histological, immunohistochemical, and clinical characteristics associated with colorectal NEC and NEC in other organs have yet to be clearly defined. Herein, we describe the establishment of a novel NEC cell line (SS‐2) derived from a tumor resection of the ascending colon from a 59‐year‐old Japanese woman. The histological, electron microscopic and immunohistochemical features of chromogranin A (CgA) as well as confirmation of synaptophysin positivity in this tumor were typical of those commonly observed in surgically resected colorectal NEC. Further, the Ki‐67 labeling index of the resected tumor was >20% and, thus, the tumor was diagnosed as an NEC of the ascending colon. The SS‐2 cell line maintained characteristic features to those of the resected tumor, which were further retained following implantation into subcutaneous tissues of nude mice. Additionally, when SS‐2 cells were seeded into ultra‐low attachment plates, they formed spheres that expressed higher levels of the cancer stem cell (CSC) marker CD133 compared to SS‐2 cells cultured under adherent conditions. SS‐2 cells may, therefore, contribute to the current knowledge on midgut NEC biological function while providing a novel platform for examining the effects of colorectal NEC drugs, including CSC.
Keywords: cancer stem cell, chromogranin A, colorectal cancer, neuroendocrine carcinoma, synaptophysin
This is the first description of a colorectal NEC cell line established from a tumor of the human ascending colon. Analysis of the present NEC cell line derived from the midgut should clarify the mechanisms of proliferation and metastasis of colorectal NEC and allow tests of antitumor drugs.
1. INTRODUCTION
Neuroendocrine tumors (NET) that primarily arise from the gastrointestinal tract, lungs, pancreas, liver, and thymus, are considered extremely rare; however, recently, their incidence has begun to rapidly increase.1 Specifically, the epidemiological database established by the Surveillance, Epidemiology and End Results (SEER) study in the USA has reported that the incidence of NET increased fivefold from 1.09 to 5.25 per 100 000 individuals between 1973 and 2014.1 Furthermore, 3379 patients were treated for pancreatic neuroendocrine tumors (pNET) in 2010 in Japan, which represented a 1.2‐fold increase in the incidence from 2005 to 2010,2 with an additional approximately 8088 patients having been treated for gastrointestinal neuroendocrine tumors (GI‐NET), representing an approximate 1.8‐fold increase since 2005 in Japan. Furthermore, midgut NET accounts for 30%‐60% of all gastrointestinal NET in the Americas and European countries, yet is extremely rare in Asian countries.1, 2, 3
When NET cells were first isolated, they were described as enterochromaffin cells and, thus, were classified as benign or as having low malignant potential. However, many NET show metastatic properties and, therefore, NET have been reclassified as malignant. In 2010, the World Health Organization (WHO) defined four types of NET, namely NET G1, NET G2, NET G3 and mixed adenoneuroendocrine carcinoma (MANEC), according to the proliferative capacity of the cells and the ratios (%) of cells that were found to establish exocrine phenotypes.4 NET G1, G2 and G3 are classified as gastroenteropancreatic NET (GEP‐NET) based on the number of cells engaged in active mitotic division and the Ki‐67 labeling index. Specifically, NET G3, also known as neuroendocrine cell carcinoma (NEC), is defined as containing >20 mitotic cells in 10 high‐power fields or as having a Ki‐67 labeling index >20%. Recently, in the most recent WHO classification of 2019, NEC has been divided into small‐cell and large‐cell types.5 However, another subgroup of NET has been described that is not included in the WHO classification system, although it is associated with NET G3 and has a well‐differentiated morphology.6, 7 Hence, Velayoudom‐Cephise et al proposed a new classification of NET G3 based on a combination of morphological characteristics and tumor grading.6
The histological appearance of NEC is solid or trabecular, with a high mitotic index, and is immunohistochemically positive for chromogranin A (CgA), synaptophysin, CD56 (neural cell adhesion molecules: NCAM) and/or somatostatin receptor type 2 (SSTR2). Clinically, NEC is among the most aggressive types of tumor, with high metastatic capacity and resistance to chemotherapy resulting in poor prognoses. Median overall survival of patients with colonic NET G3 is ~8 months.8
Colorectal malignant tumors with a solid or alveolar structure are rare and include poorly differentiated adenocarcinoma, medullary carcinoma and NEC.9, 10 However, the histopathological and clinical characteristics of colorectal NEC and NEC from other sources have not been fully investigated because of the paucity of clinical sources and established cell lines. NEC cell lines from the ascending colon are very rarely established, with HROC57 the only new line reported in 2018.11
We have, therefore, established a novel NEC cell line derived from an ascending colon tumor, and have transplanted the cells into nude mice. We also determined that this cell line formed spheres in vitro that expressed high levels of a specific cancer stem cell (CSC) marker. Analysis of this newly established NEC cell line derived from the midgut should serve to elucidate the mechanisms of proliferation and metastasis of colorectal NEC and inform the development of effective platforms for the testing of antitumor drugs.
2. MATERIALS AND METHODS
2.1. Original tumor processing
Neuroendocrine carcinoma cells were derived from a tumor resected from the ascending colon of a 59‐year‐old Japanese woman referred to Nippon Medical School Hospital in 2004 with abdominal pain. Colonoscopy showed a type 2 tumor in the ascending colon, and a biopsy suggested endocrine cell carcinoma with solid proliferation and a high Ki‐67 labeling index. The patient underwent right hemicolectomy and bowel containing the 70 mm × 45 mm tumor was resected. Immunohistochemical staining and transmission electron microscopic analysis of the resected tumor showed characteristic features of NEC. A portion of the tumor was processed for primary culturing. The patient and her family provided written informed consent. This study proceeded in accordance with the Declaration of Helsinki 2013. Furthermore, the Ethics Committee and Institutional Review Board at Nippon Medical School approved all procedures associated with this study (registration no. 26‐03, 2014).
2.2. Primary in vitro culture
The tumor was rinsed with sterile PBS supplemented with benzylpenicillin potassium (100 U/mL) and kanamycin sulfate and cut into 1‐mm fragments. The fragments were suspended in 20% FBS (Nichirei Bioscience Inc.) and seeded into 60‐mm primary tissue culture dishes that were incubated in a humidified incubator at 37°C in 5% CO2 for 4 hours. The dishes were coated with 3‐4 mL RPMI‐1640 medium (Thermo Fisher Scientific) containing 15% FBS and antibiotics. The growth media was replaced every 3 days. When fibroblast cell growth was observed, an essentially pure tumor cell population was extracted by differential trypsinization followed by 5‐6 passages. The new cell line was cultured for more than 60 passages in the RPMI‐1640 medium containing 10% FBS and named SS‐2.
2.3. Short tandem repeat and amelogenin analyses of SS‐2 cells
Genomic DNA was extracted from SS‐2 cells using the Wizard SV Genomic DNA Purification System (Promega) according to manufacturer’s instructions. DNA concentration was quantified using a Qubit dsDNA BR Assay Kit (Thermo Fisher Scientific). Short tandem repeat (STR) and amelogenin expression levels were then analyzed using the GenePrint 10 System (Promega), as described by the manufacturer.
2.4. Immunohistochemical analysis
Paraffin‐embedded tissue sections (3.5 µm) and cells cultured on chamber slides were immunostained using Histofine Simple Stain Max PO (R) or (M) kits (Nichirei Biosciences Inc.). Endogenous peroxidase activity was blocked by incubating the sections with 0.3% hydrogen peroxide in methanol for 30 minutes. The slides were then incubated for 20 hours at 4°C in PBS containing 1% BSA (Sigma‐Aldrich Co.), 1:1000‐diluted rabbit anti‐chromogranin antibody (A0430; Dako), 1:300 rabbit anti‐synaptophysin antibody (A0010; Dako) , 1:200 diluted mouse anti‐Ki‐67 antibody (M7240; Dako)12 or 1:100 mouse anti‐INSM1 (sc‐271408; Santa Cruz Biotechnology). Bound antibodies were detected using Simple Stain Max PO (R) or (M) with diaminobenzidine‐tetrahydrochloride (DAB) as the substrate, and visualized by counterstaining with Mayer’s hematoxylin. Negative controls were not stained with the primary antibodies. When the immunoreactivity for CgA or synaptophysin was found to be positive in more than 50% of the tumor cells, a diagnosis of NEC was made in accordance with guidelines established in a previous report.13
2.5. Heterotopic transplantation in vivo
Tumorigenicity of SS‐2 cells following 35 passages was determined in 4‐week‐old Balb/c‐nu athymic female nude mice (CLEA Japan Inc.). Briefly, cultured SS‐2 cells (1 × 10⁶/mL) were harvested, washed, suspended in PBS (0.1 mL) and injected s.c. into the left flanks of the mice. Tumor development was assessed weekly and mice presenting with tumors were killed. Tumor tissues were excised and fixed in 10% neutral‐buffered formalin for histopathological and immunohistochemical analyses. All animal experiments were carried out according to the guidelines established by the Nippon Medical School Animal Ethics Committee.
2.6. Immunoblotting
Cells were lysed with 50 mmol/L Tris‐HCl pH 7.4, 150 mmol/L NaCl, 1.5 mmol/L MgCl2, 5 mmol/L EDTA, and 1% Triton X‐100 (Nacalai Tesque Inc.), containing protease and phosphatase inhibitor cocktails. Lysates were separated by SDS‐PAGE and then transferred onto PVDF membranes (Merck Millipore). After blocking, the membranes were incubated with the following primary antibodies: mouse monoclonal anti‐INSM1 (sc‐271408; Santa Cruz Biotechnology), polyclonal Anti‐Chromogranin A (ab45179; Abcam), mouse monoclonal Anti‐Synaptophysin (713831; Nichirei Biosciences Inc.), and mouse monoclonal Anti‐β‐Actin (A5316; Sigma‐Aldrich). Membranes were incubated with the appropriate peroxidase‐conjugated secondary antibodies (Cell Signaling Technology), washed, and developed with ECL Prime reagent (GE Healthcare).
2.7. Transfection of siRNA targeting INSM1
We used two siRNAs targeting INSM1 RNA: siRNA‐1 (5′‐CUC UCC UUU UGA CUC CUU Utt‐3′; Thermo Fisher Scientific) and INSM1 siRNA‐2 (5′‐GCC UCA GUG UUU CAC GUA Att‐3′; Thermo Fisher Scientific). Cells were plated at a density of 2 × 10⁵/well in 35‐mm dishes and transfected 24 hours later with 5 nmol/L of one of the targeting siRNAs or Silencer Negative Control siRNA (sicont) using Lipofectamine RNAiMAX Transfection Reagent (Thermo Fisher Scientific) according to the manufacturer’s protocol. Analysis was carried out 96 hours after transfection.
2.8. HT‐29‐Luc and Caco‐2 cells
Conventional colorectal cancer cell lines, namely, HT‐29‐Luc (JCRB Cell Bank) and Caco‐2 (Riken BRC Cell Bank) were cultured in McCoy’s 5A and RPMI‐1640 media, respectively. Both medias were supplemented with 10% FBS and placed in a humidified incubator at 37°C in 5% CO2 atmosphere.
2.9. Sphere formation and qRT‐PCR analyses of cancer stem cell markers
We seeded SS‐2, HT‐29‐Luc and Caco‐2 cells (1.0 × 10⁴/well) in 100‐mm, ultra‐low attachment plates containing serum‐free media supplemented with 10 ng/mL recombinant human basic fibroblast growth factor (bFGF; ReproCell Inc., 10 ng/mL) and epidermal growth factor (EGF; R&D Systems, 20 ng/mL) as previously described.14, 15 Spheres were photographed on day 7 using an Eclipse TS100 phase‐contrast microscope (Nikon Instech Co. Ltd). Total RNA was isolated from cells using RNeasy Plus Mini Kits (QIAGEN) and reverse‐transcribed using ReverTra Ace qPCR RT kit (Toyobo) according to the manufacturers’ instructions. Real‐time quantitative reverse transcription polymerase chain reaction (qRT‐PCR) was carried out using a Power SYBR Green PCR Master Mix kit (Applied Biosystems) and the StepOnePlus real‐time PCR system (Applied Biosystems). The primer sets used to carry out the qRT‐PCR reactions are presented in Table 1.
Table 1.
List of primer sets for real‐time PCR
| Gene | Forward | Reverse |
|---|---|---|
| CD133 | GCACTCTATACCAAAGCGTCAAGA | TCCTAGTTACTCTCTCCAACAATCCA |
| CD166 | GCCGACTTGACGTACCTCAGA | GCCATCGGGCTTTTCATATTT |
| CD24 | TCCAACTAATGCCACCACCAA | GACCACGAAGAGACTGGCTGTT |
| CD44 | ACCTGCCCAATGCCTTTG | GACATAGCGGGTGCCATCAC |
| β‐Actin | GGTCATCACCATTGGCAATGAG | TACAGGTCTTTGCGGATGTCC |
2.10. Fluorescence‐activated cell sorting analysis and cell sorting
Cells were harvested and dissociated as previously described16, 17 using Accutase cell detachment solution (Merck Millipore). Dissociated single cells were incubated with rabbit polyclonal anti‐human CD133 (ab19898; Abcam) diluted in FACS buffer (0.5% [w/v] BSA and 0.1% [w/v] sodium azide in PBS) for 30 minutes on ice. Cell suspensions were then washed and incubated with Alexa Fluor 488‐conjugated secondary antibody (Molecular Probes) diluted in FACS buffer for 30 minutes on ice. Cells incubated with secondary antibody only served as negative controls. Cells were sorted using a FACSAria Cell Sorter (Becton Dickinson) and mean fluorescence intensities (MFI) were calculated by subtracting the intensity of the negative controls.
2.11. Transmission electron microscopy
Colon tumor tissues and spheres produced by SS‐2 cells were fixed with 2.5% glutaraldehyde in 0.1 mol/L phosphate buffer (pH 7.4), and then post‐fixed for 1 hour with 2% OsO4 dissolved in distilled water. The samples were then dehydrated using an ethanol gradient, and embedded in Epon. Ultrathin sections were generated using an ultramicrotome and stained with uranyl acetate and lead citrate. Each section was examined with a transmission electron microscope (TEM, H‐7500; Hitachi High‐Technologies).
2.12. Drug resistance assays
Cells (3.0 × 10³/well) were plated in 96‐well plates with growth medium. Each anticancer drug was given at the indicated concentration after 1 day and cell growth rates were measured by ATP assays after 4 days using the CellTiter‐Glo 2.0 Assay (Promega) according to the manufacturer’s protocol. Cell viability was calculated as the percentage of luminescent cells in drug‐treated wells relative to non‐treated control wells.
2.13. Statistical analyses
Data were statistically analyzed using Easy R (EZR; Saitama Medical Center, Jichi Medical University), which is a graphical interface for determination of R (The R Foundation for Statistical Computing), and is a modified version of R Commander designed to add functions frequently used in biostatistics.18 Continuous variables were analyzed using Student’s t tests. Values with P < .05 were considered statistically significant.
3. RESULTS
3.1. Characteristics of NEC in the ascending colon
Histological findings of cells derived from the resected ascending colon tumor showed solid proliferation without gland‐like structures or keratinization present. Moreover, the tumor cells had round to oval nuclei with high nuclear‐cytoplasmic (N/C) ratios (Figure 1A and inset panel). Ki‐67 labeling index was determined to be 65% in the preoperative biopsy specimens (Figure 1B inset) and >20% in the surgically resected tumor tissues (Figure 1B). We next sought to establish a differential diagnosis for the tumor by immunohistochemical analysis. Results showed that tumor cells stained positive for CgA (Figure 1C) and synaptophysin (Figure 1D). Furthermore, TEM analysis showed a large number of neuroendocrine granules (80‐200 nm in diameter) in the cytoplasm of the tumor cells (Figure 2A). Desmosomes were also observed at the tumor cell membrane (Figure 2B, arrows). This tumor was, therefore, diagnosed as NEC rather than poorly differentiated adenocarcinoma or medullary carcinoma.
Figure 1.
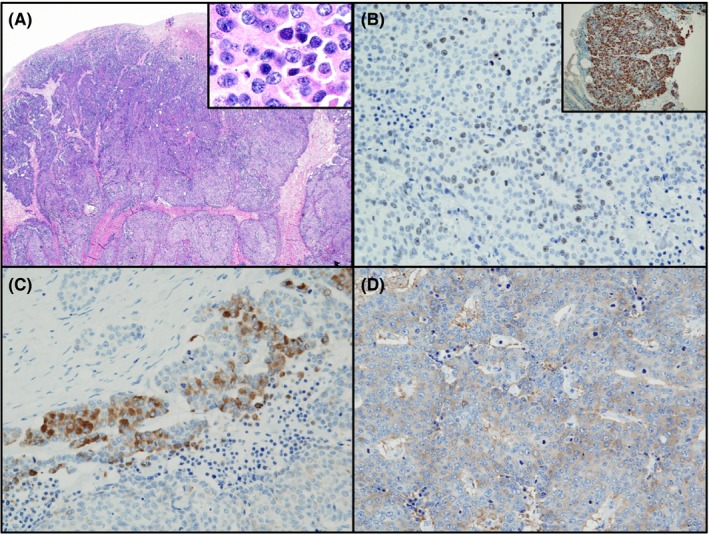
Histological and immunohistochemical features of neuroendocrine carcinoma (NEC) in ascending colon. A, H&E staining shows that solid NEC have a high nuclear‐cytoplasmic ratio. B, Immunohistochemical staining shows that the nuclei of NEC stained positively for Ki‐67 in biopsy specimens (inset) and resected colon tissues. NEC stained positive for chromogranin A (C) and synaptophysin (D). Magnification: A, ×40; A inset, ×400; B, ×200; B inset, ×100; C and D, ×200
Figure 2.
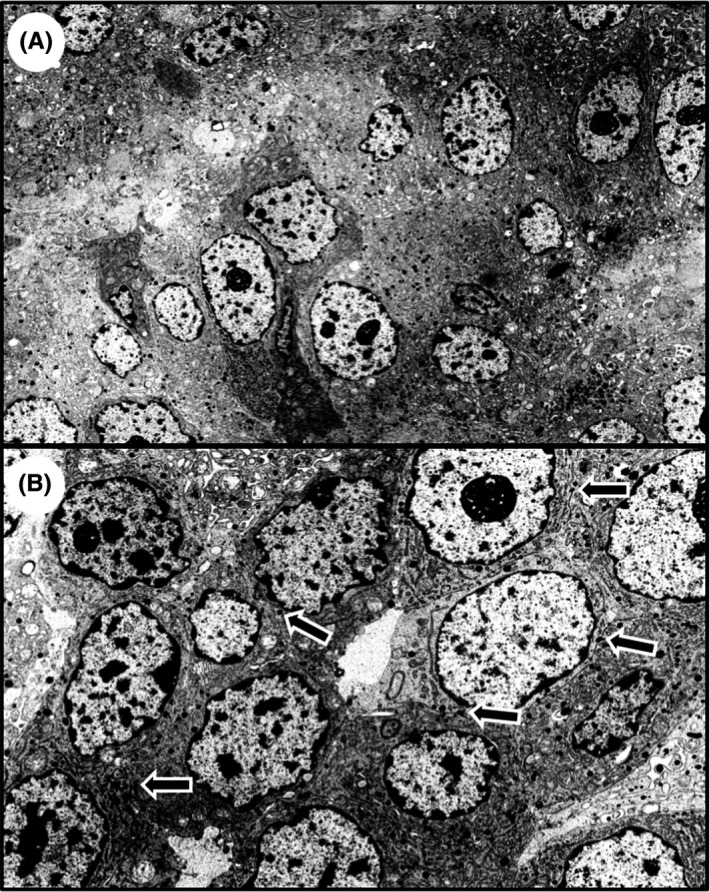
Transmission electron microscopic (TEM) analysis of neuroendocrine carcinoma in ascending colon. TEM analysis shows neuroendocrine granules in the cytoplasm of the tumor cells (A), and desmosomes were observed at the tumor cell membrane (B, arrows). Magnification: A, ×4000; B, ×7000
3.2. Establishment of the NEC cell line, SS‐2
The novel NEC cell line derived from the NEC tumor in the ascending colon appeared histologically to contain small, round cells that were in direct contact with each other and that showed high N/C ratios (Figure 3A, 3). Additionally, the cells stained positive for CgA and synaptophysin (Figure 3C, 3, respectively). Through TEM analysis we also observed that neuroendocrine granules (Figure 3E) and desmosomes (arrows) were present in the cells. These findings show that the cells maintained morphological and immunohistochemical features associated with NEC, thus confirming that they were NEC cells derived from the ascending colon. That the SS‐2 cells originated from a human female was confirmed by amelogenin analysis. We subsequently named the newly defined cell line SS‐2. Table 2 describes the major features of this cell line including STR analysis.
Figure 3.
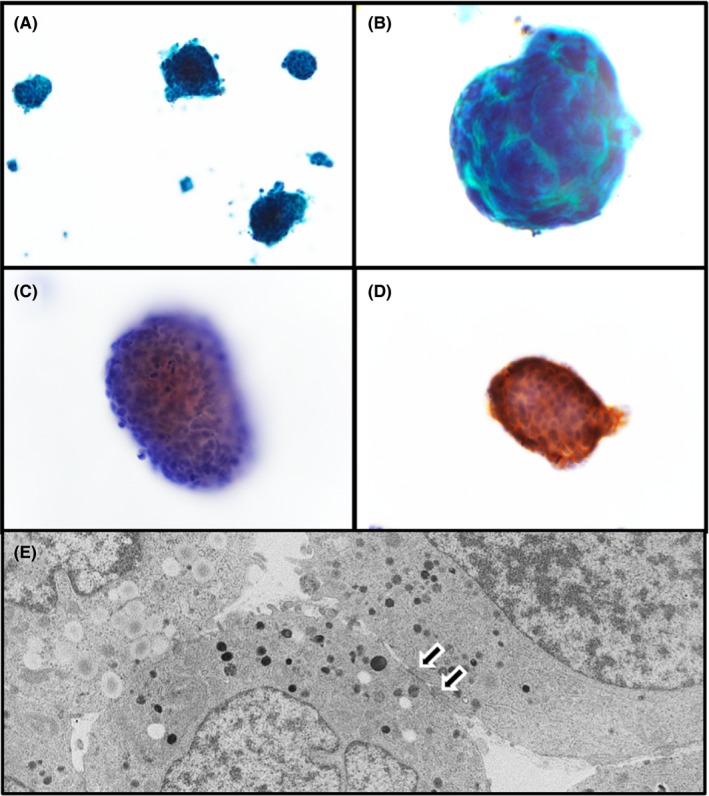
SS‐2 cell line derived from neuroendocrine carcinoma resected from ascending colon tumor. A,B, Papanicolaou staining shows that SS‐2 round to oval cells form small colonies. Immunohistochemical staining shows that SS‐2 cells were positive for chromogranin A (C) and synaptophysin (D). E, Transmission electron microscopic shows neuroendocrine granules and desmosomes (arrows). Magnification: A, ×200; B, C, and D, ×400; E, ×4000
Table 2.
Characteristics of SS‐2 cells
| General feature | Human cell line derived from ascending colon neuroendocrine carcinoma |
|---|---|
| Animal | Human |
| Genus | Homo |
| Species | sapiens |
| Gender | Female |
| Age at sampling | 59 y |
| Tissue derived | Ascending colon |
| Case history | Neuroendocrine carcinoma |
| STR locus | |
| TH01 | 8, 9 |
| D21S11 | 30 |
| D5S818 | 9, 12 |
| D13S317 | 8 |
| D7S820 | 10, 11 |
| D16S539 | 10, 11 |
| CSF1PO | 13 |
| vWA | 17, 18 |
| TPOX | 11 |
| Amelogenin locus | X |
CSF1PO, human c‐fms proto‐oncogene for CSF‐1 receptor gene; STR, short tandem repeat; TPOX, intron 10 of the human thyroid peroxidase gene; vWA, intron 40 of the von Willebrand factor.
3.3. Heterotopic transplantation of SS‐2 into nude mice
We assessed tumorigenicity by s.c. injecting SS‐2 cells into the flanks of Balb/c nude mice. The SS‐2 cells were observed to form solid tumors consisting of small, round cells that had histological features similar to those of the original NEC tissues obtained from the ascending colon tumor (Figure 4A). These cells were negative for CgA and stained weakly for synaptophysin (Figure 4B, 4, insets). Furthermore, the Ki‐67 labeling index of the tumor cells was determined to be ~100%, but the stromal cells, including lymphocytes, were negative for Ki‐67 (Figure 4D, inset).
Figure 4.
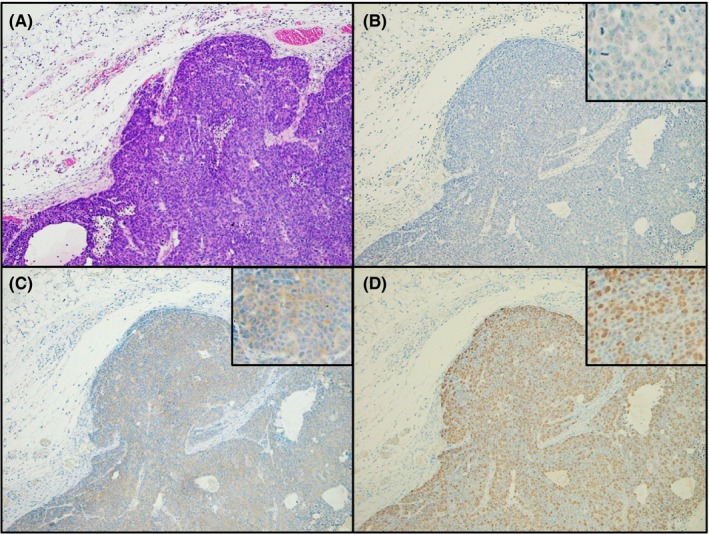
Heterotopic implantation of SS‐2 cells into Balb/c nude mice. A, H&E staining shows that after s.c. implantation into nude mice, SS‐2 cells proliferated and invaded adjacent tissues while showing solid features. Immunohistochemical analysis showed that the resulting tumor cells from the mice were negative for chromogranin A (B) and weakly positive for synaptophysin (C). D, Ki‐67 labeling index of the tumor cells was found to be approximately 100%. Magnification: A‐D, ×100; insets, × 400
3.4. SS‐2 cells express INSM‐1
INSM‐1 regulates the expression of neuroendocrine markers, such as CgA and synaptophysin.19 INSM‐1 was localized in the nuclei of surgically resected tumors (Figure 5A). A single band of ~58 kDa, the expected size of INSM‐1, was detected by western blotting of SS‐2 lysates (Figure 5B) and in nuclei of the established SS‐2 cells (Figure 5C). Two different siRNAs targeting INSM‐1 decreased INSM‐1 mRNA levels but did not affect the levels of CgA and synaptophysin mRNAs (Figure 5D).
Figure 5.
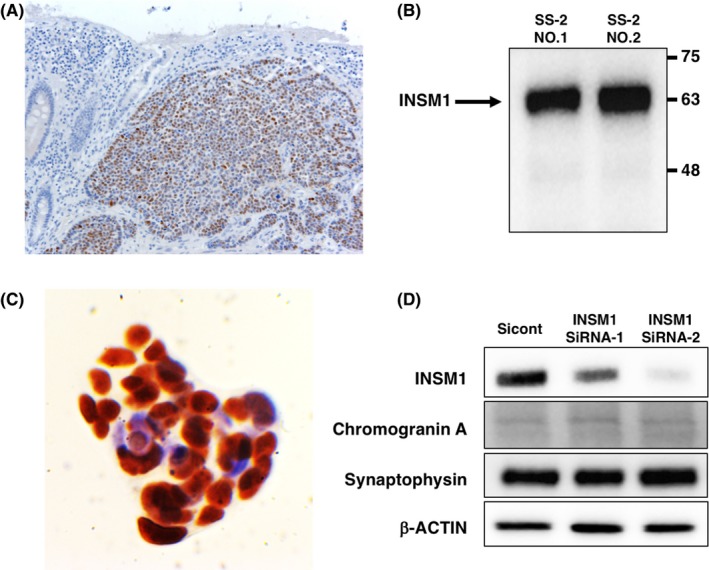
Expression of INSM1 in resected neuroendocrine carcinoma (NEC) tissues and SS‐2 cells. A, Localization of INSM‐1 in the surgically resected NEC tumors. B, A single band corresponding to INSM‐1 was detected in SS‐2 cells. C, INSM‐1 was detected in nuclei of SS‐2 cells. D, Targeting of INSM‐1 did not affect the levels of chromogranin A and synaptophysin mRNAs. Magnification: A, ×200; C, ×600. Numbers 1 and 2 indicate samples derived from two independently harvested SS‐2 cells
3.5. Ability of SS‐2 cells to form spheres and express CSC markers
We analyzed the ability of SS‐2 cells to form spheres in ultra‐low attachment plates to confirm the presence of characteristic CSC markers. The SS‐2 cells were observed to form round to oval colonies under adherent culturing conditions (Figure 6A, inset), whereas floating, grape‐like spheres were formed in the ultra‐low attachment plates. These results suggest that the spheres contained CSC markers (Figure 6B, inset). Moreover, the floating spheres from SS‐2 cells expressed higher levels of CD133 mRNA (P < .05), which is a CSC marker, compared to the same cells cultured under adherent conditions (Figure 7A). Conversely, the expression levels of CD166 (P = .26), CD24 (P = .46) and CD44 (P = .73) mRNA were not significantly different between spherical and adherent SS‐2 cells. Further, FACS analysis confirmed the higher expression of CD133 in floating spheres compared to adherent cells (Figure 7B). Sphere formation was also found to significantly impact the expression of CD24 and CD44 mRNA in conventional colon cancer cell lines such as HT‐29‐Luc and Caco‐2 cells, (Figure 7A). In contrast, CD133 mRNA expression did not significantly differ between spherical and adherent cells in these alternative cell lines.
Figure 6.
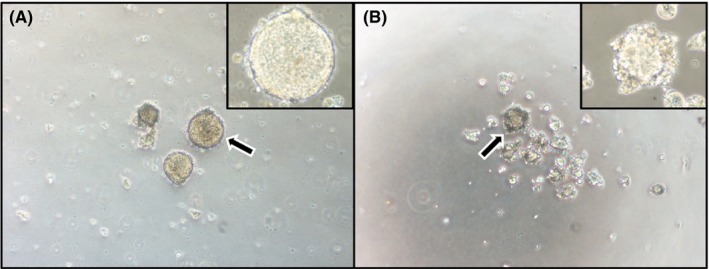
SS‐2 under adherent and non‐adherent culture conditions. A, Under adherent culture conditions, SS‐2 cells form round to oval colonies when cultured on smooth surfaces. B, After culturing in ultra‐low attachment plates for 7 d, SS‐2 cells formed floating spherical colonies with grape‐like configuration. Arrows denote the area magnified in insets. Magnification: A and B, ×100; insets, ×400
Figure 7.
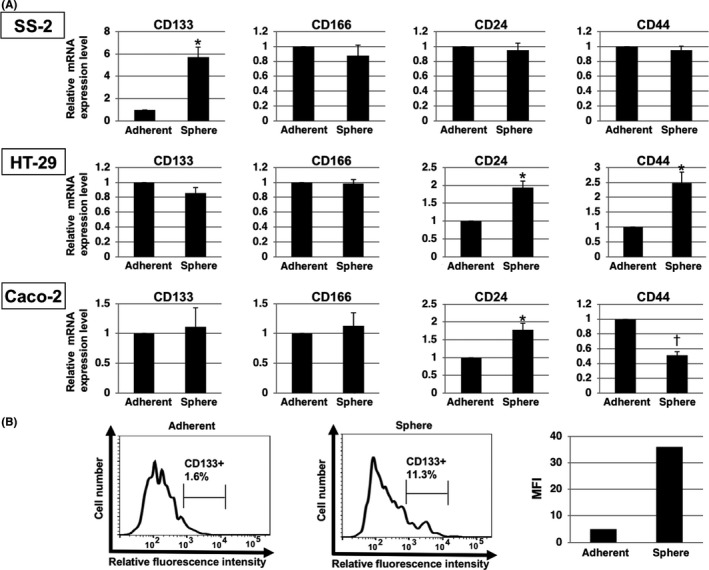
Expression of cancer stem cell (CSC) markers in SS‐2 spheres. A, Findings from qRT‐PCR analysis show that spheres formed by SS‐2 cells expressed higher levels of CD133 compared to cells cultured in adherent conditions. Expression of CD166, CD24 and CD44 mRNA did not differ significantly between the spheres and adherent SS‐2 cells. *P < .05, † P < .01. B, Expression of CD133 in SS‐2 cells as determined by flow cytometric analysis. More CD133+ cells were evident among spheres compared to cells cultured in adherent conditions. Representative results are shown. Gating strategy represents CD133+ cells. Right panel shows CD133 expression as mean fluorescence intensity (MFI)
3.6. Susceptibility of SS‐2 cells to anticancer drugs
To compare the effect of commonly used anticolorectal cancer drugs to SS‐2 cells and conventional colorectal cancer cells, we carried out cell viability assays. After the addition of oxaliplatin and fluorouracil (5‐FU), cell viabilities were higher in SS‐2 cells than in Caco‐2 cells, except for in 100 μmol/L oxaliplatin (Figure 8).
Figure 8.
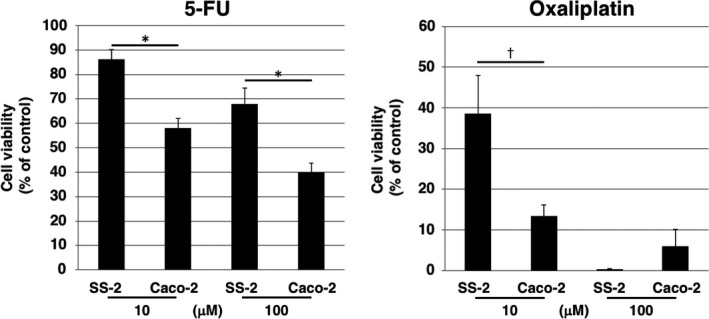
Dose responses (10 or 100 μmol/L) of SS‐2 and Caco‐2 cells to oxaliplatin and fluorouracil (5‐FU) were determined using an ATP assay. *P < .05, † P < .01
4. DISCUSSION
Most NEC originates anywhere in the gastrointestinal tract from the stomach to the rectum. In Japan, frequencies of midgut, foregut and hindgut NET, are 3.6%, 26.1% and 70.3%, respectively,2 with reports from Taiwan,20 China21 and Korea22 indicating similar frequencies of midgut NET. In contrast, in other non‐Asian countries, the frequency of midgut NET ranges from 30% to 60%.1, 3 The disproportionately high frequency of hindgut NET diagnosed in Japan may be associated, in part, with the early detection methods established for rectal NET (formerly designated carcinoid) through colonoscopy screening. Further, ethnic differences may contribute to this abundance of rectal NET compared to that diagnosed in the midgut and foregut. Novel therapeutic options are urgently required for patients with NEC due to its aggressive reproductive rate, high metastatic capacity, resistance to chemoradiotherapy and increasing global incidence.
Neuroendocrine carcinoma tumors show high proliferative capacities, with a median Ki‐67 labeling index of 80%.23 In our study patient, the NEC originated from the midgut (ascending colon) and the Ki‐67 labeling index was determined to be 20%‐100% in the preoperative biopsy, resected tumor tissues, and in tumors that were implanted into nude mice.
In addition, the reported ratios for distant metastasis in NEC, NET G1/G2 and midgut NEC are 32.3%, 2.7%, and 28.6%, respectively.2 Currently, somatostatin receptor analogues octreotide and lanreotide are used to treat NET G1, whereas well‐differentiated NET (NET G1/G2) in the pancreas is treated with streptozotocin (STZ) and 5‐FU, or temozolomide (TEM) and capecitabine (CAP), or everolimus and sunitinib.3 Treatment with everolimus, specifically, has been associated with significant improvement in progression‐free survival (PFS) of patients with progressive lung or gastrointestinal NET.24 Moreover, the findings of a recent phase III trial reported that peptide receptor radionuclide therapy (PRRT) using 177Lu‐Dotatate is effective in midgut NET.25
A common regimen for treatment of primary NEC G3 consists of cisplatin with etoposide.3 Alternatively, platinum‐based chemotherapy drugs are proven to be effective against NEC, yet of limited value against NET G3.23 In our experiments, oxaliplatin and 5‐FU were not effective against SS‐2 cells relative to Caco‐2 in vitro. As our SS‐2 cell line maintained high proliferative capacity, as well as the characteristic immunohistochemical features associated with the original tumor following transplantation into nude mice, it has the potential to be effectively used to study not only NEC growth, invasiveness and metastatic mechanisms but also the effects of these anti‐NEC drugs in vivo. To better understand malignant potential and drug resistance, further studies involving the orthotopic implantation of SS‐2 cells should be carried out in the near future. In addition, patient‐derived xenografts (PDX) may be effective for clarification of the biological action of NEC and the effectiveness of anticancer drugs.
Within CSC of NET, the SRC, ERK, AKT, and mTOR pathways are upregulated; thus, anti‐SRC therapy has been shown to reduce tumor size in vivo.26 Furthermore, Nanog, OCT4, SOX‐2, LGR5, CD133, CD24, CD29, ALDH1, ESA/EpCAM, CD44, CD166, and CD26 are the primary CSC markers associated with conventional colorectal cancer.27, 28 The present study found that SS‐2 cells form spheres that express high levels of specific CSC markers, suggesting that this cell line expresses certain features of spheres, including pluripotency, self‐regeneration, and tumorigenicity. These functions contribute to the initiation and metastasis of cancers and participate in generating resistance to chemotherapy and radiation.29, 30 Spheres generated in cultures of SS‐2 cells were found to express high levels of CD133. Moreover, CD166, CD24, and CD44 were not differently expressed between spheres produced by NEC compared to conventional colorectal cancers. These results suggest that CD133 is one of specific CSC markers of SS‐2 cells. As CSC are considered to be novel therapeutic targets for cancers,31 combination therapy consisting of chemotherapy together with anti‐CSC therapy may be effective against NEC.
In conclusion, few NEC cell lines have been established because of scant clinical cases and difficulties associated with preoperative diagnosis of histologically solid tumors in the colorectum. Herein, we described the establishment of a novel NEC cell line derived from a tumor in the ascending colon of a female Japanese patient. The SS‐2 cell line in vitro retained the high proliferative capacity and immunohistochemical features of the original NEC tumor in vivo after being given s.c. into nude mice. We will be depositing this cell line into the cell bank of RIKEN BioResource Research Center, and believe that the SS‐2 line will assist in the characterization of colorectal NEC cells while also serving as a platform for the testing of candidate anti‐NEC drugs.
DISCLOSURE
Authors declare no conflicts of interest for this article.
ACKNOWLEDGMENTS
This study was supported by a Grant‐in‐Aid for Young Scientists (B, grant No. 24791450) from the Japan Society for the Promotion of Science (JSPS) awarded to S. Shinji. It was also supported in part by JSPS KAKENHI (grant numbers 16K10613 and 19K09207 to T. Ishiwata; 16K08263 and 19K11759 to N. Sasaki) through Grant‐in‐Aid for Scientific Research (C) awarded.
Shinji S, Sasaki N, Yamada T, et al. Establishment and characterization of a novel neuroendocrine carcinoma cell line derived from a human ascending colon tumor. Cancer Sci. 2019;110:3708–3717. 10.1111/cas.14221
REFERENCES
- 1. Yao JC, Hassan M, Phan A, et al. One hundred years after "carcinoid": epidemiology of and prognostic factors for neuroendocrine tumors in 35,825 cases in the United States. J Clin Oncol. 2008;26:3063‐3072. [DOI] [PubMed] [Google Scholar]
- 2. Ito T, Igarashi H, Nakamura K, et al. Epidemiological trends of pancreatic and gastrointestinal neuroendocrine tumors in Japan: a nationwide survey analysis. J Gastroenterol. 2015;50:58‐64. [DOI] [PubMed] [Google Scholar]
- 3. Pavel M, Baudin E, Couvelard A, et al. ENETS Consensus Guidelines for the management of patients with liver and other distant metastases from neuroendocrine neoplasms of foregut, midgut, hindgut, and unknown primary. Neuroendocrinology. 2012;95:157‐176. [DOI] [PubMed] [Google Scholar]
- 4. Rindi G, Arnold R, Bosman FT, et al. WHO Classification of Tumours of the Digestive System , 4th edn. Geneva, Switzerland: WHO Press; 2010. [Google Scholar]
- 5. Kimstra D, Klöppel G, La RS, Rindi G Classification of Neuroendocrine Neoplasms of the Digestive System. Lyon, France: World Health Organization; 2019. [Google Scholar]
- 6. Velayoudom‐Cephise FL, Duvillard P, Foucan L, et al. Are G3 ENETS neuroendocrine neoplasms heterogeneous? Endocr Relat Cancer. 2013;20:649‐657. [DOI] [PubMed] [Google Scholar]
- 7. Basturk O, Tang L, Hruban RH, et al. Poorly differentiated neuroendocrine carcinomas of the pancreas: a clinicopathologic analysis of 44 cases. Am J Surg Pathol. 2014;38:437‐447. [DOI] [PMC free article] [PubMed] [Google Scholar]
- 8. Dasari A, Shen C, Halperin D, et al. Trends in the incidence, prevalence, and survival outcomes in patients with neuroendocrine tumors in the United States. JAMA Oncol. 2017;3:1335‐1342. [DOI] [PMC free article] [PubMed] [Google Scholar]
- 9. Shinji S, Naito Z, Ishiwata T, et al. Neuroendocrine cell differentiation of poorly differentiated colorectal adenocarcinoma correlates with liver metastasis. Int J Oncol. 2006;29:357‐364. [PubMed] [Google Scholar]
- 10. Arai T, Esaki Y, Sawabe M, Honma N, Nakamura K, Takubo K. Hypermethylation of the hMLH1 promoter with absent hMLH1 expression in medullary‐type poorly differentiated colorectal adenocarcinoma in the elderly. Mod Pathol. 2004;17:172‐179. [DOI] [PubMed] [Google Scholar]
- 11. Gock M, Mullins CS, Harnack C, et al. Establishment, functional and genetic characterization of a colon derived large cell neuroendocrine carcinoma cell line. World J Gastroenterol. 2018;24:3749‐3759. [DOI] [PMC free article] [PubMed] [Google Scholar]
- 12. Reid MD, Bagci P, Ohike N, et al. Calculation of the Ki67 index in pancreatic neuroendocrine tumors: a comparative analysis of four counting methodologies. Mod Pathol. 2015;28:686‐694. [DOI] [PMC free article] [PubMed] [Google Scholar]
- 13. Akintola‐Ogunremi O, Pfeifer JD, Tan BR, et al. Analysis of protein expression and gene mutation of c‐kit in colorectal neuroendocrine carcinomas. Am J Surg Pathol. 2003;27:1551‐1558. [DOI] [PubMed] [Google Scholar]
- 14. Narita K, Matsuda Y, Seike M, Naito Z, Gemma A, Ishiwata T. Nestin regulates proliferation, migration, invasion and stemness of lung adenocarcinoma. Int J Oncol. 2014;44:1118‐1130. [DOI] [PubMed] [Google Scholar]
- 15. Matsuda Y, Yoshimura H, Ueda J, Naito Z, Korc M, Ishiwata T. Nestin delineates pancreatic cancer stem cells in metastatic foci of NOD/Shi‐scid IL2Rgamma(null) (NOG) mice. Am J Pathol. 2014;184:674‐685. [DOI] [PMC free article] [PubMed] [Google Scholar]
- 16. Sasaki N, Itakura Y, Toyoda M. Ganglioside GM1 contributes to the state of insulin resistance in senescent human arterial endothelial cells. J Biol Chem. 2015;290:25475‐25486. [DOI] [PMC free article] [PubMed] [Google Scholar]
- 17. Sasaki N, Itakura Y, Toyoda M. Sialylation regulates myofibroblast differentiation of human skin fibroblasts. Stem Cell Res Ther. 2017;8:81. [DOI] [PMC free article] [PubMed] [Google Scholar]
- 18. Kanda Y. Investigation of the freely available easy‐to‐use software 'EZR' for medical statistics. Bone Marrow Transplant. 2013;48:452‐458. [DOI] [PMC free article] [PubMed] [Google Scholar]
- 19. Fujino K, Motooka Y, Hassan WA, et al. Insulinoma‐associated protein 1 is a crucial regulator of neuroendocrine differentiation in lung cancer. Am J Pathol. 2015;185:3164‐3177. [DOI] [PubMed] [Google Scholar]
- 20. Tsai HJ, Wu CC, Tsai CR, Lin SF, Chen LT, Chang JS. The epidemiology of neuroendocrine tumors in Taiwan: a nation‐wide cancer registry‐based study. PLoS ONE. 2013;8:e62487. [DOI] [PMC free article] [PubMed] [Google Scholar]
- 21. Wang YH, Lin Y, Xue L, Wang JH, Chen MH, Chen J. Relationship between clinical characteristics and survival of gastroenteropancreatic neuroendocrine neoplasms: A single‐institution analysis (1995–2012) in South China. BMC Endocr Disord. 2012;12:30. [DOI] [PMC free article] [PubMed] [Google Scholar]
- 22. Gastrointestinal Pathology Study Group of Korean Society of Pathologists , Cho M‐Y, Kim JM, et al. Current trends of the incidence and pathological diagnosis of gastroenteropancreatic neuroendocrine tumors (GEP‐NETs) in Korea 2000–2009: Multicenter study. Cancer Res Treat. 2012;44:157‐165. [DOI] [PMC free article] [PubMed] [Google Scholar]
- 23. Heetfeld M, Chougnet CN, Olsen IH, et al. Characteristics and treatment of patients with G3 gastroenteropancreatic neuroendocrine neoplasms. Endocr Relat Cancer. 2015;22:657‐664. [DOI] [PubMed] [Google Scholar]
- 24. Yao JC, Fazio N, Singh S, et al. Everolimus for the treatment of advanced, non‐functional neuroendocrine tumours of the lung or gastrointestinal tract (RADIANT‐4): a randomised, placebo‐controlled, phase 3 study. Lancet. 2016;387:968‐977. [DOI] [PMC free article] [PubMed] [Google Scholar]
- 25. Strosberg J, El‐Haddad G, Wolin E, et al. Phase 3 trial of 177Lu‐dotatate for midgut neuroendocrine tumors. N Engl J Med. 2017;376:125‐135. [DOI] [PMC free article] [PubMed] [Google Scholar]
- 26. Gaur P, Sceusi EL, Samuel S, et al. Identification of cancer stem cells in human gastrointestinal carcinoid and neuroendocrine tumors. Gastroenterology. 2011;141:1728‐1737. [DOI] [PMC free article] [PubMed] [Google Scholar]
- 27. Wahab SMR, Islam F, Gopalan V, Lam AK. The identifications and clinical implications of cancer stem cells in colorectal cancer. Clin Colorectal Cancer. 2017;16:93‐102. [DOI] [PubMed] [Google Scholar]
- 28. Haraguchi N, Ishii H, Mimori K, et al. CD49f‐positive cell population efficiently enriches colon cancer‐initiating cells. Int J Oncol. 2013;43:425‐430. [DOI] [PubMed] [Google Scholar]
- 29. Clarke MF, Dick JE, Dirks PB, et al. Cancer stem cells–perspectives on current status and future directions: AACR Workshop on cancer stem cells. Cancer Res. 2006;66:9339‐9344. [DOI] [PubMed] [Google Scholar]
- 30. Ishiwata T. Cancer stem cells and epithelial‐mesenchymal transition: Novel therapeutic targets for cancer. Pathol Int. 2016;66:601‐608. [DOI] [PubMed] [Google Scholar]
- 31. Medema JP. Targeting the colorectal cancer stem cell. N Engl J Med. 2017;377:888‐890. [DOI] [PubMed] [Google Scholar]


