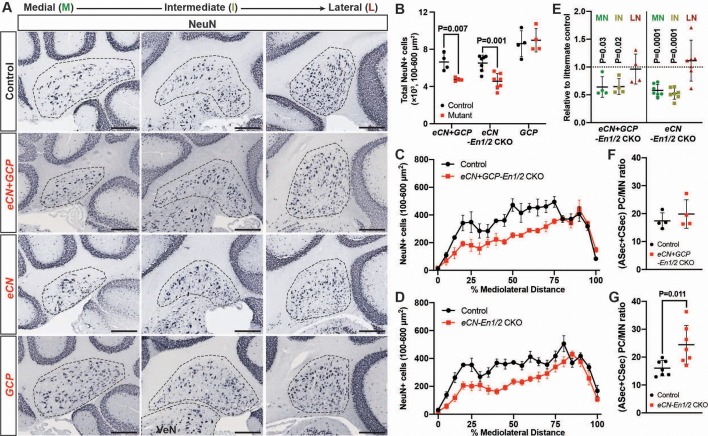
Figure 6. eCN numbers are reduced in eCN+GCP-En1/2 and eCN-En1/2 CKOs but not in GCP-En1/2 CKOs at P30.
(A) Representative immunohistochemistry for NeuN in all Dox regimens from midline (left) to lateral (right) cerebellum of P30 control and each of the cell specific En1/2 CKOs. (B) Quantification of NeuN+ cells that are 100–600 um2 (eCN size range) showing reduction in eCN+GCP- and eCN-En1/2 CKOs compared to controls, but not in GCP-En1/2 CKOs (Two-way ANOVA, F(1,24)=10.26, p=0.0038). (C,D) Mediolateral distribution of 100–600 um2 NeuN+ cells in eCN+GCP- and eCN-En1/2 CKO mutants showing a loss in medial and intermediate eCN compared to controls. eCN counts are plotted as bins of 5% percent of the mediolateral distance. (eCN+GCP-En1/2 CKO: Two-way ANOVA, F(1,120)=63.33, p=0.0001; eCN-En1/2 CKO: Two-way ANOVA, F(1,240)=104.4, p=0.0001) (E) Quantification of eCN in each nucleus of mutants relative to littermate controls (medial, MN; intermediate, IN; lateral, LN) showing a significant decrease in the MN and IN in eCN-En1/2 CKO (one-sample t-test per nucleus; MN: p=0.03, IN: p=0.02, LN: p=0.80) and eCN+GCP-En1/2 CKO mutants (one-sample t-test per nucleus; MN: p<0.0001, IN: p<0.001, LN: p=0.437). (F,G) Quantification of the ratio of PCs (from anterior and central sectors) to eCN in the medial nucleus in eCN+GCP- (F) and eCN-En1/2 CKOs (G), compared to the control littermates (Student’s t-test). Significant post hoc comparisons are shown in the figure. Scale bar = 250 μm. VeN = vestibular nuclei.


