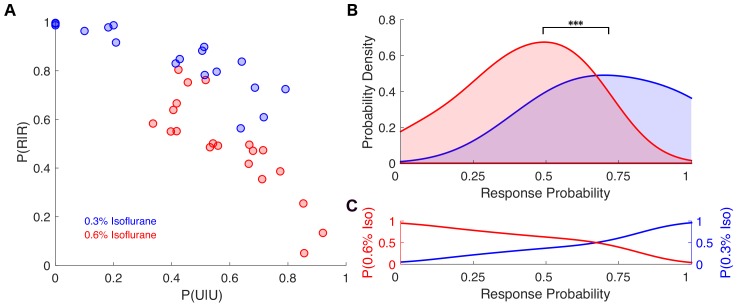
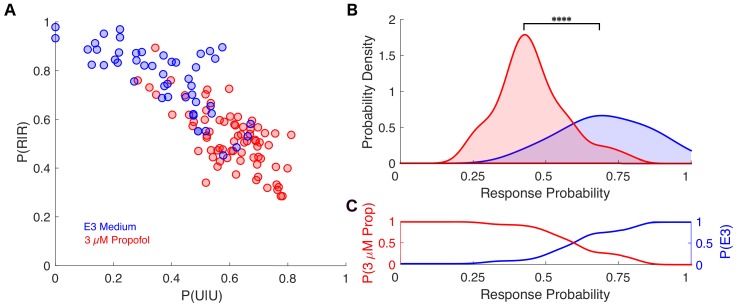
Figure 6. Individual response probabilities between different drug concentrations overlap at a population level.
(A) Individual empirically-estimated transition probability matrices are plotted in the plane spanned by P(U|U) and P(R|R) for animals exposed to 0.3% isoflurane (n = 18, blue dots) and 0.6% isoflurane (n = 20, red dots). (B) Probability density of the individual across-trial response probabilities were estimated for mice exposed to 0.3% isoflurane (blue) and 0.6% isoflurane (red). At the population level, distributions of responsiveness at the two isoflurane concentrations are significantly different (U = 54, n0.3% iso = 18, n0.6% iso = 20, p<0.001). Overlap of the two distributions was 57%. (C) Posterior distributions, representing the probability that a mouse with a given across-trial response probability was exposed to 0.3% (blue) isoflurane or 0.6% (red) isoflurane. Over a broad range of response probabilities, the odds of correctly identifying drug concentration on the basis of observed responsiveness is close to chance. Statistical significance is shown by ***p<0.001. Source data for response probability distributions described are available in the Figure 6—source data 1.


