. 2019 Nov 11;8:e48063. doi: 10.7554/eLife.48063

Figure 4. The double-adder model postulates that E. coli cell cycle is orchestrated by two independent adders, one for replication and one for division, reset at replication initiation.

Both adders (shown as coloured bars) start one copy per origin at replication initiation and accumulate in parallel for some time. After the division adder (green) has reached its threshold, the cell divides, and the initiation adder (orange) splits between the daughters. It keeps accumulating until it reaches its own threshold and initiates a new round of division and replication adders. Note that the double-adder model is illustrated here for the simpler case of slow growth.

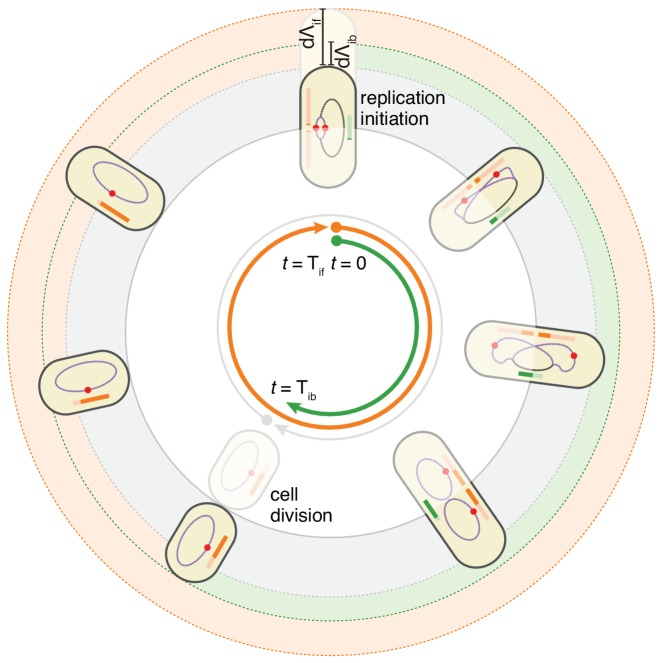
Figure 4.

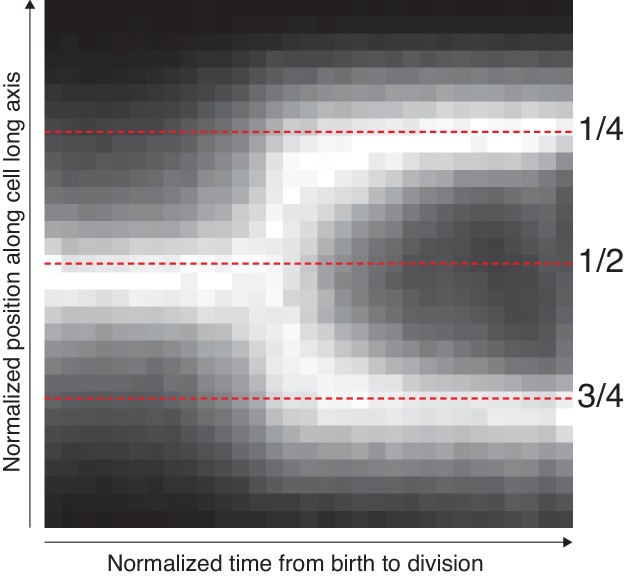
Figure 4—figure supplement 1. Average localization of the origin in cells growing in M9 glycerol.

Figure 4—figure supplement 1.

The position along the cell axis and the cell-cycle time of all detected spots were collected. The longitudinal position was scaled with cell length to indicate the relative position in the cell. The cell cycle time was normalized between 0 and 1. The figure shows these space-time data as a 2D histogram, where additionally each time point (column) has been normalized to have a maximum bin value of 1. The mid-cell and quarter-cell (mid-cell of daughter cell) positions are indicated with dotted lines.