. 2019 Nov 11;8:e48063. doi: 10.7554/eLife.48063

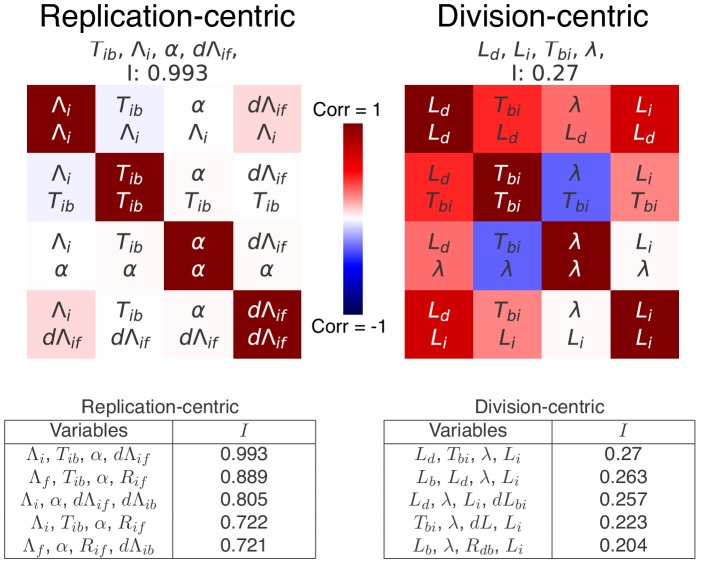
Figure 7. Decomposition analysis applied to the division and replication cycles.

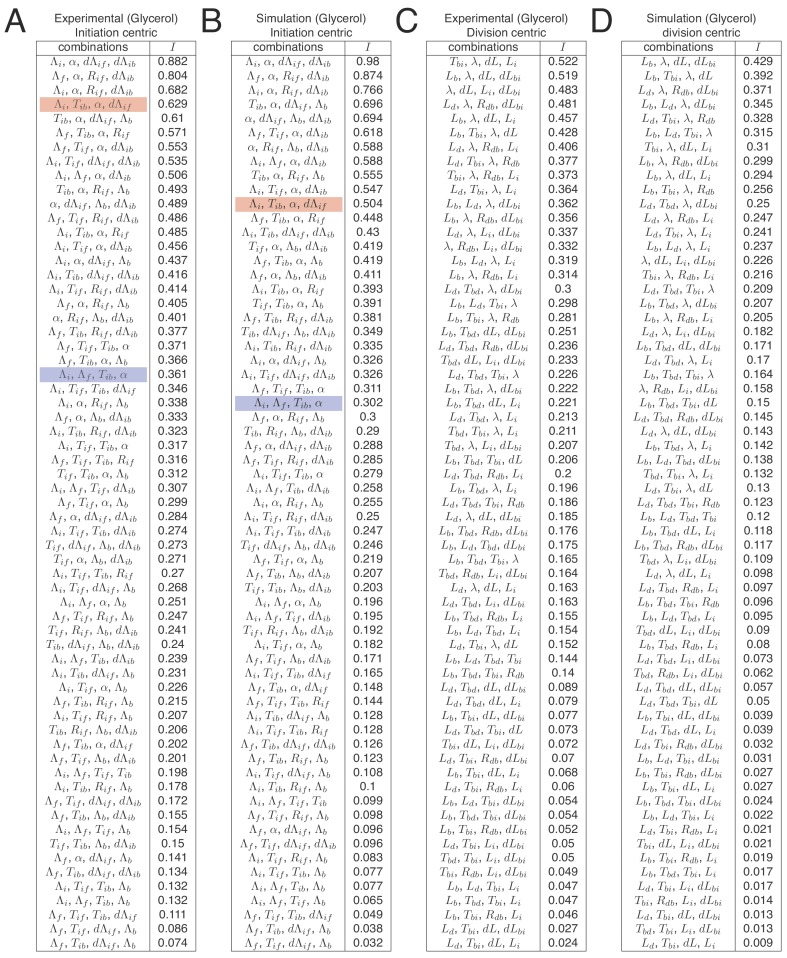
(A) The tables show the independence measures I for the top scoring decompositions of the division and replication cycles. In these tables, each line represents a possible decomposition and its independence I. As there are two ways to see the cell cycle (replication- and division-centric), we present decompositions for both replication- (left) and division-centric decompositions (right). In addition, we show the top decompositions both for the correlation matrices of the experimental data of the growth conditions M9+glycerol (automated analysis) and for the data from the simulations of the double-adder model (top and bottom rows, respectively). Results for the full list of decompositions can be found in Figure 7—figure supplement 3. Note that the decomposition analysis clearly identifies the replication-centric double-adder characterized by Λi, α, dΛif and dΛib as the best decomposition. The fact that the double-adder decomposition is also top scoring (with I1) for data from the simulation of the double-adder confirms that the decomposition analysis works as expected. (B) Correlation matrices for the best decompositions for replication-centric (left) and division-centric models (right). As in Figure 6A, each matrix represents one decomposition, and each element of the matrix shows the correlation of the two variables indicated within it. The level and sign of correlation is given by the color bar. As the lower left and upper right triangles of the matrices are redundant, we use them to show correlations from both experimental and simulation data in a single matrix. The lower-left corners bounded by a dotted line contain correlations from experimental data and the upper-right ones, bounded by a continuous line, from simulation data. The diagonal summarizes the set of variables. The best replication-centric model (left) has only weak correlations between its variables as reflected in high independence, while the best division-centric model has a few highly correlated variables leading to low independence.

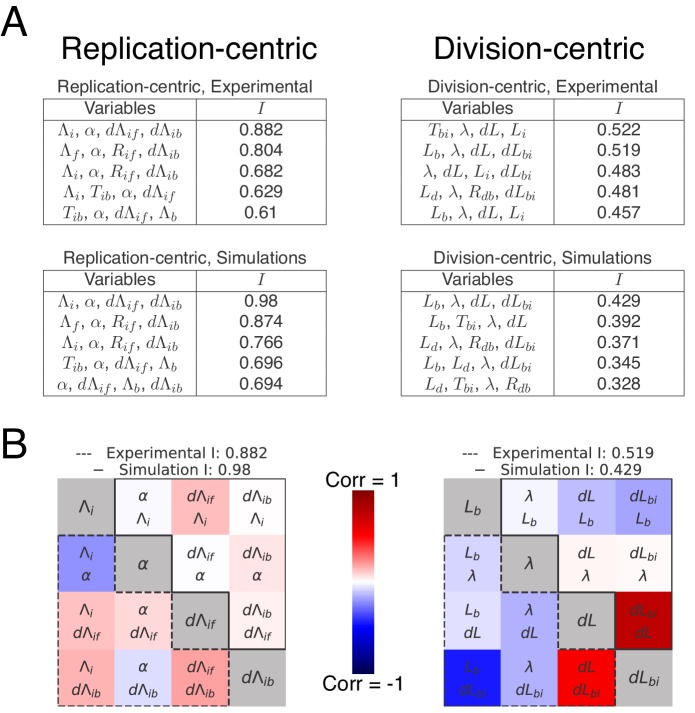
Figure 7—source data 1. Table with source data for replication-centric decompositions of both experimental and simulation data of Figure 7 and Figure 7—figure supplement 1Figure 7—figure supplement 2 and Figure 7—figure supplement 3.
Figure 7—source data 2. Table with source data for division-centric decompositions of both experimental and simulation data of Figure 7 and Figure 7—figure supplement 1Figure 7—figure supplement 2 and Figure 7—figure supplement 3.

Figure 7.

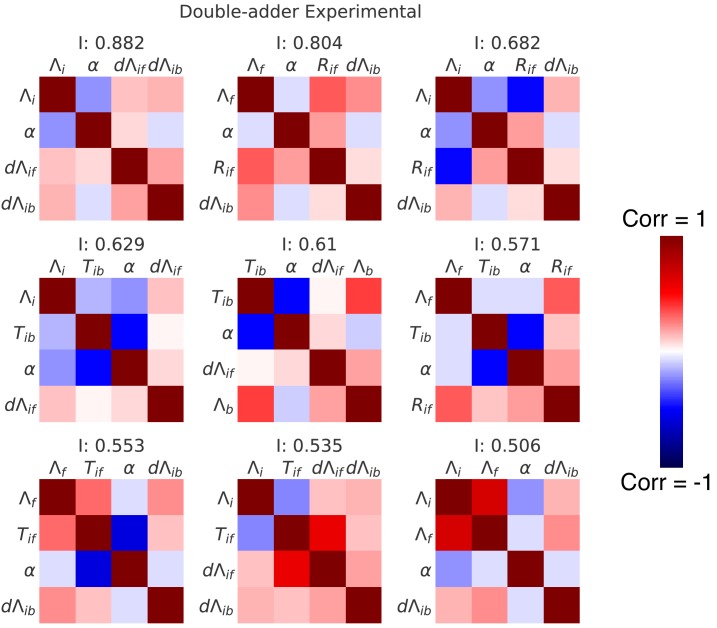
Figure 7—figure supplement 1. Correlation matrices for the top nine decompositions of the experimental data.

Figure 7—figure supplement 1.

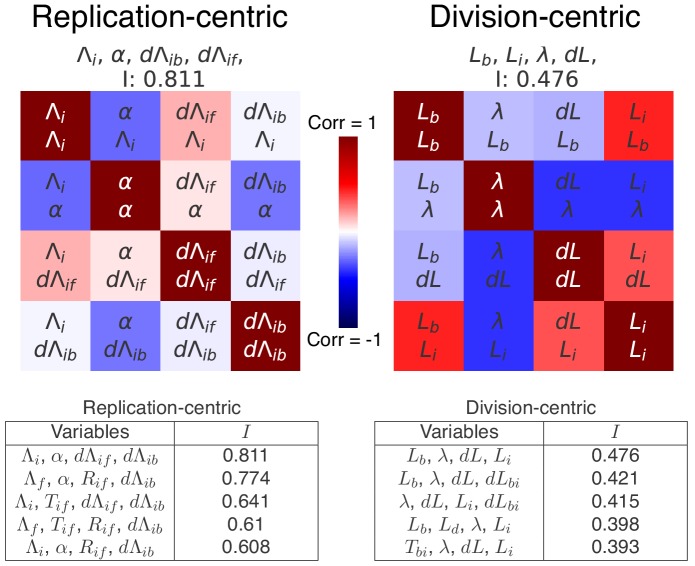
In complement to the best decomposition shown in Figure 7, we show here correlation matrices for the first nine best decompositions for the experimental data (M9+glycerol). Each matrix represents one decomposition, and each element of the matrix shows the correlation of the two variables indicated within it. The level and sign of the correlation is given by the color bar. The independence I is shown at the top of each correlation matrix.
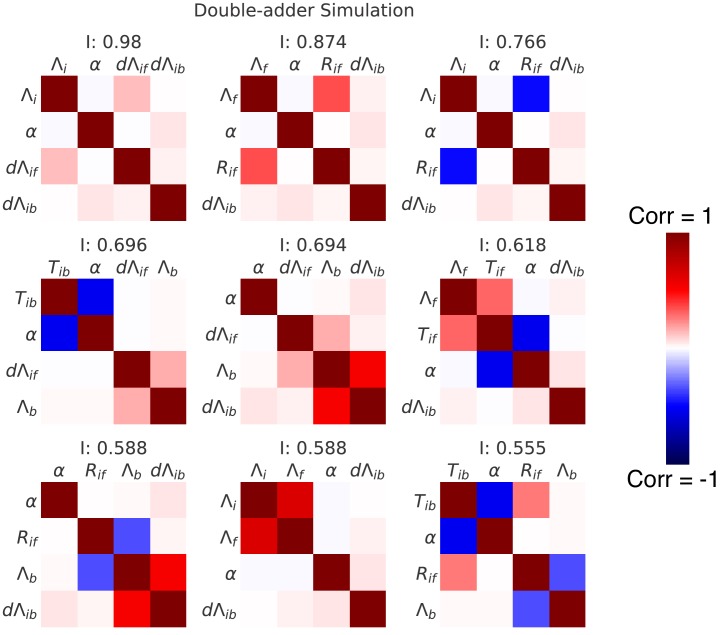
Figure 7—figure supplement 2. Correlation matrices for the top nine decompositions of the data from simulations of the double-adder model.

Figure 7—figure supplement 2.

In complement to the best decomposition shown in Figure 7, we show here correlation matrices for the first nine best decompositions for the data from the simulation of the double-adder model (with parameters from growth in M9+glycerol). Each matrix represents one decomposition, and each element of the matrix shows the correlation of the two variables indicated within it. The level and sign of the correlation is given by the color bar. The independence I is shown at the top of each correlation matrix.
Figure 7—figure supplement 3. Full list of independences I for all replication-centric and division-centric models.

Figure 7—figure supplement 3.

In Figure 7A we show tables indicating independence I for the five best decompositions of the M9+glycerol growth condition. Here, we show independences I for all possible decompositions for both experimental and simulation data and both replication- and division-centric views of the cell cycle. Each line in the table shows one possible decomposition and its associated independence I, and decompositions are ranked by decreasing I. The double-adder model (decomposition Λi, α, dΛif, dΛib) presented in this article has the best level of independence (top row in tables A and B). Some decompositions correspond to other previously proposed models. As an example, the Ho and Amir (2015) model based on an inter-initiation adder and a division timer is highlighted in red (decomposition Tib, α, dΛif, Λb), and the Wallden model based on a per origin initiation mass and a timer from initiation to division is highlighted in blue (decomposition Λi, Tib, α, dΛif).
Figure 7—figure supplement 4. Top scoring decompositions for data from simulations of an alternative model.

Figure 7—figure supplement 4.

We simulated a model regulated by a inter-initiation adder Λif and a initiation to division timer Tib, that is as proposed by Ho and Amir (2015), and applied our decomposition analysis to data from these simulations. We here show the correlation matrices of the best replication- and division-centric decompositions on this data. Each matrix represents one decomposition, and each element of the matrix shows the correlation of the two variables indicated within it. The level and sign of correlation is given by the color bar. The independence I of each decomposition is shown at the top of each matrix. In the tables, we also show the scores of the five best decompositions. Reassuringly, the decomposition corresponding to the variables used for the simulation (left) indeed comes out as top scoring, with an independence of I1, confirming the validity of our decomposition approach.
Figure 7—figure supplement 4—source data 1. Table with source data for replication-centric decompositions of Figure 7—figure supplement 4.
Figure 7—figure supplement 4—source data 2. Table with source data for division-centric decompositions of Figure 7—figure supplement 4.
Figure 7—figure supplement 5. Top scoring decompositions for data from Si et al. (2019).

Figure 7—figure supplement 5.

We performed the same decomposition analysis as the one used for our data in the main Figure 7 on a published dataset found in Si et al. (2019) for slow growth in a different strain and different growth medium (MG1655 in M9+acetate). We show here correlation matrices for the two best replication- and division-centric decompositions on this data. Each matrix represents one decomposition, and each element of the matrix shows the correlation of the two variables indicated within it. The level and sign of correlation is given by the color bar. The independence I of each decomposition is shown at the top of each matrix. In the tables, we also show the scores of the five best decompositions. Notably, in agreement with the results on our own data, the double-adder model (Λi, α, Λif, Λib) shows the best independence on this dataset as well.
Figure 7—figure supplement 5—source data 1. Table with source data for replication-centric decompositions of Figure 7—figure supplement 5.
Figure 7—figure supplement 5—source data 2. Table with source data for division-centric decompositions of Figure 7—figure supplement 5.