Abstract
Escherichia coli and Salmonella Enteritidis are foodborne pathogens forming challenging biofilms that contribute to their virulence, antimicrobial resistance, and survival on surfaces. Interspecies interactions occur between species in mixed biofilms promoting different outcomes to each species. Here we describe the interactions between E. coli and S. Enteritidis strains, and their control using specific phages. Single-species biofilms presented more cells compared to dual-species biofilms. The spatial organization of strains, observed by confocal microscopy, revealed similar arrangements in both single- and dual-species biofilms. The EPS matrix composition, assessed by Fourier-transform infrared spectroscopy, disclosed that the spectra extracted from the different dual-species biofilms can either be a combination of both species EPS matrix components or that the EPS matrix of one species predominates. Phages damaged more the single-species biofilms than the mixed biofilms, showing also that the killing efficacy was greatly dependent on the phage growth characteristics, bacterial growth parameters, and bacterial spatial distribution in biofilms. This combination of methodologies provides new knowledge of species-species and phage-host interactions in biofilms of these two major foodborne pathogens.
Subject terms: Biological techniques, Biotechnology, Ecology, Microbiology
Introduction
The presence of pathogenic and spoilage bacteria in food products is a known worldwide problem that not only leads to food spoilage but is linked to many foodborne outbreaks. In food industries, product contamination can occur at different food processing stages, via direct contamination and also cross-contamination1. Direct contamination of foods may occurs due to exposure to pathogens present in the soil, contaminated irrigation waters, and animals in the growing area2. Cross-contamination of the food products may be a result of moisture drops and aerosols, which indirectly contaminate working surfaces and products, due to contaminated washing waters, and improper handling of the products by the workers, for instance, due to poor hand sanitation3. E. coli and Salmonella are two major foodborne pathogens frequently isolated from varied surfaces, such as hard-to-reach areas that are not cleaned regularly (e.g. underside of conveyor belts, and pipelines)4, soil5,6, product washing waters7, and food products8. According to the US Centers for Disease Control and Prevention (CDC), these two species are responsible for millions of illnesses, 2,000 and 23,000 hospitalizations, and 60 and 450 deaths every year in the US alone, respectively9.
Both E. coli and Salmonella have been found in the form of biofilms attached to varied surfaces. There, these species, secrete extracellular polymeric substances (EPS) that maintain the cells together forming complex 3D structures consisting mainly of proteins, eDNA, and polysaccharides, among other components10. Biofilm cells tolerate high levels of antimicrobial agents which makes them extremely challenging to remove10. Although E. coli and Salmonella form single-species biofilms, they also coexist in multispecies communities on food processing surfaces or food products11. The interactions in dual-species biofilms can be positive, negative or neutral for each species12. Biofilms formed by E. coli and Salmonella displayed enhanced resistance to quaternary ammonium chloride (QAC)-based sanitizer (Vanquish, Total Solutions, WI, USA) that is a one-step concentrated cleaner, broad-spectrum disinfectant/virucide, sanitizer, with an application on a hard, non-porous surface. Resistance to QAC was due to the EPS produced by Salmonella, which conferred protection to both species4. The interaction between these two species in biofilms formed on HEp-2 cells showed that Salmonella biofilms outgrew and displaced pre-formed E. coli biofilms13. In another study, a specific strain of Salmonella unable to form biofilms utilized the curli proteins cross-seeded by E. coli to enhance its adherence to dual-species biofilms14.
Phages, the natural predators of bacteria, have been extensively employed in the control of single-species biofilms of common bacteria present in the food industry15–20. However, the application of phages to mixed bacterial populations is scarce but the results, reported to date, have been encouraging. For instance, phages successfully controlled dual-species biofilms of Staphylococcus lentus and Pseudomonas fluorescens, and further were able to decrease the number of the non-susceptible strain, when its specific phage was not added, through their release from the biofilm consortia21. Dual-species biofilms of Staphylococcus aureus and Staphylococcus epidermidis challenged with phages phiIPLA-RODI and phiIPLA-C1C in a cocktail also reduced significantly the number of attached cells22.
The focus of this work was to assess the influence of E. coli and S. Enteritidis strains on single- and dual-species biofilm formation, and also to investigate biofilm control using phages vB_EcoM_Daica (Daica) and φ135, specific for E. coli and S. Enteritidis, respectively.
Results
Characterization of E. coli and S. Enteritidis strains growth parameters
The constructed E. coli and S. Enteritidis strains carrying sfGFP- and mCherry-expression plasmids were characterized to determine their specific growth rates and doubling times (Table 1). The differences in EC 434 and EC 515 growth, and of SE Ex2 and SE 269 resulted in statistically different µmax values (p < 0.05) (Table 1). Furthermore, also the µmax between EC 515 and SE 269 was statistically significant (p < 0.05) with EC 515 presenting the slowest doubling time (td).
Table 1.
Specific growth rate (µmax) and doubling time (td) of the E. coli and S. Enteritidis strains used
| Strains | µmax ± SD (h−1) | td ± SD (min) |
|---|---|---|
| EC 434 | 0.763 ± 0.03* | 54.50 ± 2.44 |
| EC 515 | 0.902 ± 0.094*,† | 46.10 ± 4.83† |
| SE Ex2 | 0.791 ± 0.038* | 52.57 ± 2.45* |
| SE 269 | 0.668 ± 0.073*,† | 62.25 ± 12.50*,† |
Statistical analysis of the results was performed using GraphPad Prism 6 (GraphPad Software, La Jolla, CA, USA). Differences between strains and species parameters were assessed using two-way ANOVA followed by Tukey’s multiple comparison statistical test Asterisks (*) indicate significant differences between strains (*p < 0.05) and daggers (†) indicate significant differences between species (p < 0.05).
Characterization of single- and dual-species biofilms
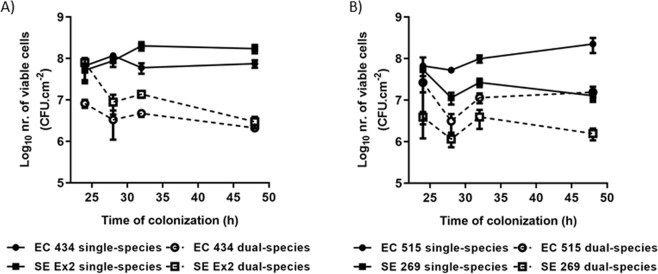
The four strains were characterized according to a methodology described previously23 to find if these were weak or strong adherent bacteria. Species had differences in adherence and consequent biofilm formation and thus for the dual-species biofilms, two sets of combinations that were used consisting of the strong (EC 434 and SE Ex2) and the weak (EC 515 and SE 269) biofilm-formers. Overall, all strains presented higher numbers in single-species biofilms compared to dual-species biofilms (Fig. 1). For instance, biofilms of EC 434 (7.5 × 10⁷ CFU/cm2) and SE Ex2 (1.73 × 10⁸ CFU/cm2) dropped to approximately 2.5 × 10⁶ CFU/cm2 when added together (Fig. 1A). Also, EC 515 and SE 269 biofilms showed 1 log less viable cells in dual-species biofilms compared to single-species biofilms (Fig. 1B).
Figure 1.
Biofilm formation of (A) EC 434 and SE Ex2 and (B) EC 515 and SE 269, single and dual-species. Comparison values of single- versus dual-species biofilms are all statistically significant (p < 0.05), except for EC 515 single- versus EC 515 + SE 269 dual-species biofilm, at 24 h of growth, and SE 269 single- versus SE 269 + EC 515 dual-species biofilm, at 24 h of growth.
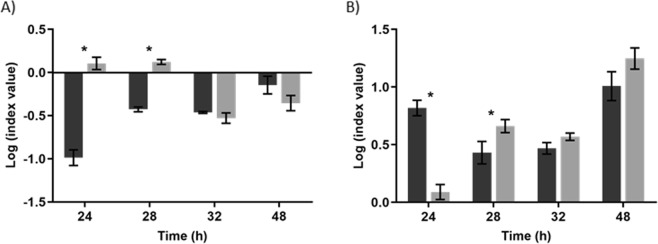
To better understand the differences between the E. coli and S. Enteritidis strains and their biofilm-forming abilities, the Competitive Index (CI) and the Relative Increase Ratio (RIR) indexes were calculated (Fig. 2). While in CI the growth curves of the two species in mixed biofilms are compared, the RIR compares the growth curves of both species in single-species biofilms. A negative CI was detected throughout all time points (Fig. 2A). However, only at 24 and 28 h of biofilm growth of SE Ex2 + EC 434 the CI and RIR were found to be statistically different (p < 0.05), indicating a competitive advantage of SE Ex2 over EC 434. On the other hand, a positive CI was observed at 24 and 28 h of growth for EC 515 + SE 269 biofilms, indicating a competitive advantage for EC 515 (Fig. 2B).
Figure 2.
Relative Increase Ratio (RIR) and Competitive Index (CI) obtained for (A) EC 434 alone and when combined with SE Ex2, and (B) EC 515 alone and when combined with SE 269, respectively. Statistical analysis of the results was performed using GraphPad Prism 6 (GraphPad Software, La Jolla, CA, USA). Differences between single- and dual-species biofilm formation abilities were assessed using two-way ANOVA followed by Tukey’s multiple comparison statistical test. Asterisks (*) indicate a significant difference (p < 0.05) between CI and RIR.
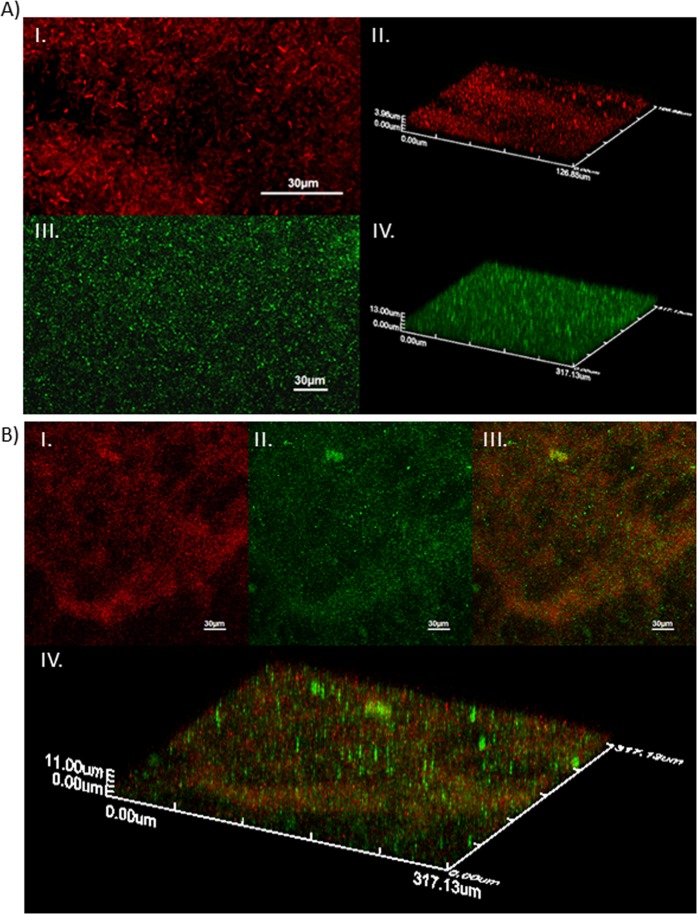
The bacterial distribution within the 48-h-old single- and dual-species biofilms formed by E. coli strains (mCherry fluorophore), and/or S. Enteritidis (sfGFP) was visualized using CLSM (Figs. 3 and 4). EC 434 single-species biofilms presented a heterogeneous spatial distribution, with bacteria accumulated more in some areas than others, reaching a thickness of approximately 4 µm (Fig. 3A, I and II). SE Ex2 biofilms were more evenly spread throughout the polystyrene coupon, presenting a thickness of ≈13 µm (Fig. 3A, III and IV). The difference in thickness between EC 434 and SE Ex2 biofilms was is in agreement with the number of viable cells obtained for each biofilm at 48 h (Fig. 1A). Analysis by CLSM of dual-species biofilm formed by EC 434 + SE Ex2 showed both strains growing on the same areas on the coupon, suggesting an influence of each species on the spatial distribution of the other species (Fig. 3B, I–III). The thickness EC 434 + SE Ex2 biofilms reached approximately 11 µm (Fig. 3B, IV), due to the lower number of bacterial counts obtained (1.55 Log10 CFU/cm2 and 1.76 Log10 CFU/cm2 for EC 434 and SE Ex2) (Fig. 1A).
Figure 3.
CLSM images showing spatial organization of (A) EC 434 (I – 2D, II – 3D) and SE Ex2 (III – 2D, IV – 3D) single-species biofilms, and (B) EC 434 + SE Ex2 dual-species biofilm (I – EC 434 colored in red; II – SE Ex2 colored in green; III – superposition of both colors, 2D; IV – biofilm 3D spatial distribution).
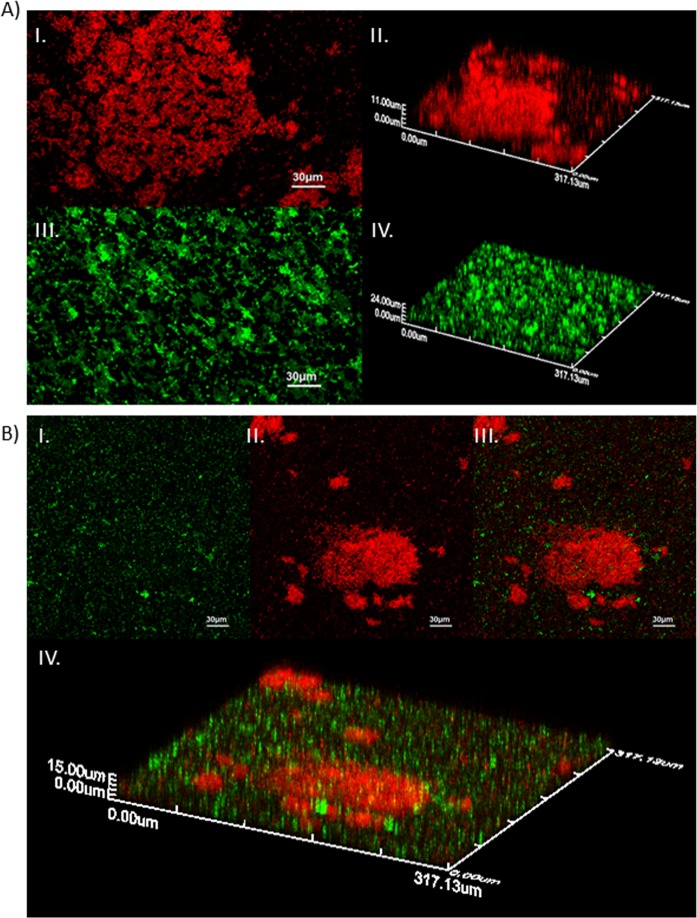
Figure 4.
CLSM images showing spatial organization of (A) EC 515 (I – 2D, II – 3D) and SE 269 (III – 2D, IV – 3D) single-species biofilms, and (B) EC 515 + SE 269 dual-species biofilm (I – SE 269 colored in green; II – EC 515 colored in red; III – superposition of both colors, 2D; IV – biofilm 3D spatial distribution).
The spatial characterization was also assessed for 48-h single- and dual-species biofilms of EC 515 and SE 269 (Fig. 4). EC 515 alone formed clustered biofilm structures, reaching, in some areas of the coupon, 11 µm in thickness (Fig. 4A, I and II). EC 434 strain reached only a 4 µm thickness (Fig. 3A, I and II). SE 269 formed a biofilm with a reticulate appearance equally dispersed through the coupon with a thickness of approximately 24 µm (Fig. 4A, III and IV), while SE Ex2 presented only a 13 µm thickness. EC 515 + SE 269 biofilms, maintained their single-species biofilm spatial arrangement (Fig. 4B, I–III) although reaching only a maximum thickness of ≈15 µm (Fig. 4B, IV).
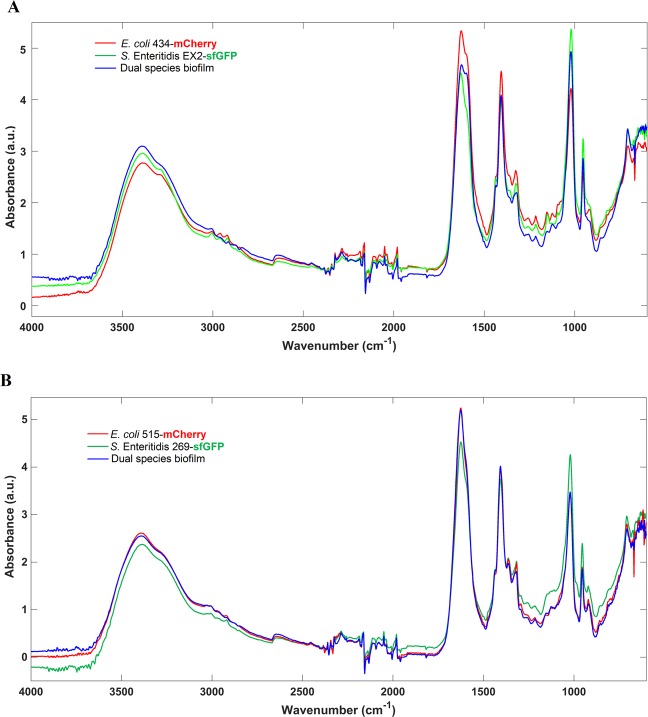
EPS spectra obtained by FTIR-ATR spectroscopy of E. coli and S. Enteritidis from single- and dual-species biofilms was analyzed (Fig. 5). Globally, the spectra presented a very similar and typical shape containing the absorption bands of lipids (3000–2800 cm−1), proteins/amides I and II (1700–1500 cm−1), a mixed region of phospholipids and nucleic acids (1500–1185 cm−1), polysaccharides (1185–900 cm−1), and the fingerprint region (900–600 cm−1)24,25. Regarding the EC 434 + SE Ex2 mixed biofilm EPS matrix, the spectrum is similar to EC 434 or to SE Ex2 spectra, depending on the considered spectral region (Fig. 5A), pointing to the absence of a predominant EPS matrix species. Additionally, the PCA model revealed an undefined clusterization with all spectra being quite dispersed in the whole scores map (Fig. 6A). Concerning the EC 515 + SE 269 EPS matrix, this spectrum is more similar to the one of EC 515. Indeed, the infrared spectra of the dual and single-species biofilms are almost totally superimposable with the EC 515 EPS matrix, being quite different from the SE 269 spectrum (Fig. 5B). The corresponding scores map of the PCA model also reflects this similarity, showing two defined clusters, one containing the EPS spectra from S. Enteritidis biofilm and the other containing the EPS matrix spectra from both single E. coli and the dual-species biofilms (Fig. 6B).
Figure 5.
Mean infrared spectra, processed with standard normal variate, of the EPS extracted from single- and dual-species biofilms of (A) EC 434 + SE Ex2 and (B) EC 515 + SE 269. Peaks: 1 – lipids, 2 - proteins/amides I and II, 3 - phospholipids and nucleic acids, 4 – polysaccharides.
Figure 6.
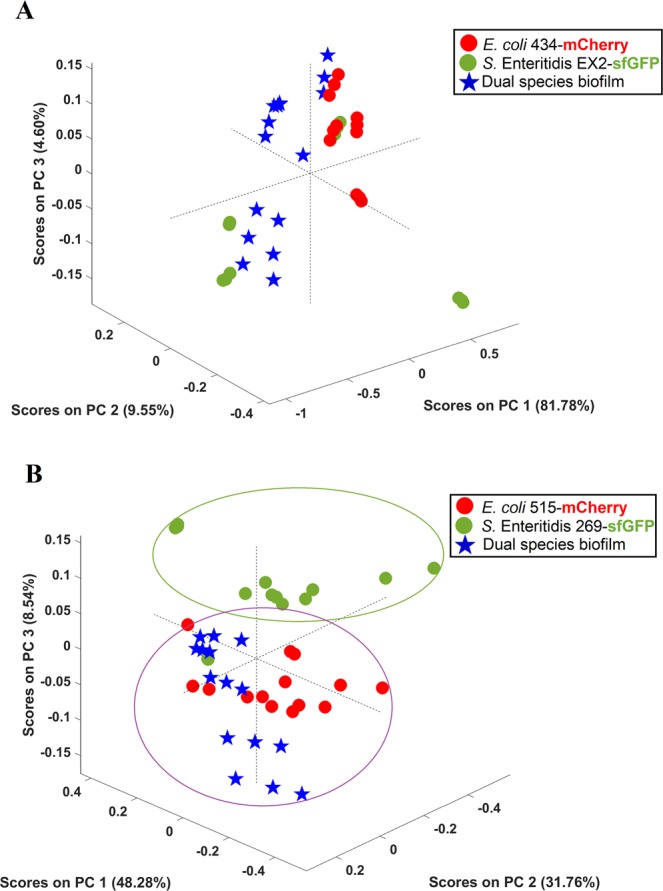
Scores map of the PCA model of the EPS infrared spectra extracted from single- and dual-species biofilms of strong (A) and weak (B) producers. The PCA model was built considering the spectral regions from 3600–2800 cm−1 and 1700–900 cm−1.
Phage characterization
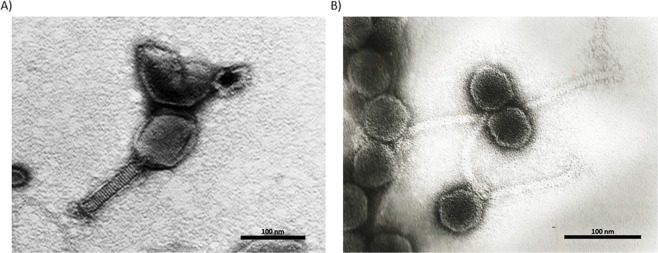
Transmission electron microscopy (TEM) visualization showed that E. coli phage Daica is a myovirus, having a long contractile tail (Fig. 7A), while the S. Enteritidis phage φ135 is a siphovirus with a long non-contractile tail (Fig. 7B).
Figure 7.
TEM micrographs of E. coli phage Daica (A) and S. Enteritidis phage φ135 (B). The scale bar is 100 nm.
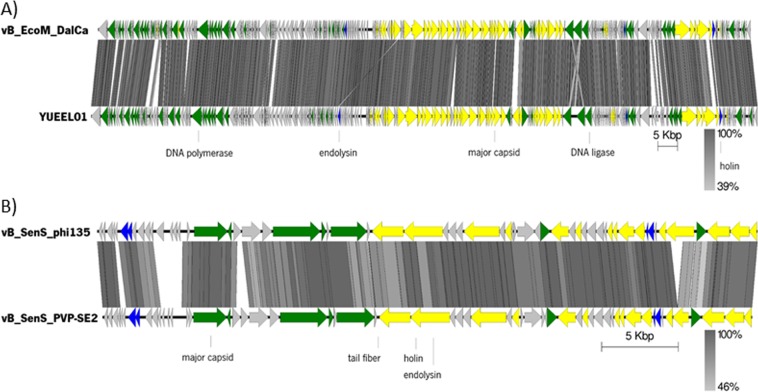
Genomic analysis of Daica revealed a genome of 166,040 bp in length, encoding 268 putative CDSs (130 with known function), regulated with 4 bacterial promoters and 34 rho-independent terminators. Whole-genome comparison showed Escherichia phage YUEEL01 (KY290975) as the closest homolog, with which it shares 94.1% of nucleotide identity and 256 genes (Fig. 8A). Regarding φ135, the genome is 43,142 bp in length, encodes 59 CDSs (28 with a predicted function), 7 bacterial promoters and 22 rho-independent terminators. Most proteins have high homology (>90% amino acid identity) to S. Enteritidis phage PVP-SE2 (MF431252) proteome. Genomic comparisons show that φ135 is collinear with vB_SenS_PVP-SE2 phage, sharing 91% nucleotide identity and 53 genes (Fig. 8B).
Figure 8.
Linear map of phages (A) Daica and (B) φ135 genome sequences. The arrows point the direction of transcription, represent the predicted ORFs and are colored (yellow, green, blue, and grey) according to their predicted functions. Major transcriptional units are represented. Schematic representation of the genomic organization of phage Daica compared to E. coli phage YUEEL01 and phage φ135 to S. Enteritidis phage vB_SenS_PVP-SE2 using Easyfig.
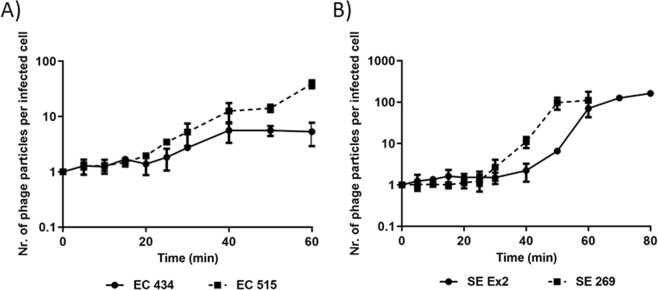
One-step growth curves of Daica and φ135 phages revealed that Daica presented a 20 min latent period on EC 434 and 15 min on EC 515, respectively (Fig. 9). Furthermore, Daica produced only 5.3 PFU per infected cell on EC 434, and 38.9 PFU per infected cell on EC 515 (Fig. 9A). Phage φ135 had a latent period of approximately 25 min on SE 269, and 30 min on SE Ex2 giving origin to 110.9 and 162.9 particles per infected SE 269 and SE Ex2 cell (Fig. 9B).
Figure 9.
One-step growth curves of phage Daica on EC 434 and EC 515 (A), and phage φ135 on SE Ex2 and SE 269 (B), at room temperature.
Phage treatment of single- and dual-species E. coli and S. Enteritidis biofilms
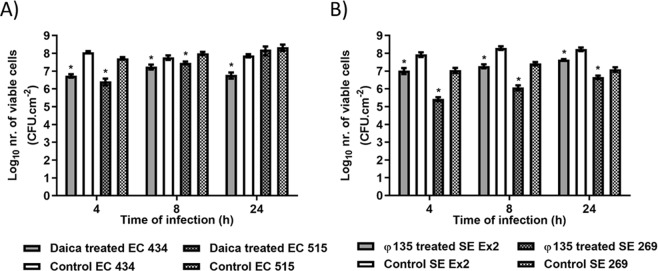
Phages were used on 24 h single-species biofilms formed by EC 434 and EC 515 (phage Daica), and SE Ex2 and SE 269 (phage φ135) (Fig. 10). Daica produced the highest reduction in the number of biofilm viable cells at 4 h of treatment for both strains [EC 434 (1.33 Log10), and EC 515 (1.29 Log10)] (Fig. 10A). SE Ex2 and SE 269 biofilms challenged with φ135 showed a greater bacterial reduction at 8 h for SE Ex2 biofilms (1.02 Log10), and at 4 h for SE 269 (1.63 Log10) (Fig. 10B).
Figure 10.
E. coli (A) and S. Enteritidis (B) single-species biofilms formed for 24 h in 96-well plates at 37 °C treated with phages Daica and φ135, respectively, for 4, 8 and 24 h. (A) Solid bars correspond to EC 434 biofilms treated with Daica (grey) or untreated/control (white) while shaded bars correspond to the control EC515 (white with black squares) or EC 515 treated with Daica (grey with black squares). (B) Solid bars correspond to SE Ex2 biofilms treated with φ135 (grey) or untreated/control (white) while shaded bars correspond to the control SE Ex2 (white with black squares) or SE 269 treated with φ135 (grey with black squares). Statistical analysis of the results was performed using GraphPad Prism 6 (GraphPad Software, La Jolla, CA, USA) using two-way ANOVA followed by Tukey’s multiple comparison statistical test. Asterisks (*) indicate a significant difference (p < 0.05) between phage-treated and control samples.
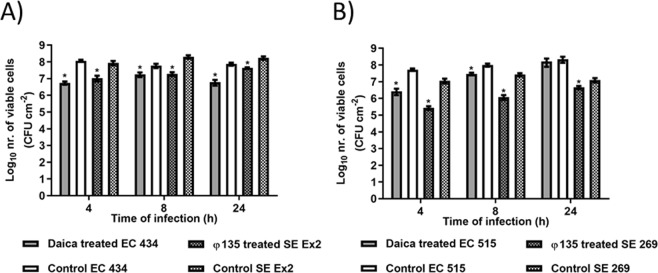
E. coli and S. Enteritidis dual-species biofilm control with E. coli phage Daica and S. Enteritidis phage φ135 was investigated (Fig. 11). Dual-species biofilms of EC 434 + SE Ex2 using the phage cocktail, resulted in a maximum viable cell decrease at 8 h, with EC 434 being reduced by 1.15 Log10 and SE Ex2 by 0.88 Log10 (Fig. 11A). EC 515 + SE 269 dual-species biofilms reached the lowest numbers of viable cells at 4 h of treatment having the phages reduced EC 515 by 1.07 Log10 and SE 269 at 8 h by 2.42 Log10 (Fig. 11B).
Figure 11.
EC 434 + SE Ex2 (A) and EC 515 + SE 269 (B) dual-species biofilms formed for 24 h in 96-well plates at 37 °C treated with phages Daica and φ135 for 4, 8 and 24 h. (A) Solid bars correspond to EC 434 biofilms treated with Daica (grey) or untreated/control (white) while shaded bars correspond to the control SE Ex2 (white with black squares) and SE Ex2 treated with φ135 (grey with black squares). (B) Solid bars correspond to EC 515 biofilms treated with Daica (grey) or untreated/control (white) while shaded bars correspond to the control SE 269 (white with black squares) or SE 269 treated with φ135 (grey with black squares). Statistical analysis of the results was performed using GraphPad Prism 6 (GraphPad Software, La Jolla, CA, USA) using two-way ANOVA followed by Tukey’s multiple comparison statistical test. Asterisks (*) indicate a significant difference (p < 0.05) between phage-treated and control samples.
Discussion
E. coli and Salmonella represent an important public health concern26,27, being responsible for numerous foodborne outbreaks, and often isolated from contaminated meats28,29, vegetables30,31, as well as food processing surfaces. Their presence in food processing surfaces leads often to food products cross-contamination events32. E. coli and Salmonella’s ability to form biofilms make them less susceptible to common disinfectants, physical removal, and other elimination processes33,34. In this work, we assessed the efficacy of two phages alone or in a cocktail, for the control of single- and dual-species biofilms, respectively. Furthermore, structural and compositional characteristics of E. coli and S. Enteritidis single-species biofilms were analysed, and dual-species biofilm interactions studied35.
The E. coli strains tested belong to serotypes O6 (EC 434) and O1:K1:H7 (EC 515). Mono-species biofilm formation by E. coli serotypes has been shown to be serotype-dependent36 but also influenced by the levels of curli expression, and presence/absence of virulence factors, such as Shiga toxins 1 and 2 (stx1 and stx2), intimin (eaeA), enterohemolysin A (hlyA), fimbriae, and autotransporters (e.g. EhaB and EspP)37–39. For instance, a study with 39 Shiga toxin-producing E. coli isolates (seropathotypes A, B, and C), showed that seropathotype A, that includes the serotypes responsible for the highest incidence of foodborne outbreaks (O157:H7 and O157:NM), had greater ability to form biofilms than isolates from seropathotypes B (eg O26:H11, O45:H2, and O103:H2) and C (O157:H26)38. According to our results, significant discrepancies between the biofilm-forming ability by the E. coli serotypes O1 and O6 were perceived, with higher counts (1.5 Log10) in biofilms of EC 515 compared to EC 434 (Fig. 1). SE Ex2 and SE 269 isolates belong to S. Enteritidis serovar however their genotype is unknown. Thus assumptions equivalent to those described for E. coli cannot be established. The adherence ability after 24 h of SE Ex2 and SE 269 showed to be different, as also confirmed by the biofilm thickness using CLSM (Figs. 3 and 4). The CFU/cm2 determinations showed a 1.2 Log10 difference with SE Ex2 reaching higher numbers than SE 269 (Fig. 1). Single-species biofilms of E. coli treated with Daica resulted in equivalent antibiofilm efficacy against both strains used (Fig. 10). This result is possibly due to a combination of three different factors: the latent period of Daica in the tested strains and the burst size reached per infected bacterium (Fig. 9A); and also the strain growth parameters. Significant differences of µmax were detected for both E. coli (EC 434 and EC 515) and S. Enteritidis (SE Ex2 and SE 269) (Table 1). Daica has a longer latent period and a lower burst size on EC 434 cell, compared to EC 515. Additionally, EC 434 strain has a higher doubling time which could result in less new cells to be infected by progeny phages. In EC 515, Daica produced around 7.3 times more progeny phage particles per infected cell, however, in this strain, the phage latent period was longer. All these factors influenced in the treatment outcome, having EC 515 treatment with Daica reached similar reductions (see Figs. 9A and 10A, and also Table 1). Salmonella phage φ135 showed a higher antibiofilm outcome in SE 269, compared to SE Ex2 biofilms. This is greatly due to a higher burst size in the first strain (Fig. 9). Also, the growth rate of SE 269 was lower and therefore the non-infected biofilm cells proliferated at a slower rate than the SE Ex2 non-infected cells, consequently resulting in a smaller number of descendent cells present at the sampling time points assessed (Figs. 9B and 10B, and also Table 1).
The strain combinations for the dual-species biofilm formation studies were: EC 434 + SE Ex2 (strong biofilm-formers), and EC 515 + SE 269 (weak biofilm-formers). The competitive ability of strains in mixed biofilms has been linked to the relative density of each bacterium added to form biofilms40, which in our study was exactly the same (200 µL/well at 1 × 10⁷ CFU/mL). Therefore, this factor cannot explain the higher/lower surface coverage by the different dual-species biofilms. The number of viable biofilm cells per area analysed in dual-species biofilms was always lower than in single-species biofilms (Fig. 1). Antagonism between biofilms formed with E. coli O157:H7 strain USDA 5 and Salmonella strain 457–88 was hypothesized to be due to species competition for adherence to the surface, leaving a smaller area available for adhesion and consequent biofilm formation by the less competitive species involved41. Mixed biofilm populations can also have a dominance of one species over the other. For instance, biofilms formed by Staphylococcus aureus and E. coli showed a dominance of the latter species, due to the shorter generation time of E. coli compared to S. aureus42. It seems that faster-growing bacteria control the environment, and favor their growth over other slower-growing strains resulting in a long-term prevalence in the surface area43,44. Growth characteristics between the two sets of species used for dual-species biofilms showed that only the set of strains EC 515 and SE 269 was significantly different (p < 0.05). This may explain why EC 515, presenting a faster growth rate, also covered a larger biofilm surface area when formed along with SE 269 (Fig. 1B). The EC 515 covered the surface area more in height forming preferentially 3D structures, while SE 269 cells were more scattered in the polystyrene surface (Fig. 4B). The same spatial distribution found in single-species biofilms was maintained by SE 269 and EC 515 when grown together.
The other set of strains used in dual-species biofilms, EC 434 and SE Ex2, had similar µmax and td values (p > 0.05) being present in the biofilms in fairly similar numbers (Fig. 1A) and equally distributed in the same areas of the coupons (Fig. 3B).
FTIR-ATR spectroscopy coupled with chemometrics, a reliable and alternative method to accurately discriminate bacteria at different taxonomic levels, including E. coli clones45, and Salmonella serogroups and serotypes46, and has also been used in biofilm contexts. For instance, FTIR-ATR has been used to monitor biofilm in situ, in real-time, and under fully hydrated conditions47, the early stages of biofilm formation, and the EPS matrix from biofilms at mid-development and mature phases47. In the latter work, FTIR-ATR spectroscopy showed that mature biofilms presented substantially higher protein and carbohydrate peaks, and a low level of lipids that was, nonetheless, higher than in mid-development phase biofilms47. In the present work, FTIR-ATR was used to compare the EPS matrix composition of single- and dual-species biofilms (Fig. 5). The FTIR-ATR analysis showed few spectral differences among the samples with a lower absorption band of lipids in all EPS samples analyzed than the absorption bands of proteins or carbohydrates. Also, it seemed that the ratio between proteins/carbohydrates was higher for EC 515 and SE 269 (Fig. 5B). A previous study has reported a competitive advantage of EPS producer strains in mixed biofilm populations and also reported that this EPS secretion helps progeny cell movement up and out of the focal cell layer, providing better oxygen conditions to their descendants48. Taking into account the EPS matrix spectral profiles obtained by FTIR-ATR, the mixed biofilms of EC 434 + SE Ex2 resembled the EPS spectra obtained with EC 434 in terms of proteins/amides I and II, and the phospholipids and nucleic acids absorption peaks, and with the polysaccharide absorption band of SE Ex2 (Fig. 5A). So, in general, in this set of strains, none seemed to be a better EPS producer than the other. Although some differences in spectral band intensities were observed, FTIR-ATR spectroscopy is a semi-quantitative method and therefore quantitative relations about biofilm matrix components should be taken carefully. The polysaccharide component of the EPS matrix offers diverse benefits to the cells in biofilms, sustaining surface and cell-to-cell adhesions, providing protection, and allowing cell growth in 3D structures49. If we take into account only the polysaccharides absorption peak (peak 4), this clearly resembles the one obtained by SE Ex2 which suggests that this strain secretes more polysaccharides than EC 434. As described above, this can confer this strain a competitive advantage for surface adhesion and predominance in the mixed consortia (Fig. 5A) which is in agreement with the higher levels of SE Ex2 cells in the surface compared to EC 434 (see Fig. 1A and negative CI index in Fig. 2A). The other set of strains, EC 515 + SE 269, showed a FTIR-ATR spectra superimposing the spectrum of EC 515 observed in single-species biofilms (Fig. 5B). Therefore, it is clear that there is a predominance of the EC 515 EPS matrix in these dual-species biofilms but that also EC 515 predominated due to its µmax (Table 1). Dominance of a surface by one specific bacterium in mixed biofilms can be growth rate-dependent or polysaccharide-dependent. However, this latter observation needs to be further validated, since only the FTIR-ATR absorbance peak between 1185 and 900 cm−1 was taken into consideration for this assumption.
The use of both phages as antibiofilm agents showed that short treatment periods are more effective towards both single- and dual-species biofilms (Figs. 10 and 11). The antibiofilm effect using the phage cocktail comprising Daica and φ135 phages, on dual-species biofilms formed by EC 434 and SE Ex2 resulted in similar Log10 reductions for both species (Fig. 11A). Both strains have non-statistically different µmax and, therefore, in theory, the phage producing a higher burst size should reduce more biofilm cells. This was not, however, the situation observed after phage treatment of these biofilms. Taking into consideration that EC 434 and SE Ex2 biofilms also presented fairly similar viable cell numbers throughout the phage treatment experiments, and being φ135 able to produce 30.7 times more new phage particles per infected SE Ex2 cell compared to Daica on EC 434, this indeed should have resulted in greater SE Ex2 reductions. CLSM analysis showed that these strains are scattered throughout the coupon surface, and this can hinder phages from reaching their hosts (Fig. 3B). Furthermore, FTIR-ATR analysis of the EPS matrix also showed that the spectral peaks of these strains were more similar, in some peaks, to SE Ex2 (polysaccharide absorption peak, peak 4), and in other peaks more related to EC 434 (Fig. 5A). If the assumption made before, that SE Ex2 secretes more polysaccharides, this SE Ex2 EPS matrix can be masking the phage receptors present in the host cell surfaces of EC 434 explaining in this case, why a higher phage burst size did not result in an enhanced antibiofilm activity against EC 434. Nevertheless, further experiments need to be performed to understand this behavior, possibly resorting to time-lapse microscopy imaging, flow cytometry or even spinning disk confocal microscopy.
Phage challenge of the EC 515 and SE 269 dual-species consortia resulted in higher reductions of SE 269 biofilm cells than of EC 515 (Fig. 11B). In this case, this result is a reflection of φ135 having a better burst size than Daica, and also due to the slower growth rate of SE 269 (Fig. 10B and Table 1). Furthermore, CLSM showed that EC 515 preferentially formed 3D clusters, which can impair phage diffusion to reach cells that are in deeper biofilm layers (Fig. 4B). According to FTIR-ATR spectroscopy analysis, the EC 515 + SE 269 EPS spectrum obtained was remarkably similar to the spectrum of EC 515 EPS. These results indicate that, even though EC 515’s EPS predominates in the dual-species biofilm samples, it is possibly confined only to the clustered areas, and therefore does not constitute an obstacle for phage φ135 to reach SE 269 cells.
In conclusion, this work gives new insights into the many factors influencing dual-species biofilm development. Moreover, it sheds light on the interaction of single and cocktail phages for the control of single- and dual-species biofilms. A better understanding of species-species and phage-host interactions was reached through analysis of bacterial and phage growth parameters, viable cell determination, before and after phage treatment, CLSM imaging of the biofilm structures, and also EPS matrix analyses by FTIR-ATR spectroscopy. Even though some of the strains showed to be more competitive regarding their surface attachment, reaching higher viable cell numbers than the other species involved, this did not have a direct influence on the action of phages. Infectivity of the phage was more associated with their growth characteristics, in particular, the latent period duration and burst size, and also to the difficulty of phages to infect one particular strain, EC 515, which formed 3D biofilms structures rather than being uniformly dispersed over the surface, possibly impairing phage diffusion. Furthermore, the EPS matrix of one species can constitute a problem to the other one, and the phage killing ability the latter species, by possibly covering the phage receptors necessary for the adsorption step to take place.
Materials and Methods
Bacterial strains and phages
E. coli CECT 434 (EC 434, serotype O6 and Biotype 1) and CECT 515 (EC 515, serovar O1:K1(L1):H7), from the Spanish Type Culture Collection. The CECT 434 reference strain is recommended for use for in UNE-CEN ISO/TS 11133, EN ISO 6888, and ISO 15214 applications, and the CECT 515 for UNE-CEN ISO/TS 11133. The S Enteritidis Ex2 (SE Ex2) and 269 (SE 269) were previously isolated from contaminated food products (SE 269)50. All strains were grown at 37 °C in liquid or in solid LB medium (LB + 1.5% (w/v) of agar). The Salmonella phage used was φ13550, and the E. coli phage Daica was isolated, during this study, as previously described51.
E. coli and S. Enteritidis electrocompetent cells
Electrocompetent cells were prepared by inoculating 100 mL of LB with 100 µL of overnight culture and incubated at 37 °C (200 rpm, Orbital Shaker ES-20/60, 10 mm orbit, BIOSAN, Latvia) until an OD620 ≈ 0.6. After, cells were chilled 20 min on ice, harvested (7,000 × g, 10 min), and the supernatant discarded. The pellet was sequentially washed with 100 mL of ice-cold dH2O; 50 mL, 25 mL and 10 mL of ice-cold glycerol (10% (v/v)), suspended in 1 mL of ice-cold glycerol (10% (v/v)), and stored as 100 µL aliquots at −80 °C until use.
Construction of sfGFP and mCherry strains
S. Enteritidis strains were transformed with the sfGFP-pBAD plasmid (Addgene plasmid #54519) which encodes for the superfolder green fluorescent protein (sfGFP), and the E. coli strains with plasmid pNUT086, which encodes for the mCherry fluorophore. Electrocompetent S. Enteritidis and E. coli cells (100 µL) were mixed with the respective plasmids, placed in a 1 mm gap electroporation cuvette, and a pulse of 25 μF, 200 Ω, 1.8 kV was applied. After, 900 µL of liquid LB medium were added to the mixture, cells incubated at 37 °C (120 rpm, 1 h), and plated on solid LB supplemented either with ampicillin (100 µg/mL) or with kanamycin (50 µg/mL), for S. Enteritidis cells and E. coli cells, respectively.
Characterization of the growth parameters of E. coli and S. Enteritidis strains
Specific growth rates and doubling times of all strains were determined according to previously described methods52. Experiments were performed in triplicate.
Biofilm formation assessment by Crystal Violet staining
The method described by Stepanović et al. (2000) was used to categorize the biofilm-forming capacity of bacteria into: 1) non-biofilm-formers (OD ≤ ODc); 2) weak (ODc < OD ≤ 2 × ODc); 3) moderate (2 × ODc < OD ≤ 4 × ODc); and 4) strong biofilm-formers (OD > 4 × ODc). ODc is the cut-off OD (ODc = OD average of sterile LB + 3 × Standard Deviation (SD) of the ODs of negative controls). Sterile LB served as negative control giving an average value of 0.089 ± 0.005 and an ODc of 0.104. Experiments were performed in triplicate.
Biofilm formation
The ability of the different strains to form biofilms was determined according to a method using the microtiter plate biofilm model previously described23, with some modifications. Briefly, an overnight culture was grown (37 °C, 120 rpm) in LB supplemented with kanamycin or ampicillin, according to the plasmid used. After, all cultures were diluted to 1 × 10⁷ CFU/mL, and 200 μL/well of culture transferred to polystyrene microtiter plates (96-well flat-bottom, Sarstedt, Inc., Germany) and incubated at 37 °C (48 h, 120 rpm). After, biofilms were washed twice with saline and detached using an ultrasonic bath (50 kHz, 6 min, Sonicor SC-52, Sonicor Instruments, UK)53. Bacterial suspensions were homogenized, 10-fold serially diluted, and plated onto solid LB supplemented with either kanamycin or ampicillin, and incubated overnight at 37 °C. Experiments were performed in triplicate.
Determination of the competitive index (CI) and the relative increase ratio (RIR)
In dual-species biofilms, the Competitive Index (CI) was established as the EC 434/SE Ex2 or EC 515/SE 269 ratios within the output sample divided by the corresponding ratio in the inoculum (input): CI = (EC 434/SE Ex2 or EC 515/SE 269) output/(EC 434/SE Ex2 or EC 515/SE 269) input, where output and input are the counts of viable cells [Log10(CFU/cm2)] obtained at defined time points or the inoculum (t = 0), respectively12. CI values were interpreted as follows: a CI value equal to 0 indicates equal competition of the two species; a positive CI value indicates a competitive advantage for the species on the numerator; a negative CI value indicates a competitive advantage for the species on the denominator. The Relative Increase Ration (RIR) was calculated based on the counts of viable cells [Log10(CFU/cm2)] obtained from single-species biofilms of each strain12.
Confocal laser scanning microscopy (CLSM)
Single- and dual-species biofilms were formed on polystyrene coupons (NuncThermanox, Thermo Scientific, MA, USA) placed on 24-well polystyrene microtiter plates as described above, with slight modifications. The volume of bacterial suspension was adjusted to 1 mL/well instead of 200 μL/well. Expression of mCherry fluorophore and sfGFP was induced by adding 1 mM IPTG and 0.2% (v/v) of L-arabinose54,55, after 43 h of biofilms formation. Induction occurred during 5 h in the 48 h-old biofilms. Z-stacks were acquired on a CLSM (Olympus BX61, Model FluoView 1000, Olympus, Tokyo, Japan) equipped with 405–635 nm laser lines. Images were obtained with the FV10-Ver4.1.1.5 program (Olympus, Tokyo, Japan).
Extraction of EPS from biofilms
E. coli and S. Enteritidis single- and dual-species biofilms were grown using the colony biofilm procedure56, with some modifications. Polycarbonate sterile membrane filters (Whatman®, Maidstone, UK, 47 mm diameter, 0.2 μm pore size) were placed on solid LB plates with the shiny side facing up. Each membrane was inoculated with 50 µL of EC 434, EC 515, SE Ex2, SE 269, or alternatively with the mixtures of EC 434 + SE Ex2 or EC 515 + SE 269. All strains were diluted from overnight cultures to a final concentration of ≈1 × 10⁸ CFU/mL. Biofilms were formed for 48 h at 37 °C without agitation, and membranes were transferred to fresh LB plates every 24 h. For each strain or combination of strains, ten membranes were used. The extraction of EPS from biofilms was performed as previously described57.
Fourier transform infrared-attenuated total reflectance (FTIR-ATR) spectroscopy of EPS
EPS of biofilms was lyophilized and analyzed by FTIR-ATR spectroscopy. Samples were transferred to the ATR crystal and a pressure of 150 N/cm2 was applied. Infrared spectra were acquired (PerkinElmer Spectrum BX FTIR System spectrophotometer, PerkinElmer, Waltham, USA) with a PIKE Technologies Gladi ATR accessory (PIKE Technologies, Inc., Madison, USA) from 4000 to 600 cm−1 with a resolution of 4 cm−1 and 32 scans co-additions. For each sample, three instrumental replicates (obtained in the same day) and two biological replicates (obtained in two different days from two independent bacterial growths) were obtained, corresponding to a total of six spectra for each extracted EPS. Between each EPS measurement, the background was acquired. Spectra corresponding to the instrumental replicates were averaged prior to the analysis.
Phage propagation and titration
SE Ex2 and EC 434 were used for the production and titration of phages φ135 and Daica. Phages were amplified using the plate lysis and elution method58. Titration of the phage was performed according to a previously described protocol59.
Transmission electron microscopy (TEM) analysis of phages
The morphology of phage particles was observed by TEM as previously described60.
Phage DNA extraction, genome sequencing, and annotation
Phage DNA was extracted as described before60. Phage DNA was prepared for sequencing using the Illumina Nextera XT library preparation kit generating 250 bp paired-end sequencing reads and sequenced in the Illumina HiSeq platform. Reads were trimmed to remove adapters, contaminations, or low-quality sequences, and assembled with the CLC Genomics Workbench version 7 (CLC Bio, Aarhus, Denmark). Structural annotation was conducted with MyRAST61 and also checked manually (Geneious 9.1.4, Biomatters, NJ, USA). Potential frameshifts were checked with BLASTX62. Gene functions were predicted using BLASTP programs63 (E-value ≤ 10−5) and HHPRED server64, consulted between June and July 2018, TMHMM65 and Phobius66. The search of tRNA encoding genes was performed using tRNAscan-SE67. Putative promoters were searched using PhiSITE68, and putative regions were manually verified. ARNold69 was used to predict Rho-independent terminators and the energy was calculated using Mfold70. Protein parameters were determined using Sequence Manipulation Suite: Protein Isoelectric Point and Protein Molecular Weight71. Whole-genome comparisons were performed using EasyFig72 and OrthoVenn73. The complete genome sequences of Daica and phage φ135 were deposited in GenBank under accession nos. MH992509 and MH992510.
Phage one-step growth characteristics
The one-step growth curves of phages Daica and φ135 on the two tested E. coli and S. Enteritidis strains were performed as described previously51 using a multiplicity of infection (MOI) of 0.001. Experiments were performed in triplicate.
Biofilm treatment with phages
Biofilms formed on 96-well microtiter plates for 24 h, as described above, were washed once with saline, and exposed to 100 μL of LB and 100 μL of phage at a multiplicity of infection (MOI) of 1. Single-species biofilms of S. Enteritidis were exposed to φ135, and E. coli to Daica. Dual-species biofilms were exposed to both phages. Microtiter plates were incubated at 37 °C, 120 rpm, and samples were taken after 4, 8 and 24 h. Control experiments were performed using 100 μL of LB and 100 μL of SM buffer (5.8 g/L NaCl, 2 g/L MgSO4.7 H2O, 50 mL 1 M Tris, pH 7.5). The number of viable biofilm cells (CFU/cm2) was determined before and after phage infection, with serial dilutions performed in saline-FAS solution [0.9% (w/v) NaCl, 2 mM of ferric ammonium sulfate (FAS)] to destroy non-infecting phages74. Experiments were performed in triplicate.
Infrared spectra data analysis
Two principal component analysis (PCA) models75 were developed including EPS spectra from the two E. coli and two S. Enteritidis strains, in single- and dual-species biofilms. Prior modeling, spectra were pre-processed with standard normal variate (SNV) followed by the application of a Savitzky-Golay filter (15 smoothing points, 2nd order polynomial, and 1st derivative)76,77 and mean-centered. All data analyses were performed in Matlab version 7.9 (Mathworks, USA) and the PLS Toolbox version 5.5.1 for Matlab (Eigenvector Research, USA).
Statistical analysis
Statistical analysis of the results was performed using GraphPad Prism 6 (GraphPad Software, CA, USA). The independent experiments and the results are presented as mean ± standard deviation (SD). Differences between single- and dual-species biofilm formation abilities were assessed using two-way ANOVA followed by Tukey’s multiple comparison statistical test. CI and RIR were compared using unpaired Student’s t-test, with significant differences being indicative of a probable competition between the species12. Differences were considered statistically significant if p < 0.05 (95% confidence interval).
Acknowledgements
This project also received funding from the European Union’s Horizon 2020 research and innovation programme under grant agreements No 713640, and No. 778388. This work was supported by the Portuguese Foundation for Science and Technology under the scope of the strategic funding of UID/BIO/04469/2013 unit and COMPETE 2020 (POCI-01-0145-FEDER-006684) and BioTecNorte operation (NORTE-01-0145-FEDER-000004) funded by the European Regional Development Fund under the scope of Norte2020 - Programa Operacional Regional do Norte. CM and MDS acknowledge the Portuguese Foundation for Science and Technology (FCT) for their grants SFRH/BD/94434/2013 and SFRH/BD/128825/2017. The pNUT086 plasmid was kindly provided by Dr. Knut Drescher from Max Planck Institute for Terrestrial Microbiology, Germany.
Author contributions
Conceptualization and Methodology, S.S.; Investigation, C.M., M.D.S., D.A., H.O. and C.S.; Writing – Original Draft, C.M., M.D.S., D.A., H.O. and C.S.; Writing – Review & Editing of the first version submitted, J.A. and S.S.; Writing - Review & Editing of the revised document, L.M.P. and S.S.; Funding Acquisition & Resources, S.S.
Competing interests
The authors declare no competing interests.
Footnotes
Publisher’s note Springer Nature remains neutral with regard to jurisdictional claims in published maps and institutional affiliations.
Change history
2/6/2020
An amendment to this paper has been published and can be accessed via a link at the top of the paper.
References
- 1.DuPont HL. The Growing Threat of Foodborne Bacterial Enteropathogens of Animal Origin. Clin. Infect. Dis. 2007;45:1353–1361. doi: 10.1086/522662. [DOI] [PubMed] [Google Scholar]
- 2.Sadok Walid, Sinclair Thomas R. Advances in Agronomy. 2011. Crops Yield Increase Under Water-Limited Conditions: Review of Recent Physiological Advances for Soybean Genetic Improvement; pp. 325–349. [Google Scholar]
- 3.Greig J.D., Ravel A. Analysis of foodborne outbreak data reported internationally for source attribution. International Journal of Food Microbiology. 2009;130(2):77–87. doi: 10.1016/j.ijfoodmicro.2008.12.031. [DOI] [PubMed] [Google Scholar]
- 4.WANG RONG, KALCHAYANAND NORASAK, SCHMIDT JOHN W., HARHAY DAYNA M. Mixed Biofilm Formation by Shiga Toxin–Producing Escherichia coli and Salmonella enterica Serovar Typhimurium Enhanced Bacterial Resistance to Sanitization due to Extracellular Polymeric Substances. Journal of Food Protection. 2013;76(9):1513–1522. doi: 10.4315/0362-028X.JFP-13-077. [DOI] [PubMed] [Google Scholar]
- 5.Islam M., Morgan J., Doyle M. P., Phatak S. C., Millner P., Jiang X. Fate of Salmonella enterica Serovar Typhimurium on Carrots and Radishes Grown in Fields Treated with Contaminated Manure Composts or Irrigation Water. Applied and Environmental Microbiology. 2004;70(4):2497–2502. doi: 10.1128/AEM.70.4.2497-2502.2004. [DOI] [PMC free article] [PubMed] [Google Scholar]
- 6.Islam Mahbub, Morgan Jennie, Doyle Michael P., Phatak Sharad C., Millner Patricia, Jiang Xiuping. Persistence of Salmonella enterica Serovar Typhimurium on Lettuce and Parsley and in Soils on Which They Were Grown in Fields Treated with Contaminated Manure Composts or Irrigation Water. Foodborne Pathogens and Disease. 2004;1(1):27–35. doi: 10.1089/153531404772914437. [DOI] [PubMed] [Google Scholar]
- 7.Jensen Dane A., Friedrich Loretta M., Harris Linda J., Danyluk Michelle D., Schaffner Donald W. Cross contamination of Escherichia coli O157:H7 between lettuce and wash water during home-scale washing. Food Microbiology. 2015;46:428–433. doi: 10.1016/j.fm.2014.08.025. [DOI] [PubMed] [Google Scholar]
- 8.Teplitski Max, Barak Jeri D, Schneider Keith R. Human enteric pathogens in produce: un-answered ecological questions with direct implications for food safety. Current Opinion in Biotechnology. 2009;20(2):166–171. doi: 10.1016/j.copbio.2009.03.002. [DOI] [PubMed] [Google Scholar]
- 9.Scallan E, et al. Foodborne Illness Acquired in the United States—Major Pathogens. Emerg. Infect. Dis. 2011;17:7–15. doi: 10.3201/eid1701.P11101. [DOI] [PMC free article] [PubMed] [Google Scholar]
- 10.Garrett Trevor Roger, Bhakoo Manmohan, Zhang Zhibing. Bacterial adhesion and biofilms on surfaces. Progress in Natural Science. 2008;18(9):1049–1056. [Google Scholar]
- 11.Giaouris Efstathios, Heir Even, Hébraud Michel, Chorianopoulos Nikos, Langsrud Solveig, Møretrø Trond, Habimana Olivier, Desvaux Mickaël, Renier Sandra, Nychas George-John. Attachment and biofilm formation by foodborne bacteria in meat processing environments: Causes, implications, role of bacterial interactions and control by alternative novel methods. Meat Science. 2014;97(3):298–309. doi: 10.1016/j.meatsci.2013.05.023. [DOI] [PubMed] [Google Scholar]
- 12.MACHO ALBERTO P., ZUMAQUERO ADELA, ORTIZ-MARTÍN INMACULADA, BEUZÓN CARMEN R. Competitive index in mixed infections: a sensitive and accurate assay for the genetic analysis of Pseudomonas syringae?plant interactions. Molecular Plant Pathology. 2007;8(4):437–450. doi: 10.1111/j.1364-3703.2007.00404.x. [DOI] [PubMed] [Google Scholar]
- 13.Esteves C. L. C., Jones B. D., Clegg S. Biofilm Formation by Salmonella enterica Serovar Typhimurium and Escherichia coli on Epithelial Cells following Mixed Inoculations. Infection and Immunity. 2005;73(8):5198–5203. doi: 10.1128/IAI.73.8.5198-5203.2005. [DOI] [PMC free article] [PubMed] [Google Scholar]
- 14.Zhou Yizhou, Smith Daniel, Leong Bryan J., Brännström Kristoffer, Almqvist Fredrik, Chapman Matthew R. Promiscuous Cross-seeding between Bacterial Amyloids Promotes Interspecies Biofilms. Journal of Biological Chemistry. 2012;287(42):35092–35103. doi: 10.1074/jbc.M112.383737. [DOI] [PMC free article] [PubMed] [Google Scholar]
- 15.Sillankorva Sanna, Neubauer Peter, Azeredo Joana. Pseudomonas fluorescens biofilms subjected to phage phiIBB-PF7A. BMC Biotechnology. 2008;8(1):79. doi: 10.1186/1472-6750-8-79. [DOI] [PMC free article] [PubMed] [Google Scholar]
- 16.de Ornellas Dutka Garcia Keila Carolina, de Oliveira Corrêa Isadora Mainieri, Pereira Larissa Quinto, Silva Tarcísio Macedo, de Souza Ribeiro Mioni Mateus, de Moraes Izidoro Ana Carolina, Vellano Bastos Igor Henrique, Marietto Gonçalves Guilherme Augusto, Okamoto Adriano Sakai, Andreatti Filho Raphael Lucio. Bacteriophage use to control Salmonella biofilm on surfaces present in chicken slaughterhouses. Poultry Science. 2017;96(9):3392–3398. doi: 10.3382/ps/pex124. [DOI] [PubMed] [Google Scholar]
- 17.Gong Chao, Jiang Xiuping. Application of bacteriophages to reduce Salmonella attachment and biofilms on hard surfaces. Poultry Science. 2017;96(6):1838–1848. doi: 10.3382/ps/pew463. [DOI] [PubMed] [Google Scholar]
- 18.Sasikala D, Srinivasan P. Characterization of Potential Lytic Bacteriophage Against Vibrio alginolyticus and its Therapeutic Implications on Biofilm Dispersal. Microb. Pathog. 2016;101:24–35. doi: 10.1016/j.micpath.2016.10.017. [DOI] [PubMed] [Google Scholar]
- 19.Arachchi GJ, et al. Effectiveness of phages in the decontamination of Listeria monocytogenes Adhered to Clean Stainless Steel, Stainless Steel Coated with Fish Protein, and as a Biofilm. J. Ind. Microbiol. Biotechnol. 2013;40:1105–1116. doi: 10.1007/s10295-013-1313-3. [DOI] [PubMed] [Google Scholar]
- 20.Sharma M, Ryu JH, Beuchat LR. Inactivation of Escherichia coli O157:H7 in Biofilm on Stainless Steel by Treatment with an Alkaline Cleaner and a Bacteriophage. J. Appl. Microbiol. 2005;99:449–459. doi: 10.1111/j.1365-2672.2005.02659.x. [DOI] [PubMed] [Google Scholar]
- 21.Sillankorva S, Neubauer P, Azeredo J. Phage Control of Dual Species Biofilms of Pseudomonas fluorescens and Staphylococcus lentus. Biofouling. 2010;26:567–575. doi: 10.1080/08927014.2010.494251. [DOI] [PubMed] [Google Scholar]
- 22.Gutiérrez D, et al. Two Phages, phiIPLA-RODI and phiIPLA-C1C, Lyse Mono- and Dual-Species Staphylococcal Biofilm. Appl. Environ. Microbiol. 2015;81:3336–3348. doi: 10.1128/AEM.03560-14. [DOI] [PMC free article] [PubMed] [Google Scholar]
- 23.Stepanović Srdjan, Vuković Dragana, Dakić Ivana, Savić Branislava, Švabić-Vlahović Milena. A modified microtiter-plate test for quantification of staphylococcal biofilm formation. Journal of Microbiological Methods. 2000;40(2):175–179. doi: 10.1016/s0167-7012(00)00122-6. [DOI] [PubMed] [Google Scholar]
- 24.Naumann Dieter, Helm Dieter, Labischinski Harald. Microbiological characterizations by FT-IR spectroscopy. Nature. 1991;351(6321):81–82. doi: 10.1038/351081a0. [DOI] [PubMed] [Google Scholar]
- 25.Maquelin K, Kirschner C, Choo-Smith L.-P, van den Braak N, Endtz H.Ph, Naumann D, Puppels G.J. Identification of medically relevant microorganisms by vibrational spectroscopy. Journal of Microbiological Methods. 2002;51(3):255–271. doi: 10.1016/s0167-7012(02)00127-6. [DOI] [PubMed] [Google Scholar]
- 26.CDC. E. coli - outbreaks. Available at: https://www.cdc.gov/ecoli/outbreaks.html. (2018).
- 27.CDC. Salmonella - outbreaks. Available at: https://www.cdc.gov/salmonella/outbreaks.html. (2018).
- 28.CDC. Outbreak of E. coli Infections Linked to Ground Beef. Available at: https://www.cdc.gov/ecoli/2018/o26-09-18/index.html. (2018).
- 29.CDC. Outbreak of Salmonella Infections Linked to Ground Beef. Available at: https://www.cdc.gov/salmonella/newport-10-18/index.html. (2018).
- 30.CDC. Multistate Outbreak of E. coli O157:H7 Infections Linked to Romaine Lettuce. Available at: https://www.cdc.gov/ecoli/2018/o157h7-04-18/index.html. (2018).
- 31.CDC. Multistate Outbreak of Salmonella Poona Infections Linked to Imported Cucumbers. Available at: https://www.cdc.gov/salmonella/poona-09-15/index.html. (2015). [DOI] [PMC free article] [PubMed]
- 32.Chmielewski RAN, Frank JF. Biofilm Formation and Control in Food Processing Facilities. Compr. Rev. Food Sci. Food Saf. 2003;2:22–32. doi: 10.1111/j.1541-4337.2003.tb00012.x. [DOI] [PubMed] [Google Scholar]
- 33.Steenackers Hans, Hermans Kim, Vanderleyden Jos, De Keersmaecker Sigrid C.J. Salmonella biofilms: An overview on occurrence, structure, regulation and eradication. Food Research International. 2012;45(2):502–531. [Google Scholar]
- 34.Galié, S., García-Gutiérrez, C., Miguélez, E. M., Villar, C. J. & Lombó, F. Biofilms in the Food Industry: Health Aspects and Control Methods. Frontiers in Microbiology, 10.3389/fmicb.2018.00898 (2018). [DOI] [PMC free article] [PubMed]
- 35.Giaouris, E. et al. Intra- and Inter-species Interactions within Biofilms of Important Foodborne Bacterial Pathogens. Frontiers in Microbiology, 10.3389/fmicb.2015.00841 (2015). [DOI] [PMC free article] [PubMed]
- 36.WANG RONG, BONO JAMES L., KALCHAYANAND NORASAK, SHACKELFORD STEVEN, HARHAY DAYNA M. Biofilm Formation by Shiga Toxin–Producing Escherichia coli O157:H7 and Non-O157 Strains and Their Tolerance to Sanitizers Commonly Used in the Food Processing Environment. Journal of Food Protection. 2012;75(8):1418–1428. doi: 10.4315/0362-028X.JFP-11-427. [DOI] [PubMed] [Google Scholar]
- 37.Uhlich GA, Chen C-Y, Cottrell BJ, Nguyen L-H. Growth Media and Temperature Effects on Biofilm Formation by Serotype O157:H7 and Non-O157 Shiga toxin-producing Escherichia coli. FEMS Microbiol. Lett. 2014;354:133–141. doi: 10.1111/1574-6968.12439. [DOI] [PubMed] [Google Scholar]
- 38.Vogeleer Philippe, Tremblay Yannick D. N., Jubelin Grégory, Jacques Mario, Harel Josée. Biofilm-Forming Abilities of Shiga Toxin-Producing Escherichia coli Isolates Associated with Human Infections. Applied and Environmental Microbiology. 2015;82(5):1448–1458. doi: 10.1128/AEM.02983-15. [DOI] [PMC free article] [PubMed] [Google Scholar]
- 39.Wang Rong, Kalchayanand Norasak, Bono James L., Schmidt John W., Bosilevac Joseph M. Dual-Serotype Biofilm Formation by Shiga Toxin-Producing Escherichia coli O157:H7 and O26:H11 Strains. Applied and Environmental Microbiology. 2012;78(17):6341–6344. doi: 10.1128/AEM.01137-12. [DOI] [PMC free article] [PubMed] [Google Scholar]
- 40.Oliveira Nuno M., Martinez-Garcia Esteban, Xavier Joao, Durham William M., Kolter Roberto, Kim Wook, Foster Kevin R. Biofilm Formation As a Response to Ecological Competition. PLOS Biology. 2015;13(7):e1002191. doi: 10.1371/journal.pbio.1002191. [DOI] [PMC free article] [PubMed] [Google Scholar]
- 41.Chen Dong, Zhao Tong, Doyle Michael P. Single- and mixed-species biofilm formation by Escherichia coli O157:H7 and Salmonella, and their sensitivity to levulinic acid plus sodium dodecyl sulfate. Food Control. 2015;57:48–53. [Google Scholar]
- 42.Pompermayer Daisy M.C, Gaylarde Christine C. The influence of temperature on the adhesion of mixed cultures of Staphylococcus aureus and Escherichia coli to polypropylene. Food Microbiology. 2000;17(4):361–365. [Google Scholar]
- 43.West Stuart A., Griffin Ashleigh S., Gardner Andy, Diggle Stephen P. Social evolution theory for microorganisms. Nature Reviews Microbiology. 2006;4(8):597–607. doi: 10.1038/nrmicro1461. [DOI] [PubMed] [Google Scholar]
- 44.Nadell Carey D., Xavier Joao B., Foster Kevin R. The sociobiology of biofilms. FEMS Microbiology Reviews. 2009;33(1):206–224. doi: 10.1111/j.1574-6976.2008.00150.x. [DOI] [PubMed] [Google Scholar]
- 45.Sousa, C., Novais, A., Magalhães, A., Lopes, J. & Peixe, L. Diverse High-Risk B2 and D Escherichia coli Clones Depicted by Fourier Transform Infrared Spectroscopy. Sci. Rep., 10.1038/srep03278 (2013). [DOI] [PMC free article] [PubMed]
- 46.Campos Joana, Sousa Clara, Mourão Joana, Lopes João, Antunes Patrícia, Peixe Luísa. Discrimination of non-typhoid Salmonella serogroups and serotypes by Fourier Transform Infrared Spectroscopy: A comprehensive analysis. International Journal of Food Microbiology. 2018;285:34–41. doi: 10.1016/j.ijfoodmicro.2018.07.005. [DOI] [PubMed] [Google Scholar]
- 47.Quilès Fabienne, Humbert François, Delille Anne. Analysis of changes in attenuated total reflection FTIR fingerprints of Pseudomonas fluorescens from planktonic state to nascent biofilm state. Spectrochimica Acta Part A: Molecular and Biomolecular Spectroscopy. 2010;75(2):610–616. doi: 10.1016/j.saa.2009.11.026. [DOI] [PubMed] [Google Scholar]
- 48.Kovács ÁT. Impact of spatial distribution on the development of mutualism in microbes. Front. Microbiol. 2014;5:1–5. doi: 10.3389/fmicb.2014.00649. [DOI] [PMC free article] [PubMed] [Google Scholar]
- 49.Limoli, D. H., Jones, C. J. & Wozniak, D. J. Bacterial Extracellular Polysaccharides in Biofilm Formation and Function. Microbiol. Spectr., 10.1128/microbiolspec.mb-0011-2014 (2015). [DOI] [PMC free article] [PubMed]
- 50.Sillankorva S, et al. Salmonella Enteritidis Bacteriophage Candidates for Phage Therapy of Poultry. J. Appl. Microbiol. 2010;108:1175–1186. doi: 10.1111/j.1365-2672.2009.04549.x. [DOI] [PubMed] [Google Scholar]
- 51.Sillankorva, S., Neubauer, P. & Azeredo, J. Isolation and Characterization of a T7-like Lytic Phage for Pseudomonas fluorescens. BMC Biotechnol. 8 (2008). [DOI] [PMC free article] [PubMed]
- 52.Hall B. G., Acar H., Nandipati A., Barlow M. Growth Rates Made Easy. Molecular Biology and Evolution. 2013;31(1):232–238. doi: 10.1093/molbev/mst187. [DOI] [PubMed] [Google Scholar]
- 53.Milho C, et al. Control of Salmonella Enteritidis on Food Contact Surfaces with Bacteriophage PVP-SE2. Biofouling. 2018;0:1–16. doi: 10.1080/08927014.2018.1501475. [DOI] [PubMed] [Google Scholar]
- 54.Pédelacq Jean-Denis, Cabantous Stéphanie, Tran Timothy, Terwilliger Thomas C, Waldo Geoffrey S. Engineering and characterization of a superfolder green fluorescent protein. Nature Biotechnology. 2005;24(1):79–88. doi: 10.1038/nbt1172. [DOI] [PubMed] [Google Scholar]
- 55.Amarasinghe Jayaleka J., D'Hondt Rebecca E., Waters Christopher M., Mantis Nicholas J. Exposure of Salmonella enterica Serovar Typhimurium to a Protective Monoclonal IgA Triggers Exopolysaccharide Production via a Diguanylate Cyclase-Dependent Pathway. Infection and Immunity. 2012;81(3):653–664. doi: 10.1128/IAI.00813-12. [DOI] [PMC free article] [PubMed] [Google Scholar]
- 56.Merritt, J. H., Kadouri, D. E. & O’Toole, G. A. Growing and Analyzing Static Biofilms. Curr. Protoc. Microbiol. 1–29, 10.1002/9780471729259.mc01b01s00.Growing (2005). [DOI] [PMC free article] [PubMed]
- 57.Chiba Akio, Sugimoto Shinya, Sato Fumiya, Hori Seiji, Mizunoe Yoshimitsu. A refined technique for extraction of extracellular matrices from bacterial biofilms and its applicability. Microbial Biotechnology. 2014;8(3):392–403. doi: 10.1111/1751-7915.12155. [DOI] [PMC free article] [PubMed] [Google Scholar]
- 58.Sambrook, J., Fritsch, E. F. & Maniatis, T. Molecular Cloning: A Laboratory Manual, Second Edition. Cold Spring Harbor Laboratory Press (1989).
- 59.Adams, M. Bacteriophages. Bacteriophages 58–12722 (Interscience Publishers, 1959).
- 60.Melo L. D. R., Sillankorva S., Ackermann H.-W., Kropinski A. M., Azeredo J., Cerca N. Isolation and characterization of a new Staphylococcus epidermidis broad-spectrum bacteriophage. Journal of General Virology. 2013;95(Pt_2):506–515. doi: 10.1099/vir.0.060590-0. [DOI] [PubMed] [Google Scholar]
- 61.Aziz Ramy K, Bartels Daniela, Best Aaron A, DeJongh Matthew, Disz Terrence, Edwards Robert A, Formsma Kevin, Gerdes Svetlana, Glass Elizabeth M, Kubal Michael, Meyer Folker, Olsen Gary J, Olson Robert, Osterman Andrei L, Overbeek Ross A, McNeil Leslie K, Paarmann Daniel, Paczian Tobias, Parrello Bruce, Pusch Gordon D, Reich Claudia, Stevens Rick, Vassieva Olga, Vonstein Veronika, Wilke Andreas, Zagnitko Olga. The RAST Server: Rapid Annotations using Subsystems Technology. BMC Genomics. 2008;9(1):75. doi: 10.1186/1471-2164-9-75. [DOI] [PMC free article] [PubMed] [Google Scholar]
- 62.Altschul S. Gapped BLAST and PSI-BLAST: a new generation of protein database search programs. Nucleic Acids Research. 1997;25(17):3389–3402. doi: 10.1093/nar/25.17.3389. [DOI] [PMC free article] [PubMed] [Google Scholar]
- 63.Altschul SF, Gish W, Miller W, Myers EW, Lipman DJ. Basic Local Alignment Search Tool. J. Mol. Biol. 1990;215:403–410. doi: 10.1016/S0022-2836(05)80360-2. [DOI] [PubMed] [Google Scholar]
- 64.Soding J, Biegert A, Lupas AN. The HHpred Interactive Server for Protein Homology Detection and Structure Prediction. Nucleic Acids Res. 2005;33:W244–W248. doi: 10.1093/nar/gki408. [DOI] [PMC free article] [PubMed] [Google Scholar]
- 65.Käll Lukas, Sonnhammer Erik L.L. Reliability of transmembrane predictions in whole-genome data. FEBS Letters. 2002;532(3):415–418. doi: 10.1016/s0014-5793(02)03730-4. [DOI] [PubMed] [Google Scholar]
- 66.Käll Lukas, Krogh Anders, Sonnhammer Erik L.L. A Combined Transmembrane Topology and Signal Peptide Prediction Method. Journal of Molecular Biology. 2004;338(5):1027–1036. doi: 10.1016/j.jmb.2004.03.016. [DOI] [PubMed] [Google Scholar]
- 67.Schattner P., Brooks A. N., Lowe T. M. The tRNAscan-SE, snoscan and snoGPS web servers for the detection of tRNAs and snoRNAs. Nucleic Acids Research. 2005;33(Web Server):W686–W689. doi: 10.1093/nar/gki366. [DOI] [PMC free article] [PubMed] [Google Scholar]
- 68.Klucar Lubos, Stano Matej, Hajduk Matus. phiSITE: database of gene regulation in bacteriophages. Nucleic Acids Research. 2009;38(suppl_1):D366–D370. doi: 10.1093/nar/gkp911. [DOI] [PMC free article] [PubMed] [Google Scholar]
- 69.Naville, M., Ghuillot-Gaudeffroy, A., Marchais, A. & Gautheret, D. ARNold: A Web Tool for the Prediction of Rho-independent Transcription Terminators. RNA Biol., 10.4161.rna.8.1.13346 (2011). [DOI] [PubMed]
- 70.Zuker, M. Mfold Web Server for Nucleic Acid Folding and Hybridization Prediction. Nucleic Acids Res. (2003). [DOI] [PMC free article] [PubMed]
- 71.Stothard P. The Sequence Manipulation Suite: JavaScript Programs for Analyzing and Formatting Protein and DNA Sequences. Biotechniques. 2000;28:1102–1104. doi: 10.2144/00286ir01. [DOI] [PubMed] [Google Scholar]
- 72.Sullivan MJ, Petty NK, Beatson SA. Easyfig: A Genome Comparison Visualizer. Bioinformatics. 2011;27:1009–1010. doi: 10.1093/bioinformatics/btr039. [DOI] [PMC free article] [PubMed] [Google Scholar]
- 73.Wang Yi, Coleman-Derr Devin, Chen Guoping, Gu Yong Q. OrthoVenn: a web server for genome wide comparison and annotation of orthologous clusters across multiple species. Nucleic Acids Research. 2015;43(W1):W78–W84. doi: 10.1093/nar/gkv487. [DOI] [PMC free article] [PubMed] [Google Scholar]
- 74.McNerney R, Wilson S.M, Sidhu A.M, Harley V.S, Al Suwaidi Z, Nye P.M, Parish T, Stoker N.G. Inactivation of mycobacteriophage D29 using ferrous ammonium sulphate as a tool for the detection of viable Mycobacterium smegmatis and M. tuberculosis. Research in Microbiology. 1998;149(7):487–495. doi: 10.1016/s0923-2508(98)80003-x. [DOI] [PubMed] [Google Scholar]
- 75.Jolliffe I. T. Principal Component Analysis. New York, NY: Springer New York; 1986. [Google Scholar]
- 76.Naes, T., Isaksson, T., Fearn, T. & Davies, T. A user Friendly guide to Multivariate Calibration and Classification. (NIR Publications, 2002).
- 77.Savitzky A, Golay MJE. Smoothing and Differentiation of Data by Simplified Least Squares Procedures. Anal. Chem. 1964;36:1627–1639. [Google Scholar]


