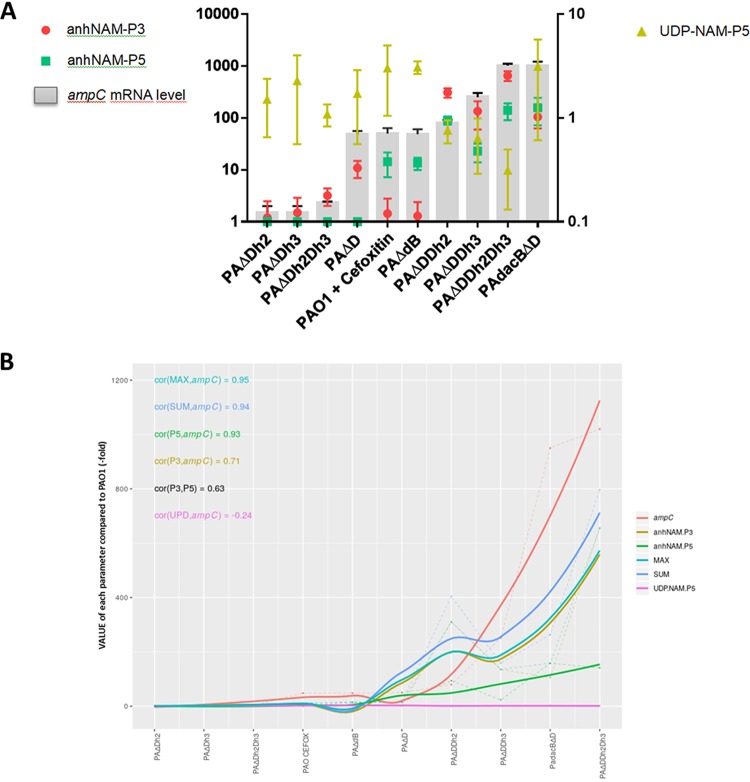
FIG 5.
Model for Pseudomonas aeruginosa AmpC derepression, depicting the variations in the pathways (different mutational routes versus cefoxitin induction) and levels of enzyme production, based on the differential accumulation of muropeptides. (A) The gray bars represent the level of ampC expression obtained from previous works by our group (52, 53, 74), whereas the red circles, green squares, and yellowish green triangles represent the accumulation of anhNAM-P3, anhNAM-P5, and UDP-NAM-P5, respectively, in each strain (always in terms of fold with regard to PAO1, considered 1). The error bars represent the SD. The scale on the right is valid for only UDP-NAM-P5, whereas that on the left is for the other parameters (both are log scales). (B) Smooth Loess curves of the linear regressions between ampC expression and (i) the accumulation of the different independent muropeptides, (ii) the sum of both anhNAM-P3 and anhNAM-P5 (SUM), or (iii) the highest muropeptide of each strain (MAX). The Spearman coefficient for each correlation is shown.

