Mutations in the transcription factors FOXP1 and FOXP2 are associated with speech impairments. FOXP1 is additionally linked to cognitive deficits, as is FOXP4. These FoxP proteins are highly conserved in vertebrates and expressed in comparable brain regions, including the striatum.
Keywords: CAS, developmental verbal dyspraxia, FoxP1, FoxP2, FoxP4, song learning
Abstract
Mutations in the transcription factors FOXP1 and FOXP2 are associated with speech impairments. FOXP1 is additionally linked to cognitive deficits, as is FOXP4. These FoxP proteins are highly conserved in vertebrates and expressed in comparable brain regions, including the striatum. In male zebra finches, experimental manipulation of FoxP2 in Area X, a striatal song nucleus essential for vocal production learning, affects song development, adult song production, dendritic spine density, and dopamine-regulated synaptic transmission of striatal neurons. We previously showed that, in the majority of Area X neurons FoxP1, FoxP2, and FoxP4 are coexpressed, can dimerize and multimerize with each other and differentially regulate the expression of target genes. These findings raise the possibility that FoxP1, FoxP2, and FoxP4 (FoxP1/2/4) affect neural function differently and in turn vocal learning. To address this directly, we downregulated FoxP1 or FoxP4 in Area X of juvenile zebra finches and compared the resulting song phenotypes with the previously described inaccurate and incomplete song learning after FoxP2 knockdown. We found that experimental downregulation of FoxP1 and FoxP4 led to impaired song learning with partly similar features as those reported for FoxP2 knockdowns. However, there were also specific differences between the groups, leading us to suggest that specific features of the song are differentially impacted by developmental manipulations of FoxP1/2/4 expression in Area X.
SIGNIFICANCE STATEMENT We compared the effects of experimentally reduced expression of the transcription factors FoxP1, FoxP2, and FoxP4 in a striatal song nucleus, Area X, on vocal production learning in juvenile male zebra finches. We show, for the first time, that these temporally and spatially precise manipulations of the three FoxPs affect spectral and temporal song features differentially. This is important because it raises the possibility that the different FoxPs control different aspects of vocal learning through combinatorial gene expression or by acting in different microcircuits within Area X. These results are consistent with the deleterious effects of human FOXP1 and FOXP2 mutations on speech and language and add FOXP4 as a possible candidate gene for vocal disorders.
Introduction
Heterozygous mutations of the FOXP2 transcription factor are associated with a speech deficit called developmental verbal dyspraxia (Lai et al., 2001) or childhood apraxia of speech (Morgan and Webster, 2018); FOXP denotes human protein, Foxp rodent, and FoxP all other species (Kaestner et al., 2000). Genes and mRNA are italicized. FOXP1 mutations cause a wider spectrum of impairments, including speech problems (Fisher and Scharff, 2009; Bacon and Rappold, 2012; Siper et al., 2017; Sollis et al., 2017). A FOXP4 mutation is associated with delayed development, laryngeal hypoplasia, and feeding problems (Charng et al., 2016). FOXP1/2/4 are expressed in diverse brain regions, including the striatum (Bowers and Konopka, 2012). The striatum in patients carrying FOXP2 mutations differs structurally and functionally from that of their unaffected siblings (Watkins et al., 2002; Liégeois et al., 2003). FoxP1/2/4 are also expressed in the striatum of mice and other vertebrates (Shu et al., 2001; Ferland et al., 2003; Takahashi et al., 2003, 2008a,b; Haesler et al., 2004; Teramitsu et al., 2004; Bonkowsky and Chien, 2005; Takahashi et al., 2009; Mashiko et al., 2012; Mendoza et al., 2015; Spaeth et al., 2015). In mice carrying a mutant allele of Foxp2, similar to one reported in patients, synaptic plasticity in striatal and cerebellar circuits is impaired and ultrasonic vocal communication is altered (Groszer et al., 2008; Castellucci et al., 2016; Chabout et al., 2016). While the latter may also be due to the crucial functions of Foxp2 in the development of craniofacial cartilage (Xu et al., 2018), striatal-specific deletion of Foxp2 (French et al., 2019) causes mice to execute rapid motor sequences more variably, emphasizing the importance of the striatum for fine control of motor behaviors. Together, these findings implicate the striatum as an important site of integrated FoxP1/2/4 neural function.
We study FoxP function in songbirds because birdsong and speech share many features (Doupe and Kuhl, 1999). Both are learned during critical developmental periods through auditory-guided vocal imitation. Speech learning in people and song learning in birds are constrained by innate predispositions and are also strongly affected by social factors. Birdsong and speech depend on analogous neural pathways that are functionally lateralized (Petkov and Jarvis, 2012; Pfenning et al., 2014). Thus, songbirds provide a genuine model for behavioral, neural, and molecular analyses of genes relevant for vocal communication (Bolhuis et al., 2010).
In zebra finches, FoxP2 expression levels in Area X, the striatal song nucleus required for learning, discrimination, and maintenance of song (Sohrabji et al., 1990; Scharff and Nottebohm, 1991; Scharff et al., 1998; Aronov et al., 2008), vary with age and singing activity (Haesler et al., 2004; Miller et al., 2008; Teramitsu et al., 2010; Thompson et al., 2013; Adam et al., 2016). Experiments disrupting the dynamic regulation of FoxP2 impair song learning, social modulation of song variability, and dopamine-sensitive signal transmission through the cortical-basal ganglia-thalamic forebrain song circuit (Haesler et al., 2007; Murugan et al., 2013; Day et al., 2019). In Area X, FoxP2 is expressed in medium spiny neurons (MSNs) and can dimerize and oligomerize with FoxP1 and FoxP4 (Mendoza et al., 2015; Mendoza and Scharff, 2017). In cell culture, FoxP proteins of mice (Li et al., 2004) and humans (Estruch et al., 2018) also dimerize. Dimerization may also be important for the phenotype of human FOXP mutations (Mizutani et al., 2007; Sollis et al., 2016, 2017).
In summary, FoxP2 in humans and songbirds is clearly relevant for vocal communication. Given the recent implications of FoxP1 and FoxP4 in related phenotypes and the coexpression of all three FoxPs and their molecular interaction, we hypothesized that FoxP1 and FoxP4 in Area X are also relevant for song behavior. To address this, we experimentally downregulated either FoxP1 or FoxP4 in zebra finch Area X and compared the resulting song phenotypes with the previously described inaccurate and incomplete song learning after FoxP2 knockdown (kd).
Materials and Methods
Subjects
All experiments were performed in accordance with the guidelines of the German governmental law (TierSchG). Sixty male zebra finches (Taeniopygia guttata) were used in this study under the project approved by the Landesamt für Gesundheit und Soziales G0117/12. Animals were housed under a 12 h:12 h light/dark cycle with food and water provided ad libitum. Birds were noninvasively sexed by PCR of sex-specific genes between 7 and 14 post-hatch days (PHD) (Adam et al., 2014).
Generation of lentiviruses against zebra finch FoxP1 and FoxP4
Short hairpins against FoxP1 and FoxP4 were generated as described for FoxP2 (Haesler et al., 2007). The structure of the linear DNA encoding shRNA hairpins was sense-loop-antisense. The sequence of the loop was GTGAAGCCACAGATG. We tested the sequence specificity of 14 short hairpins against FoxP1 and 11 short hairpins against FoxP4 (the target sequences for FoxP1 short hairpins are as follows: FoxP1-sh1 GAACAGTATACCTCTATAC, FoxP1-sh2 GTGCATGTCAAAGAAGAAC, FoxP1-sh3 CCATTAGACCCAGATGAAA, FoxP1-sh4 CGGGAGTGACAGCAGTCCA, FoxP1-sh5 CCCACACGCCTCAACTAAT, FoxP1-sh6 TCCCACTCTGGGCAATTTA, FoxP1-sh7 GGCCCACTATCCTTAGTGA, FoxP1-sh8 ACATACAGACCAGCCACAC, FoxP1-sh9 GATCAGTGGTAACCCTTCT, FoxP1-sh10 GACCTCCTTAATCATCAAC, FoxP1-sh11 ATCCCACTCTGGGCAATTT, FoxP1-sh12 TGGAGCATACGAACAGTAA, FoxP1_sh13 AGAAGAACCATTAGACCCA and FoxP1sh-14 TGAAGGCCCACTATCCTTA; and the target sequences for FoxP4 short hairpins are as follows: FoxP4-sh1 CCAGAATGTGACGATCCCC, FoxP4-sh2 CGTGCACGTGAAGGAGGAG, FoxP4-sh3 TGTGACGATCCCCGACGAC, FoxP4-sh4 GAATGTGACGATCCCCGAC, FoxP4-sh5 GCTTGCACAGAATCACGAG, FoxP4-sh6 GGAGGAGCTCGGAGAAGTT, FoxP4-sh7 GTTCTGCACCCCCATCTCT, FoxP4-sh8 ATATGATTTCAGGACTCGG, FoxP4-sh9 GAGCACTTCGGACACGTTT, FoxP4-sh10 GCACTTAATGCAAGTTACC and FoxP4-sh11 GCCCCACCATGATCAACAC). To do so, we overexpressed in HeLa cells each short hairpin with FoxP1, FoxP2, or FoxP4. All FoxP overexpression constructs were cloned from adult zebra finch brain cDNA and tagged with the Flag epitope (Mendoza et al., 2015). To identify short hairpins that strongly reduce the level of FoxP1 or FoxP4 protein, respectively, we performed Western blot analysis using a Flag antibody (Flag-M2 Sigma-Aldrich, catalog #F3165, RRID:AB_259529, previously Stratagene). We then tested whether the short hairpins that reduced FoxP1 and FoxP4 protein levels cross-reacted with the other FoxP members. Only short hairpins that strongly reduced FoxP1 or FoxP4 but did not cross-react with the other FoxP subfamily members were used for further experiments. We used β-actin as loading control for all Western blots (detected with antibody, Sigma-Aldrich, catalog #A5441, RRID:AB_476744). The DNA fragments encoding the hairpins that strongly reduced the levels of FoxP1 or FoxP4 were subcloned into a modified version of the lentiviral expression vector pFUGW containing the U6 promoter to drive their expression. As a control, we used the previously described nontargeting hairpin (Control-sh, sequence AATTCTCCGAACGTGTCACGT) cloned into the modified pFUGW (Haesler et al., 2007). All viral constructs expressed GFP under the control of the human ubiquitin C promoter. Recombinant lentivirus was generated as described previously (Haesler et al., 2007). Titers of virus solution were usually in the range of 1–3 × 10⁶ IU/μl.
Stereotaxic neurosurgery
Birds subsequently used for song analysis were injected with one of the different lentiviral vectors: for example, one of the three FoxP1 kd constructs, one of the two FoxP4 kd constructs, or the control constructs (Haesler et al., 2007). Injections were performed as described previously (Haesler et al., 2007; Adam et al., 2016). Briefly, at PHD 23, birds were injected bilaterally with ∼200 nl each into 8 sites per Area X (Fig. 1a,b). Injection side, order, and the type of construct were randomized. To determine kd efficiency via qRT-PCR (see below), we injected additional birds into Area X in one hemisphere with the vector carrying one of the different kd constructs, and Area X of the other hemisphere with a nonsilencing Control-sh construct (Fig. 1a,b) (Haesler et al., 2007).
Figure 1.
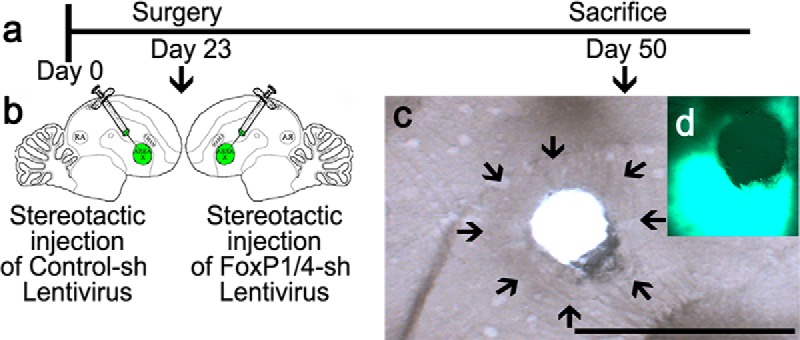
Timeline of FoxP1 and FoxP4 qPCR quantification using lentiviral-mediated RNAi in vivo. a, b, Twenty-three-day-old birds were bilaterally injected into Area X. One hemisphere received a Control-sh virus, the other hemisphere a sh-kd virus against FoxP1 (FoxP1-sh2 or FoxP1-sh3) or against FoxP4 (FoxP4-sh1 or FoxP4-sh2). After surgery, birds were kept with their parents until PHD 50. Brains were extracted, frozen, and stored at −80°C. The 200 μm slices were cut by cryostat, and Area X microbiopsies were punched (c) and stored at −80°C for subsequent mRNA extraction. Correct targeting was assessed by PFA, fixing the slices from which punches were taken and assessing GFP expression in the surrounding tissue (d) and determining the location of Area X by phase contrast (c, arrows). Scale bar 2 mm.
Quantification of FoxP1 or FoxP4 mRNA kd efficiency
To test whether FoxP1 or FoxP4 contributes to song learning in zebra finches, the levels of both genes were reduced separately in Area X in vivo, using lentivirus-mediated RNA interference (RNAi; FoxP1-sh2/3 or FoxP4-sh1/2). The rationale and overall procedure followed previously published protocols (Haesler et al., 2007; Adam et al., 2016). Briefly, 6 birds for each FoxP for follow-up by qRT-PCR were transferred to their home cages after surgery and grew up in the presence of their biological parents and siblings. All birds were killed at 50 ± 2 PHD and did not sing for 2 h before it (Fig. 1a). Each hemisphere was embedded in Tissue-Tek OCT compound in a mold and immediately shock-frozen in liquid nitrogen or dry ice and stored at −80°C. Brains were cut by cryostat as described previously (Olias et al., 2014; Adam et al., 2016). Microbiopsies (0.5–1.5 mm diameter and 200 μm thickness) of Area X from both hemispheres were excised and stored individually at −80°C (Fig. 1c). Remaining sections were stored in 4% (w/v) PFA/PBS solution and used to verify successful targeting and to assess the location of GFP signal in the surroundings of the punched out Area X (Fig. 1d). Punches made inside Area X were pooled for each hemisphere and bird. For the RNA extraction from these small amounts of tissue (approximating 1 mm3 per hemisphere), we used 200 μl of TRIzol (Thermo Fisher Scientific) for each punch. To digest the remaining DNA, we used Turbo DNase (Ambion) following the manufacturer's instructions. cDNA synthesis was performed using random hexamer primers and 100 ng total RNA of the combined microbiopsies of each bird. Reverse-transcriptase-free reactions were included to control for genomic DNA contamination. All cDNAs were diluted with nuclease-free water (fivefold for individual microbiopsies).
For the quantification of FoxP1 and FoxP4 mRNA expression levels in Area X of kd animals, we used the real-time PCR system Mx3005P and the MxPRO qPCR program (Stratagene; Agilent Technologies). qRT-PCRs were run in triplicates in a total reaction volume of 25 μl as described previously (Olias et al., 2014; Adam et al., 2016). The efficiency of all primer pairs ranged from 2 ± 10%. We used the following primer pairs: FoxP1 (5′ CGTTAAAGGGGCAGTATGGA 3′/5′ GCCATTGAAGCCTGTAAAGC 3′), FoxP4 (5′ TGACAGGGAGTCCCACCTTA 3′/5′ AGCTGGTGTTGATCATGGTG 3′), HMBS (5′ GCAGCATGTTGGCATCACAG 3′/5′ TGCTTTGCTCCCTTGCTCAG 3′) (Haesler et al., 2007), and GFP (5′ AGAACGGCATCAAGGTGAAC 3′/5′ TGCTCAGGTAGTGGTTGTCG 3′) (Adam et al., 2016, 2017). Reactions were run with the following times and temperatures: 10 s at 95°C followed by 40 cycles of 30 s at 95°C, 30 s at 65°C, and 30 s at 72°C (60°C for HMBS and FoxP1); and a melting curve to check for amplification specificity. The mean cycle threshold (Ct) for each sample was derived from the run data and used to calculate relative gene expression for the gene of interest (FoxP1 or FoxP4). We used HMBS as a reference gene, as it is the most stable of all tested potential reference genes for our experiments (Haesler et al., 2007; Adam et al., 2016, 2017). Relative expression values were averaged per animal and hemisphere. Only cDNA from GFP-positive biopsies in both hemispheres were used to measure the expression of FoxP1 or FoxP4 and HMBS. Data were normalized by setting the Control-sh hemisphere to 100%.
Quantification of the percentage of targeted neurons
Because it is not possible to verify the efficiency of kd via qPCR from microbiopsies of Area X and to simultaneously determine the percentage of infected neurons histologically in the same animals, we checked the percentage of neurons infected in 3 additional animals. To do so, we quantified the number of MSNs in Area X that were infected by the Control-sh virus (GFP). We assessed the number of MSN by FoxP1 immunoreactivity (Abcam, FoxP1 mouse monoclonal, ab32010; RRID:AB_1141518) because we previously determined that FoxP1 mostly colocalizes with FoxP4 in Area X neurons (Mendoza et al., 2015), and because the FoxP4 antibody used in this study did not work in perfused brains. Sections were analyzed with a 40× oil objective on an Axiovert 200M Digital Research Microscopy System (Carl Zeiss). The Slidebook Digital Microscopy software package (Intelligent Imaging Innovations) was used for fluorescence image acquisitions. Per Area X in each hemisphere, we acquired 4 images at 40× magnification using the AxioVision 4.6 program and manually counted all neurons in which GFP and FoxP1 immunofluorescence colocalized.
Quantification of the volume of Area X infected in birds whose song was analyzed
Birds were overdosed with isoflurane (Forane-ABBVIE, B5068) and subsequently perfused with 4% PFA/PBS. Brains were dissected and postfixed overnight in 4% PFA/PBS. Brains were sagitally sectioned at 40 μm thickness with a vibratome (Leica Microsystems) and sections stored in PBS at 4°C in the dark. Every fourth slice was stained with AChE (Karnovsky and Roots, 1964) to visualize and measure the size of Area X. Sections were mounted on Chromalum (Chromium(III) potassium sulfate)/gelatin-coated slides and embedded with Mowiol (6 g glycerin, Merck; 1.04092.1000; 2.4 g Mowiol 488; Calbiochem; 475904; and 12 ml 0.2 m Tris-HCl, pH 8.5). The remaining sections were stored in cryoprotectant and stored at −20°C. To calculate the targeted area, we quantified Area X as well as the GFP-targeted area using ImageJ following the previously described procedure (Tramontin et al., 1998).
Song tutoring, recording, and analysis
Tutoring.
Juveniles were raised in their respective family cohorts until PHD 20. Between PHD 20 and PHD 30, the adult male was removed to prevent song exposure before tutoring (Roper and Zann, 2006). After surgery at PHD 23, birds were returned to their home cages with their mother and sibling females and remained there until PHD 30. Subsequently, each experimental juvenile was tutored by 1 adult male in a sound-isolated recording box because, under these conditions, the pupil learns to produce a song that most resembles the song of his tutor (Tchernichovski and Nottebohm, 1998). Song was recorded continuously throughout this period using Sound Analysis Pro (SAP) (Tchernichovski et al., 2000). A day before death (at PHD 95 or later), a minimum of 50 motifs (for definition, see next paragraph) of undirected singing from the experimental bird was recorded in the absence of the tutor for up to 5 d for subsequent bioacoustic analysis (Fig. 2). To be able to directly compare the effects of experimental reduction of FoxP1 or FoxP4 in Area X on song development to those of FoxP2, we analyzed the recordings obtained in this study (FoxP1, FoxP4) and reanalyzed the recordings from Haesler et al. (2007) using the same bioacoustic parameters for all groups. This modus operandi served to minimize experimenter-induced variability and also to assess replicability of the present data and those of the two previous reports on developmental song deficits as a consequence of FoxP2 kd in Area X (Haesler et al., 2007; Murugan et al., 2013).
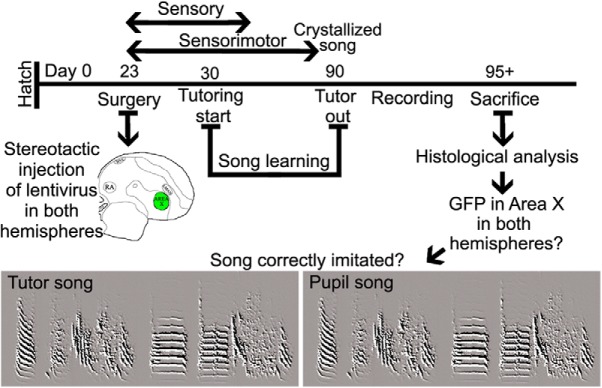
Figure 2.
Timeline of FoxP1 or FoxP4 kd in Area X and vocal learning success. In the first 2 weeks after hatching, the birds were sexed. On day 23, at the beginning of the sensory learning period, Control-sh, FoxP1-sh2/3, or FoxP4-sh1/2 virus was bilaterally injected into Area X of male zebra finches. From day 30 on, injected birds were housed in sound-recording chambers together with an adult male zebra finch as a tutor. After reaching 90 d of age, the tutor was removed and adult song was recorded. Before song analysis, we verified correct targeting by analysis of GFP expression in in Area X of both hemispheres.
Song terminology.
Zebra finch song is individual-specific and consists of a series of acoustically distinct elements (3–9 in this study) separated by silent gaps. The song elements are arranged in a repeated order, called “motif.” The order of song elements can slightly vary, resulting in slightly different motifs. The most frequently sung motif is the “typical” motif.
Analysis of motif imitation.
We quantified how well pupils copied the motif of their tutor using a similarity score and an accuracy score obtained in SAP from 10 asymmetric pairwise comparisons of the pupil's typical motif with the tutor motif, as described previously (Haesler et al., 2007). We analyzed undirected song of birds after they had reached 90 d, when the major aspects of song are well learned, even though some aspects of song continue to mature further into adulthood (Williams, 2004; Glaze and Troyer, 2013). SAP analyzes the acoustic features of song along multiple dimensions and provides “similarity” values, a measure for the amount of song material copied by the pupil and “accuracy” values that indicate how well the copied song material is imitated. To get a comprehensive view of how well pupil and tutor motifs matched acoustically, we compared 10 motifs each of Control-sh with FoxP1-sh, FoxP2-sh, and FoxP4-sh birds to their tutors using SAP M × N batch processing and asymmetric (used for songs of different birds) comparison, resulting in 100 independent comparisons (FoxP2-sh audio files from Haesler et al., 2007).
Song analysis.
We investigated different aspects of pupils' song learning success and song performance. (1) How many song elements of the tutor did the pupil imitate? (2) How many elements of a pupil's song were not part of the tutor's song? Pupils' song can contain elements that are sufficiently different from the tutor's song to not be recognized as an imitated element by SAP. (3) How accurate was the imitation of pupils' song elements? (4) How variable was the performance of individual song elements of pupils compared with variability of tutors? (5) How stereotyped was the sequential delivery of multiple song motifs of pupils' songs compared with the stereotypy of tutors? Did pupils repeat elements (“stutter”)? (6) How were the durations of song elements and the interelement intervals (“gaps”) distributed in the tutors' and pupils' songs? (7) Did the delivery of multiple song motifs of pupils differ in their isochronous rhythmic structure from that of their tutors?
To address 1–3, we compared each song element of the tutor to all song elements of the pupil with a symmetric M × N batch analysis in SAP. The element of a pupil with the highest similarity and accuracy score (in SAP) to an element of the tutor was considered imitated and thus “shared” by tutor and pupil. When two pupil elements had similar scores to an element of the tutor, we also took the order within the motif into consideration. The scores of shared elements between tutor and pupils ranged between 70 and 100 in similarity or accuracy comparisons. To assess whether FoxP-sh birds imitated fewer elements of their tutors than Control-sh birds, we quantified the number of elements shared by tutor and pupil and expressed this as the fraction of all elements specific to the tutor. A value of 1 indicates that all tutor elements were found in the pupil's song. As the value approaches 0, increasingly fewer elements of the tutor are represented in the pupils' songs. The fraction of elements the pupils sang that were not found in the tutor's song was expressed as the number of elements unique to the pupil divided by the total number of elements of the tutor. A value of 0 reflects that there are no different or additional elements in the pupil's song.
(4) Element delivery.
To assess the rendition-to-rendition variability in element performance, we chose 32 motifs randomly, took 10 of each of the elements of the typical motif from tutors and pupils, and measured the similarity and accuracy in a symmetric M × N batch analysis. We thus compared how similar to itself an element was in each rendition of a song of a pupil to the self-similarity of an element in the tutor song. Results of these comparisons between elements are expressed in a single measure, which is the product of similarity and accuracy to obtain the element identity score as reported by (Haesler et al., 2007).
(5) Stereotypy of song performance and stuttering.
Stereotypy is a measure that addresses whether the bird sings the same order of elements each time. We quantified stereotypy as described previously (Scharff and Nottebohm, 1991) from the same 32 randomly chosen motifs used to quantify element performance (see above) of each bird. Stereotypy scores range between 0 and 1, with 1 reflecting that the birds sang the same sequence of elements in the same order in all 32 motifs. Lower scores indicate more sequence variability in a motif from rendition to rendition. We also quantified the propensity of birds to repeat song elements. To facilitate comparability to a previous study on stuttering in adult zebra finches following neurotoxic Area X lesions (Kubikova et al., 2014), we used the same criteria to quantify “stuttering.” Accordingly, we calculated the percentage of all elements sung by each bird that were part of a stuttering bout, that is, a string of successive elements of the same type (e.g., AA). We included in this analysis repetitions of the last element of a motif if that element was connected to the motif by a short silent gap of stereotyped duration.
(6) Duration of song elements and silent gaps.
We measured the overall distribution of all durations of song element and interelement intervals (“gaps”) from 48 ± 24 (mean ± SD) song motifs per bird. We then compared the distributions of element and gap durations between pupils and tutors, using the Jensen-Shannon distance (JSD) (the square root of the Jensen-Shannon divergence) as a dissimilarity metric between the two probability distributions (Lin, 1991; Endres and Schindelin, 2003; Sasahara et al., 2015). To estimate how similar/dissimilar song element and gap durations between two groups of untreated adult zebra finches are, we also compared the distributions of element and gap durations of a cohort of 15 adult males that were analyzed previously by Norton and Scharff (2016) to the tutors of the current study. To quantify the similarity in shape of the distributions of the gap duration independently of their position on the x axis (i.e., their absolute duration), we shifted the tutor distribution in 2 ms steps and calculated the JSD between the lagged tutor distribution and the stationary pupil distribution for each step (bin size 2 ms). We report the JSD and the lag at which the JSD was minimal.
(7) Rhythm analysis.
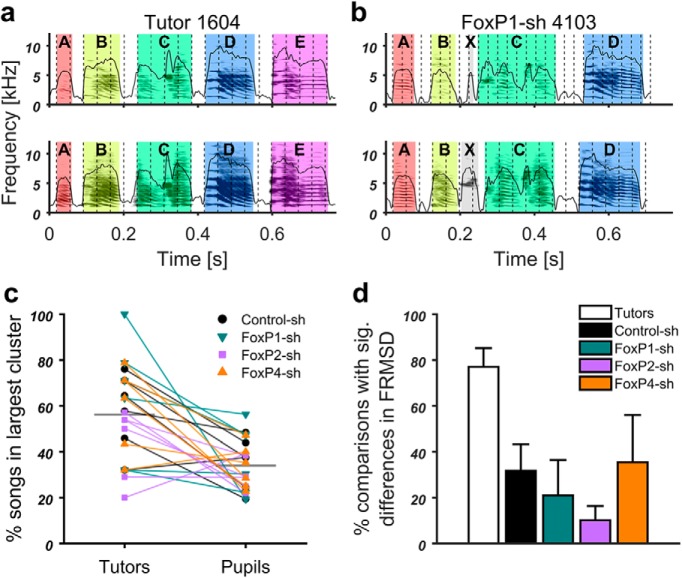
We determined the isochronous pulse that best fit to the song element onsets of each of the motifs used for duration analysis (above) using the method described previously (Norton and Scharff, 2016; Ravignani and Norton, 2017). The frequencies of the best fitting pulses for all songs of each bird were clustered (for details, see Norton and Scharff, 2016), and the percentage of songs in the largest cluster of each bird was determined. The higher this percentage is, the more songs have a similar pulse frequency. The largest frequency clusters of all tutors lay in a range from 20 to 60 Hz. To compare the rhythmicity of the pupil songs with that of the tutors, we restricted the pulses to this frequency range. Pulse fit was quantified as the root-mean-square of the deviations of each song element onset to its nearest pulse, multiplied by the pulse frequency (frequency-normalized root-mean-square deviation [FRMSD]). To assess whether the rhythmic regularity (i.e., pulse fit) could just be a byproduct of zebra finch specific song element and gap durations independent of the birds' individual song elements and their order, we compared each bird's song rhythm with the rhythm of artificial model songs. The latter had an identical number of song elements and identical sequence, but different randomized element and gap durations (“Model C” in Norton and Scharff, 2016). For each song of 1 bird, a model song was created, the best fitting pulse for that song determined, and the pulse deviation (FRMSD) between all songs of 1 bird and their respective model songs tested for a significant difference in a linear model. This process was repeated 50 times with different randomized element and gap durations in the model songs. Of the comparisons that detected a significant difference in FRMSD (p < 0.05), the percentage of these comparisons in which the bird songs had a lower FRMSD (i.e., a better pulse fit and therefore a higher degree of isochronous organization of their song rhythm) is reported here (see Fig. 13d).
Figure 13.
All pupil groups had lower song isochronicity than tutors. a, b, Two example motifs each of FoxP1-sh bird 4103 (b) and its Tutor bird 1604 (a) with the isochronous pulse best fitting to song element onsets overlaid as vertical dashed lines. a, Tutor bird 1604 had almost the same pulse frequency for both renditions (top: 27.49 Hz; bottom: 27.64 Hz). Pulse fit as measured by FRMSD from element onsets (see Materials and Methods) was relatively high (top: FRMSD = 0.019; bottom: FRMSD = 0.024). b, FoxP1-sh bird 4103 had pulses of different frequencies best fitting the two motifs (top: 39.91 Hz; bottom: 27.92 Hz) and a relatively low pulse fit (top: FRMSD = 0.086; bottom: FRMSD = 0.086). c, Paired plot of the percentage of all songs that were in the largest pulse frequency cluster for each bird. Lines connect each pupil (right) with his tutor (left). Black horizontal lines indicate the mean. Except for 3 birds (1 Control-sh, 1 FoxP2-sh, 1 FoxP4-sh), all pupils had a lower percentage compared with their tutor. d, Bar graph of the percentage of bird-to-model comparisons with significant differences (p < 0.05) in pulse deviation (FRMSD), in which the bird had a lower deviation (±SEM) than the model (i.e., a better rhythm).
Linear discriminant analysis.
To test whether the four groups (FoxP1-sh, FoxP2-sh, FoxP4-sh, and Control-sh) could be discriminated by differences in their song phenotype alone, we performed a linear discriminant analysis. Discrimination success was evaluated by prediction of the treatment group of each bird through leave-one-out cross-validation. To do so, one individual after another was removed from the set, and the discriminant functions were calculated each time and used to classify the missing individual.
Statistics.
All statistical tests were performed using the data analysis software R (R Development Core Team 2013) and/or Prism 4.0 (GraphPad). All graphs were prepared with Prism 4.0 (GraphPad Software), MATLAB 2016b (The MathWorks), or R (R Development Core Team 2013).
Results
Selection of specific short hairpins to downregulate zebra finch FoxP1 or FoxP4
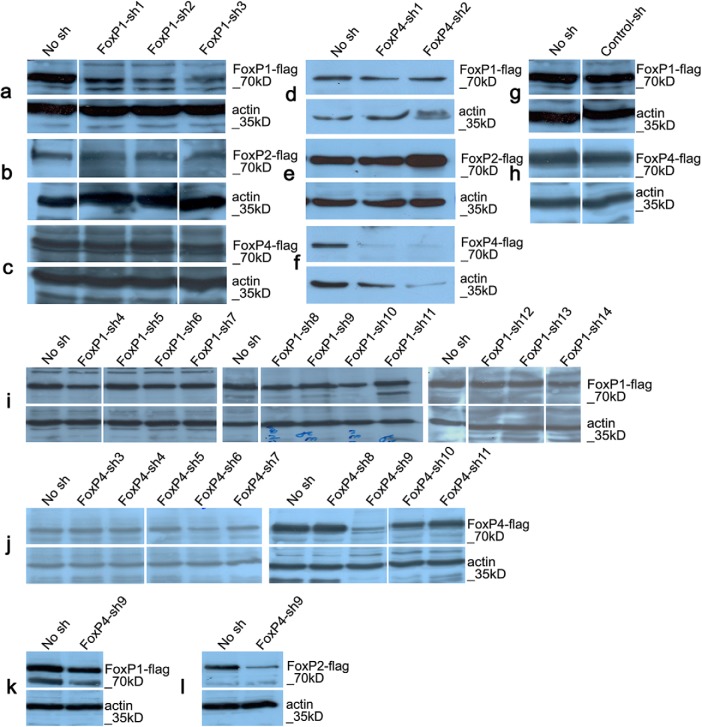
To determine efficacy and specificity of different short hairpins against FoxP1 and FoxP4, we overexpressed FoxP1 or FoxP2 or FoxP4 in HeLa cells. Three (FoxP1-sh1 to FoxP1-sh3) of the 14 FoxP1 short hairpins tested strongly reduced FoxP1 protein levels (Fig. 3a) but did not affect the expression of FoxP2 (Fig. 3b) or FoxP4 (Fig. 3c). This is interesting because the FoxP1-sh2 differed only at 2 nt from the FoxP2 gene and at 5 nt from the FoxP4 gene, whereas FoxP1-sh1 and FoxP1-sh3 ranged from 57% to 63% in sequence similarities to the other FoxP members. The FoxP1-sh1 was less efficient in reducing the expression of the protein than FoxP1-sh2 and FoxP1-sh3 and was therefore not used further in this study. None of the other short hairpins for FoxP1 tested (FoxP1-sh4 to FoxP1-sh14) strongly reduced the levels of FoxP1 and were not further used (Fig. 3i).
Figure 3.
Western blots showing specific downregulation of FoxP1 or FoxP4 using short hairpins (sh). Overexpression of zebra finch FoxP1 (a,d,g,i,k), FoxP2 (b,e,l), or FoxP4 (c,f,h,j), each tagged with a Flag-epitope, and one of different hairpin constructs against FoxP1 (FoxP1-sh1 to FoxP1-sh3, a–c; and FoxP1-sh4 to FoxP1-sh14, i), or FoxP4 (FoxP4-sh1 to FoxP4-sh2, d–f; and FoxP4-sh3 to FoxP4-sh11, j–l), or control short hairpin (g,h) in HeLa cells. Western blot analysis using the Flag antibody (a–l, top) revealed that short hairpins FoxP1-sh1–3 against FoxP1 (a–c) efficiently reduced FoxP1 levels (a, top) but did not downregulate FoxP2 (b) or FoxP4 (c). All remaining short hairpins of FoxP1 (FoxP1-sh4–14) did not reduce FoxP1 levels efficiently (i, top) and were not tested for cross reactions against FoxP2 or FoxP4. Short hairpins FoxP4-sh1–2 against FoxP4 efficiently reduced FoxP4 levels (f, top) but did not downregulate FoxP1 (d) or FoxP2 (e), from the remaining short hairpins (j, top). Only FoxP4-sh9 did efficiently reduce the levels of FoxP4 protein (j, top); but when tested against FoxP1 (k, top) and FoxP2 (l, top), we found that it reduced efficiently the protein levels of FoxP2 (l, top) and therefore not further used. The control short hairpin did not downregulate FoxP1 (g) or FoxP4 (h). Immunostaining with actin antibody shows comparable loading of protein samples in all cases (a–l, bottom). a–c, g, h, Western blots were run in the same membrane; but due to different loading order, some were cut to arrange them in the same order for all panels. i, j, Western blots were run in different gels and membranes; therefore, we show the “no short hairpin” (no sh) condition for each gel and membrane; and due to different loading order, some were cut to arrange them in a coherent order without repetitions.
Three short hairpins strongly reduced FoxP4 protein levels (FoxP4-sh1, FoxP4-sh2, and FoxP4-sh9) (Fig. 3f,j). The sequences of FoxP4-sh1 and FoxP4-sh2 were 23%–71% similar compared with the other FoxP subfamily members and did not alter the expression of FoxP1 (Fig. 3d) or FoxP2 (Fig. 3e). We used both for further studies. In contrast, the FoxP4-sh9 did not crossreact with FoxP1 (Fig. 3k) but crossreacted strongly with FoxP2 (Fig. 3l) despite a low similarity of 61% (8 nt difference).
In a previous study (Haesler et al., 2007), a nontargeting short hairpin control (Control-sh) was shown not to affect FoxP2 expression. We used the same Control-sh in this study and showed that it did not alter the expression of either FoxP1 (Fig. 3g) or FoxP4 (Fig. 3h).
Efficacy of cellular infection by lentivirus in Area X
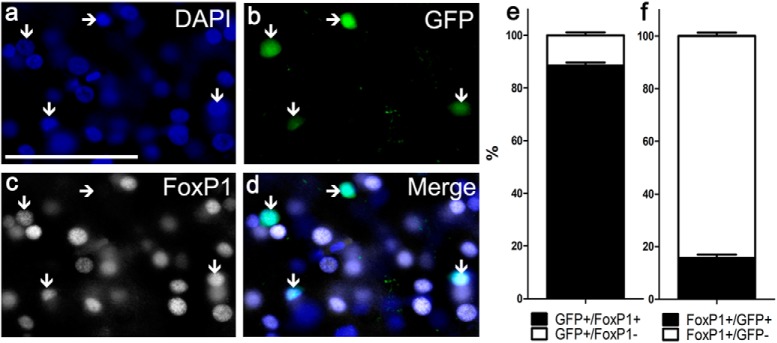
To assess how many MSNs in Area X can be infected on average, we injected GFP-expressing control virus stereotaxically into Area X of three 23-d-old birds and at PHD 50 quantified the number of cells in which the GFP signal was colocalized with FoxP1 immunoreactivity (Fig. 4a–d). We chose FoxP1 because most MSNs in Area X express FoxP1, either in combination with FoxP2 and/or FoxP4 or alone (Mendoza et al., 2015); 89% of GFP-positive cells were also immunoreactive against FoxP1 (Fig. 4a–e), consistent with previous studies (Wada et al., 2006; Haesler et al., 2007). Of the total FoxP1-expressing neuron population in Area X, on average 16% of the cells also expressed GFP, indicating virus infection (Fig. 4a–d,f).
Figure 4.
Efficacy of infection. Quantification of Area X MSNs at PHD 50-expressing GFP as a result of virus injection (control short hairpin) at PHD 23. Photomicrograph at 40× magnification shown in a z-stack-projected photo. a, Blue fluorescence of DAPI-stained cell nuclei. b, GFP expression indicating virus-infected cells. c, FoxP1 immunoreactivity revealed by a secondary Alexa-568 antibody (red) false-color-coded in white. d, Overlay with vertical arrows pointing to neurons coexpressing FoxP1 and GFP. Horizontal arrow indicates one GFP-positive cell that does not express FoxP1. e, Infected neurons coexpressing GFP and FoxP1 expressed as a percentage of the total number of GFP-expressing neurons. f, Virus-infected GFP-expressing and FoxP1-immunoreactive neurons expressed as percentage of the total number of FoxP1-expressing neurons. e, f, Error bars indicate mean of means ± SEM. Scale bar: (in a), a–d, 50 μm.
Efficacy of FoxP1 or FoxP4 mRNA downregulation in Area X
We evaluated the reduction of FoxP1 or FoxP4 mRNA expression at PHD 50 by qPCR after injections of the respective kd viruses in Area X of PHD 23 males (Fig. 1a–d). The amount of kd was quantified by comparing FoxP expression in the knocked down hemisphere with the control-injected one, as described previously (Haesler et al., 2007; Olias et al., 2014; Adam et al., 2016, 2017).
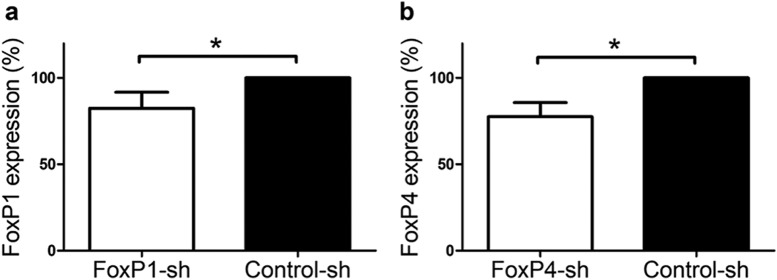
FoxP1 mRNA levels in Area X were on average 20% lower in the hemispheres injected with the kd FoxP1-sh2 or FoxP1-sh3 viruses than in the control-injected hemispheres (Fig. 5a). Comparable results were obtained for FoxP4-sh1 or sh2 and controls (Fig. 5b). In contrast, GFP mRNA levels did not differ statistically between control and kd-injected hemispheres (data not shown), as previously reported (Haesler et al., 2007).
Figure 5.
In vivo downregulation of FoxP1 or FoxP4 in Area X. mRNA levels of FoxP1 (a) or FoxP4 (b) assessed by qRT-PCR in Area X tissue were significantly lower in the FoxP1-sh- or FoxP4-sh-injected hemisphere than in the Control-sh-injected hemisphere of the same animal (Wilcoxon signed rank test, W = −21, p = 0.03, n = 6). *p < 0.05.
Quantification of virus-infected Area X volume
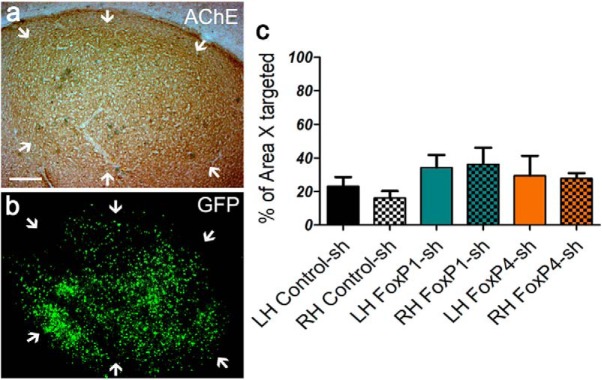
Before analyzing the adult songs of birds that were injected as juveniles with kd viruses in Area X bilaterally, or with corresponding controls, we assessed the percentage of Area X tissue that was infected, as judged by GFP fluorescence in tissue sections, and compared this with the previously published results on FoxP2 (Haesler et al., 2007) (Fig. 6a–c). The volume of the infected area was similar across hemispheres in FoxP1, FoxP4, and control birds (one-way ANOVA; p > 0.05; F = 2.71; df = 2; Fig. 6c). On average, the GFP fluorescence in both hemispheres covered 34.8% of Area X for FoxP1 (SEM 17.16%), 28.6% for FoxP4 (SEM 16.27%), and 19.6% for the controls (SEM 8.92%) (i.e., were in the same range as the 20.4% reported for FoxP2 kd birds) (Haesler et al., 2007).
Figure 6.
Quantification of Area X volume targeted by the viral infection in birds whose song learning was assessed. a, b, Representative photomicrographs of Area X. a, Bright-field photo of a sagittal section stained for AChE delineating Area X (white arrows). Scale bar, 200 μm. b, Same section under fluorescence illumination showing GFP signal. c, Volume of the virus-induced GFP-expressing tissue within Area X, expressed as percentage of total Area X volume in left and right brain hemispheres. Both hemispheres were infected to similar degrees in all groups (average for each hemisphere ± SEM).
kd of FoxP1/2/4 in juveniles affects adult song in multiple ways.
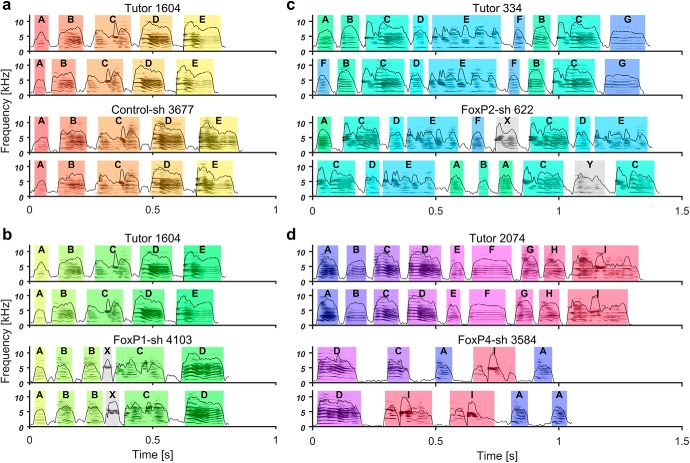
Comparing sonograms from tutors and pupils in the different treatment groups, we noticed striking deficits in the adult songs of pupils that had received FoxP1 or FoxP4 kd injections as juveniles (Fig. 7b,d) in contrast to control-injected birds (Fig. 7a). The song deficits of birds with FoxP1 and FoxP4 kds were partly similar to the ones reported for FoxP2 kds (Haesler et al., 2007), but there were also differences between the FoxP1/2/4 kd animals. To exemplify the type of deficits observed, Figure 7 provides two song motifs each of tutor-pupil pairs per treatment group.
Figure 7.
a–d, Representative sonograms with amplitude envelopes overlaid, illustrating different deficits in the experimental groups (bottom two rows) and their respective tutors (top two rows). Song elements of the same type in each tutor-pupil pair are indicated by the same color and identified by the same letter. The identity of song elements was determined by systematic similarity comparison between pupil and tutor elements using Sound Analysis Pro software (Tchernichovski et al., 2000). Song elements are separated by silent inhalation gaps. a, Control-sh-injected pupil 3677 imitated all elements from his tutor 1604 and delivered them in the same order. b, FoxP1-sh-injected pupil 4103 had the same tutor as the control-injected juvenile in a. In contrast to the Control-sh, the FoxP1-sh pupil did not copy element E, added an element that was not recognized by SAP as matching any tutor element between B and C (highlighted in gray, X), and copied element C less accurately. c, FoxP2-sh-injected pupil 622 copied elements A, B, C, E, and F from the tutor 334, included elements not recognized in the tutor song, and the sequence of elements varied from rendition to rendition. d, FoxP4-sh-injected pupil 3584 only copied elements A, C, D, and I from tutor 2047; the sequence as well as durations of song elements and gaps were altered. Delivery from rendition to rendition was not stereotyped, and elements were repeated often (I, I, A, A in the second example).
The tutor birds (Fig. 7a–d, top two panels) produced the stereotyped song that is characteristic for zebra finches, singing their song elements mostly in the same order in every motif rendition. The Control-sh-injected bird (Fig. 7a, bottom two panels) copied all elements, kept them in the same sequence as the tutor, and sang them consistently from rendition to rendition. This high copy fidelity is typical when one pupil grows up in the presence of one tutor (Tchernichovski and Nottebohm, 1998; Tchernichovski et al., 1999). In contrast, none of the FoxP1/2/4 kd birds copied the songs of their tutors as faithfully. While there were differences in degree and kind between the treatment groups, some song deficits were observed in all kd conditions. For instance, pupil songs were only partly composed of song elements that were recognizable as tutor imitations, whereas other pupil elements could not be matched to the tutor (Fig. 7b,c). Even when elements were clearly imitations of the tutor's elements, the copy fidelity was often lower in kd pupils than in controls (Fig. 7d, element C and I). There was also a higher incidence of pupils not singing the copied song elements in the same order as the tutor (e.g., Fig. 7c,d). Moreover, kd pupils had a higher tendency to repeat the same song element multiple times, resulting in a stutter (e.g., Fig. 7b,d) and to change the order in which song elements were delivered from rendition to rendition (e.g., Fig. 7c,d). The latter was particularly evident in FoxP4 kd pupils, in which we also noted a tendency for atypical timing of song.
Together, visual inspection of sonograms indicated that reduced levels of FoxP1 or FoxP4 in Area X during the song learning phase impaired song along multiple dimensions, mirroring some of the previously described song deficits resulting from FoxP2 kd in Area X (Haesler et al., 2007). Because other features were not seen before and seemed to segregate with the particular treatment group, we analyzed the songs of all FoxP-sh birds and their tutors in more detail.
Similarity of motifs is affected in all FoxP-sh groups, accuracy only in the FoxP2-sh group
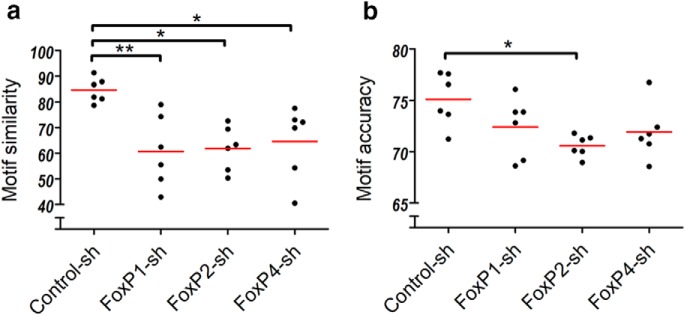
First, we compared all pupils' songs to the songs of their tutors to quantify overall song learning success. Confirming our impression from the visual analysis of sonograms, the SAP similarity scores were significantly lower in all FoxP-sh birds compared with Control-sh animals (Fig. 8a), reflecting the fact that kd birds copied the tutor material incompletely (Fig. 7). Examining the copied portions of the song revealed that lower accuracy of imitation was found more often in birds of the kd groups than in control birds, but this was statistically significant only in the FoxP2-sh group (Fig. 8b).
Figure 8.
Pupils in all three kd groups imitated tutor song incompletely. a, Kruskal–Wallis test, p = 0.0053, Kruskal–Wallis statistic = 12.73. Dunn's Multiple-Comparisons Test: *p < 0.05; **p < 0.005. Only FoxP2-sh pupils are significantly more inaccurate in the imitation fidelity of the copied song material. b, Kruskal–Wallis test, not significant, p = 0.054, Kruskal–Wallis statistic = 7.640. Dunn's Multiple-Comparisons Test: *p < 0.05. Scatter dot plots. Each dot represents the mean similarity or accuracy score for each animal. Red line indicates the mean of means.
Frequency modulation (FM) is altered only in FoxP4-sh birds
More detailed analysis of spectrotemporal features of song at the motif level revealed no significant differences for pitch, goodness of pitch, amplitude modulation, and entropy (data not shown), but FM was significantly higher in the group of FoxP4-sh birds (Fig. 9).
Figure 9.
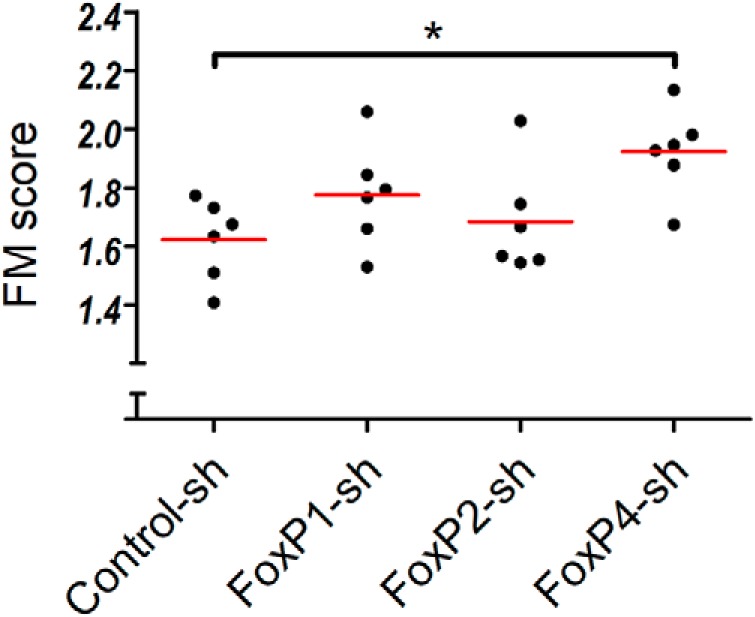
kd of FoxP4 in Area X affected FM (FM). Scatter dot plot. Each dot represents the mean scores of an asymmetric M × N batch comparison between tutor and their respective pupil using SAP. Red line indicates the mean of means (Kruskal–Wallis test, p = 0.0467, Kruskal–Wallis statistic = 7.967). *p < 0.05 (Dunn's Multiple Comparison Test).
kd FoxP1/2/4 copy fewer song elements from their tutors than control birds
To gain further insight into the exact nature of the lower motif imitation success and the reduced accuracy of copying in the different kd groups, we quantified whether pupils (1) copied all tutor elements or improvised/invented some, (2) copied tutor elements accurately, (3) copied the sequential order of tutor elements, (4) copied the duration of tutor elements, and (4) copied the duration of the silent gaps between elements.
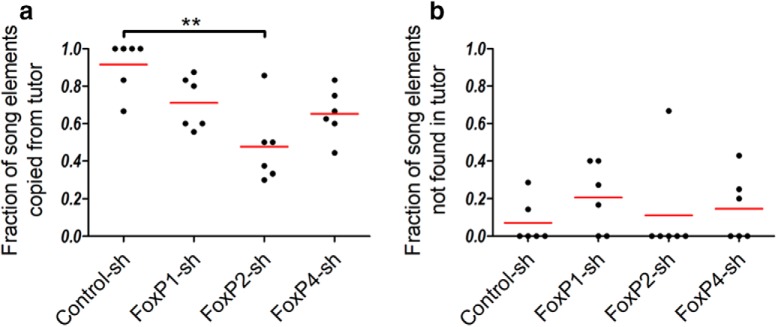
kd animals copied fewer song elements from their tutors than control animals (Fig. 10a). The majority of Control-sh birds copied all elements of the tutor (4 of 6 birds), whereas none of the FoxP downregulation birds copied all elements from their tutors. FoxP2 kd birds copied significantly fewer song elements from their tutors than Control-sh birds (Fig. 10a).
Figure 10.
a, Fraction of pupil elements copied from the tutor. b, Fraction of pupil elements not present in the tutor. FoxP kd birds copied fewer elements than control birds. a, All FoxP kd birds copied fewer elements from their tutors than control birds, FoxP2-sh birds significantly so. Values 0–1 calculated as the number of copied elements by the pupil divided by the total number of elements in the tutors' song (Kruskal–Wallis test, p = 0.0075, Kruskal–Wallis statistic = 11.98). Dunn's Multiple-Comparisons Test: **p < 0.005. b, The song of some pupils in all groups contained elements not matched to any element in the tutors' songs. Values 0–1 calculated as the number of elements in the pupil that are not found in the tutor divided by the total number of elements in the tutor's song (Kruskal–Wallis test, not significant, p = 0.4494, Kruskal–Wallis statistic = 2.640). Dunn's Multiple-Comparisons Test: not significant.
In all experimental and control groups, some song elements could not be matched to any elements present in the tutors' song (Fig. 10b). This was most prominent in FoxP1 kd birds (4 of 6 birds) but also occurred to different degrees in the other groups.
FoxP2/4-sh birds' elements are less self-similar
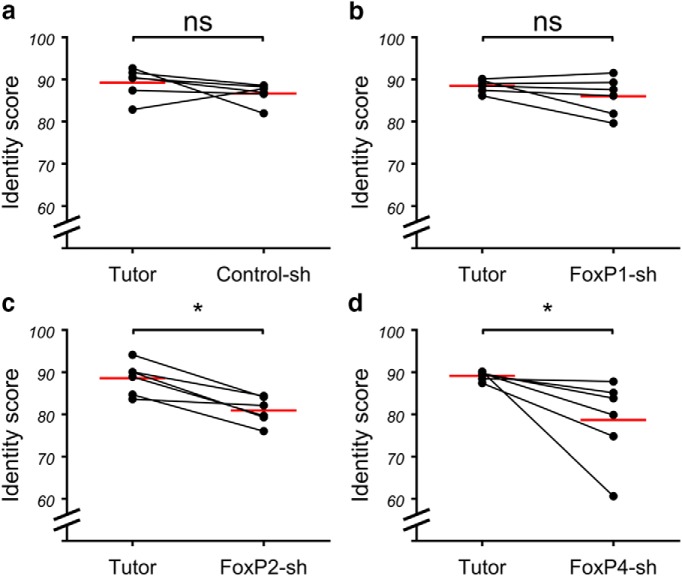
To see how consistently pupils sang the elements from rendition to rendition, we compared the similarity and accuracy of copied elements in 10 renditions of the same element. We multiplied the resulting similarity and accuracy scores and called that product the identity score (Haesler et al., 2007). We found that the identity score between the Control-sh and FoxP1-sh birds did not differ significantly from that of their tutors (Fig. 11a,b). In contrast, the FoxP2-sh and FoxP4-sh birds had a significantly lower identity score of their elements than their tutors (Fig. 11c,d).
Figure 11.
Consistent reproduction of copied song elements was impaired in FoxP2-sh and FoxP4-sh birds. Scatter dot plot. Each dot represents the mean identity score ((similarity × accuracy)/100) for each animal of a symmetric batch M × N analysis of 10 renditions of each element in SAP. Red line indicates the mean of means (Wilcoxon matched pairs signed rank test, FoxP2-sh and FoxP4-sh: p = 0.0313, n = 6, W = 21). *p < 0.05; ns (not significant) p > 0.05.
Sequence stereotypy and stuttering in FoxP-sh birds
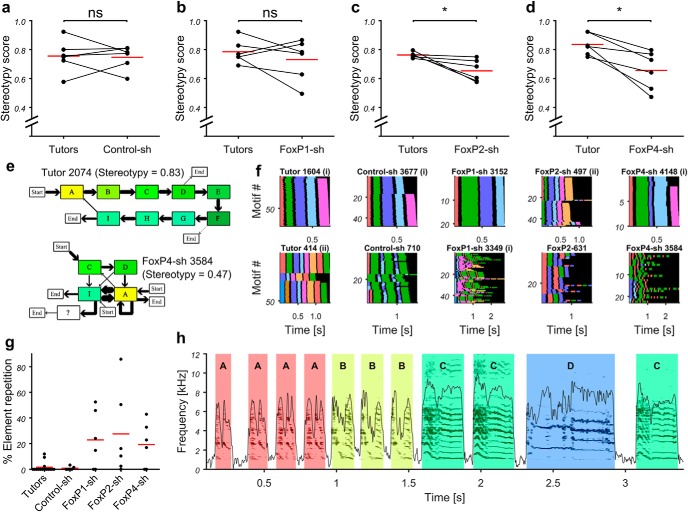
To follow-up our initial impression that some FoxP-sh birds varied the sequence of elements in subsequent motifs more than is typical for zebra finches (Fig. 7b–d), we randomly chose 32 motifs of each bird and calculated a stereotypy score as described previously (Scharff and Nottebohm, 1991). Here a value of 1 means that birds sang the same element sequence in all 32 motifs without any variations, and with increasing sequence variability the stereotypy score approaches 0 (Fig. 12a–d). FoxP2-sh and FoxP4-sh pupils were significantly more variable than their tutors (Fig. 12c–f). In addition, the majority of birds in each of the kd groups repeated song elements, which was rarely the case in the tutor and control groups (Fig. 12g,h). This stuttering-like behavior, measured as the percentage of elements that are part of a stuttering bout (i.e., a string of two or more successive elements of the same type) was most pronounced in FoxP2-sh birds. Four of six birds in each kd group showed an element repetition rate of >10% (none in Control-sh and 1 of 15 tutors) (Fig. 12g). The maximum number of elements in a stuttering bout varied between 2 and 8 (FoxP1-sh: 3–6 elements, n = 4 birds; FoxP2-sh: 2–8, n = 5; FoxP4-sh: 3–5, n = 4; Control-sh: 2, n = 2; tutors: 3–6, n = 3). While the average number of repetitions in the motifs that contained repetitions was comparable between kd birds and the three tutors (FoxP1-sh: 2.66, 2.13–3.19; FoxP2-sh: 3.07, 2.0–6.59; FoxP4-sh: 2.84, 2.06–3.6; Control-sh: 2; tutors: 3.08), such motifs occurred more rarely in tutors and controls (FoxP1-sh: an average of 75.1% of motifs contained repetitions; FoxP2-sh: 56.3%; FoxP4-sh: 58.0%; Control-sh: 5.7%; tutors: 24.6%).
Figure 12.
After FoxP2 and FoxP4 kd, the sequential delivery of song elements was more variable in pupils than in their tutors. In addition, some FoxP1-sh, FoxP2-sh, and FoxP4-sh have a high rate of song element repetitions (stuttering) not found in tutors and control animals. a–d, Paired scatter dot plot. Each dot represents the stereotypy score for 1 animal. Red line indicates the mean. Tutor-pupil pairs are connected by black lines (Wilcoxon matched pairs signed rank test, FoxP2-sh and FoxP4-sh exact rank, p = 0.0313, n = 6, W = 21). e, Sequence diagrams of the songs of FoxP4 kd bird 3584 (bottom) and its tutor 2074 (top). Boxes with letters A to I represent song elements. A song element not found in the tutor song is marked by a question mark. Arrows indicate transitions between subsequent song elements. The size of an arrow is proportional to the relative frequency of occurrence. Arrows that do not originate at a song element mark the start of a song. Arrows that do not point to an element mark the end of a song (e.g., all songs of 2074 start with A and end mostly with I, rarely with D or F). f, Representative examples of sequence variability in 20–50 sequentially sung motifs (y axis), indicated as thin color-coded lines, sorted, and stacked. The duration of each song elements is indicated by one color, song elements of the same type have the same color, and silent gaps are shown in black (x axis). Motifs are sorted alphabetically by element sequence and within identical sequences by motif duration. We show 1 bird with high (top row) and one with low sequence stereotypy (bottom row) from each experimental group (left to right: tutors, Control-sh, FoxP1-sh, FoxP2-sh, FoxP4-sh). Pupils that were tutored by one of the tutors shown in the first column are indicated by (i) and (ii). g, Quantitative representation of stuttering. Each dot represents the percentage of all song elements of 1 animal that are part of a stuttering bout (i.e., a string of two or more successive elements of the same type). h, Qualitative representation of stuttering. Sonogram of an example song of FoxP2 kd bird 628, showing an element repetition rate of 81.8% (9 of 11 elements are part of a stuttering bout). *p < 0.05; ns (not significant) p > 0.05.
Isochronous pulse in FoxP-sh birds
We also evaluated the isochronous organization of song in all four groups and compared it with that of the tutors. We determined the isochronous pulse that best fit the song element onsets for each song (Fig. 13a,b). As observed previously (Norton and Scharff, 2016), frequencies of the best fitting pulses formed well-defined clusters. The largest frequency cluster of each tutor bird contained, on average, 56% of songs in contrast to pupils (34%; Fig. 13c). All but 3 of the pupils had a smaller percentage of their songs in their largest cluster than their tutor (exceptions were 1 bird each of Control-sh, FoxP2-sh, and FoxP4-sh; Fig. 13c). The same pulse was, therefore, less consistently detected in pupil songs than in tutor songs. This suggests a looser isochronous organization in the pupil songs. A direct comparison of pulse deviation between the songs of different birds (unlike a comparison of pulse frequencies) is problematic, as deviation depends on a number of factors that differ between individuals, such as pulse frequency and the number of song elements. We therefore created model songs based on each of the analyzed bird songs and compared pulse deviation between bird and model songs. The latter featured the same number of elements in the same sequence as the birdsong they were modeled on, but element and gap durations were randomized (see Materials and Methods). In an average of 77% of the comparisons of tutor versus model songs that reported a significant difference in FRMSD, tutors had a lower FRMSD (i.e., a better pulse fit), a much higher percentage than all pupil groups, including the control pupils (Fig. 13d).
Analysis of element and gap durations in FoxP-sh birds
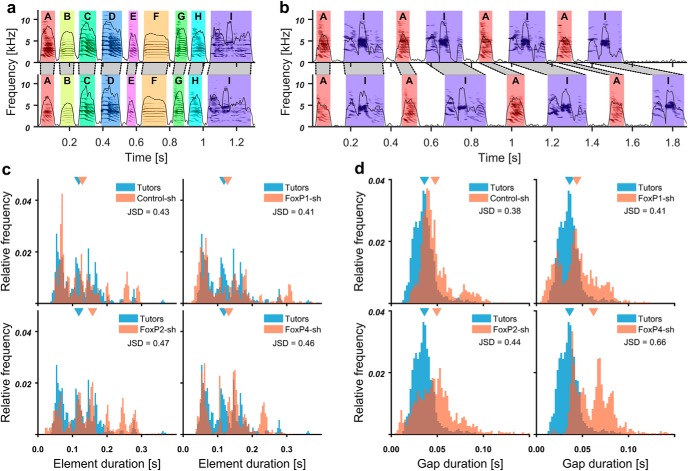
In search for possible explanations of the impaired song rhythm of Control-sh birds, we looked at the overall distribution of element and gap durations in the different treatment groups and their tutors (Fig. 14) by quantifying the dissimilarity between the distributions. To do so, we calculated the JSD; the higher the JSD, the more dissimilar the two distributions are. Song element distributions were approximately equally dissimilar to the tutors in all treatments (Control-sh: JSD = 0.43; FoxP1-sh: 0.41; FoxP2-sh: 0.47; FoxP4-sh: 0.46; Fig. 14c), as was the distribution of a cohort of 15 different previously analyzed adult males (JSD = 0.43; duration data from Norton and Scharff, 2016). As expected, the gap distribution of the cohort of adult males was very similar to that of the tutors (JSD = 0.25). Distributions of the gap durations of Control-sh, FoxP1-sh, and FoxP2-sh had higher but comparable dissimilarities (Control-sh: JSD = 0.38; FoxP1-sh: 0.41; FoxP2-sh: 0.44; Fig. 14d). In contrast, FoxP4-sh had a considerably higher JSD (0.66), likely due to the increased overall durations of gaps. FoxP kd birds had an increased variability of gap durations compared with control birds (Control-sh: SD = 0.017; FoxP1-sh: 0.021; FoxP2-sh: 0.025; FoxP4-sh: 0.022). Among the pupil birds, the percentage of element repetition was positively correlated with the coefficient of variation of interonset intervals (Pearson, r = 0.59, p = 0.0024, n = 24, df = 22), indicating that birds that stutter also have problems with the accurate timing of song elements.
Figure 14.
The duration of song gaps was abnormally variable in FoxP kd birds. a, b, Spectrograms of two example songs each for FoxP4-sh bird 3584 (b) and its tutor 2074 (a). Black dotted lines connect the song element on and offsets of the two songs. The duration of gaps in the songs of the FoxP4 kd bird was abnormally variable. c, d, Histograms of the durations of all song elements (c) and song gaps (d) of tutors (blue) as well as Control-sh, FoxP1-sh, FoxP2-sh, and FoxP4-sh (red, left to right, top to bottom). Top, Triangles represent the means. JSD, Distance between tutor and pupil distribution. Bin size = 2 ms.
Pupil birds were 96 ± 6 d of age at the time of recording (mean ± SD). While song learning is largely completed by ∼90 d, some song changes occur beyond that age. Among those is a gradual shortening of the gaps, while the duration of song elements remains unchanged on average (Glaze and Troyer, 2013). To quantify the similarity of the shape of the gap duration distributions independently of their position on the x axis (i.e., leaving aside the overall higher duration of pupil gaps), we shifted the tutor distribution in 2 ms steps and calculated the JSD between the lagged tutor distribution and the stationary pupil distribution for each step. Even after shifting the tutor distributions toward the pupil distributions to the point of smallest dissimilarity, kd birds still showed a relatively high JSD (FoxP1-sh: minimal JSD = 0.41 at lag 2 ms; FoxP2-sh: 0.38 at 8 ms; FoxP4-sh: 0.44 at 18 ms). The gap distribution of the control birds, on the other hand, was as similar to tutors as the adult cohort after shifting (Control-sh: JSD = 0.22 at lag 8 ms; adult cohort: 0.22 at lag 2 ms). This result suggests that with age the songs of Control-sh birds, like those of normal untreated birds, would have acquired the level of isochronous rhythmic organization found in the tutor birds.
Segregation of the phenotypes of FoxP-sh birds
As we found the treatment groups differentially affected in various aspects of song learning, we wanted to find out whether the four groups could be discriminated by their song phenotype alone. To that end, we performed a linear discriminant analysis using five features of song structure from different domains: two spectral measures (the amount of FM of song elements and the tutor-to-pupil identity score difference), one measure of song learning success (number of copied song elements from tutor), and two temporal measures (CV of duration of the most variable interonset interval and pulse deviation vs model; see Fig. 13d). Birds of the same group cluster together in the signal space, with very little overlap (Fig. 15). Control-sh birds, FoxP2-sh and FoxP4-sh, are well separated. FoxP1-sh is closest in space to the control birds, consistent with song deficits occurring in the fewest number of measures (e.g., not significantly affected in identity and stereotypy scores, copied notes, and FM). To test discrimination by these features, we applied leave-one-out cross-validation. Following this procedure, 54% of the birds were correctly classified as belonging to their respective treatment group. Classification rate as expected by chance was 25%, as there are four possible classes.
Figure 15.
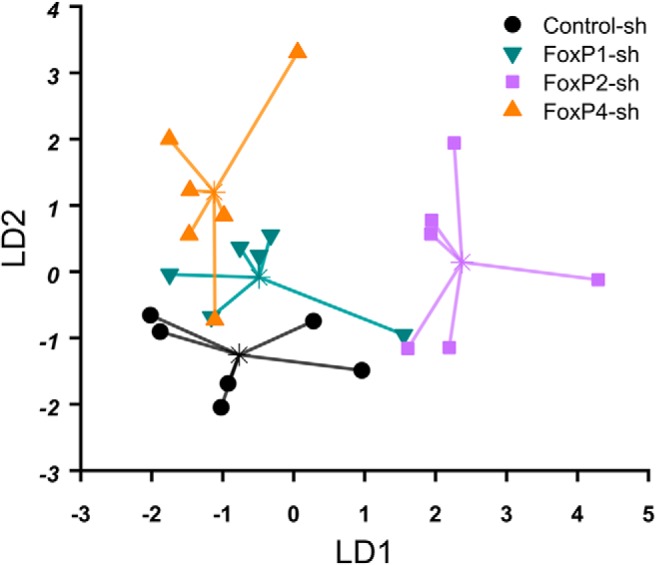
The different treatment groups cluster together in the signal space of a linear discriminant function analysis, indicating that they can be discriminated by their song phenotype above chance. Each dot represents 1 bird in the signal space of the first two linear discriminant functions (LD1 and LD2, arbitrary units). Asterisks indicate group centroids. Lines connect each animal to the centroid of its group.
To summarize, FoxP1/2/4 kd in Area X affected song learning. Reduced motif similarity (Fig. 8a), scrambled order of song elements (Fig. 7), and a smaller fraction of elements copied (Fig. 10) were a common phenotype of all FoxP kd pupils. FoxP1 kd seems to result in the mildest impairment of all FoxPs. Although FoxP1 kd birds did not copy all the elements of their tutors, the material that they copied had high spectrotemporal fidelity. FoxP2 and FoxP4 kd resulted in a more severe phenotype than FoxP1, affecting most of the features studied. FoxP2-sh was more severely affected in motif accuracy (Fig. 8b), fraction of copied notes (Fig. 10), and temporal regularity (Fig. 13d), while FoxP4 was most affected in FM (Fig. 9). Although there is some overlap between the kd groups, together each group has a specific combination of impairments that makes most members of the group more similar to each other than to the other groups (Fig. 15).
Discussion
Many MSNs of zebra finches coexpress FoxP1, FoxP2, and FoxP4 in Area X, a song nucleus important for vocal learning (Mendoza et al., 2015). Furthermore, FoxP1/2/4 can dimerize and oligomerize with each other in those neurons and can share the same binding sites and target genes (Mendoza and Scharff, 2017). In the present study, we addressed the effects of lentivirus-driven siRNA kd of FoxP1 or FoxP4 in Area X of juvenile male zebra finch on song development and compared those with the incomplete and inaccurate song imitation previously observed after manipulating the amount of FoxP2 in Area X (Haesler et al., 2007; Murugan et al., 2013; Heston and White, 2015). Our present data show that experimental reduction of FoxP1, FoxP2, and FoxP4 in Area X of juveniles impairs song development in partly overlapping and partly distinct ways. We discuss these findings in light of the current understanding of Area X function in song development.
The cortico-basal ganglia circuit promotes learning of action sequences through trial-and-error learning and basal ganglia drive the variability necessary for this reinforcement-based learning. This learning is driven by the reward-related dopamine signaling (Gadagkar et al., 2016; Hisey et al., 2018) that projects to the basal ganglia from the ventral tegmental area and substantia nigra pars compacta (Graybiel, 2005). In the striatum of the zebra finch, D1A, D1B, and D2 dopamine receptors co-occur (Kubikova et al., 2010) and are also coexpressed with FoxP1/2/4 proteins (Kubikova et al., 2010; Mendoza et al., 2015). Downregulation of FoxP2 in Area X affects dopamine receptor and DARPP-32 expression (Murugan et al., 2013), likely interfering with the dopaminergic reinforcement signals correctly reaching the MSNs. Thus, the regulation of the FoxP subfamily members during times of vocal plasticity could be functionally related to dopamine signaling. When Foxp2 was manipulated to resemble the human FOXP2 in a mouse, a decrease in dopamine levels was reported (Enard et al., 2009; Enard, 2011), further suggesting a link between FoxP2 and dopamine. In addition, FoxP2 regulates spine density in Area X MSN (Schulz et al., 2010). Furthermore, target genes regulated by FoxP2 affect neurite outgrowth, synaptic plasticity, and axon guidance (Spiteri et al., 2007; Vernes et al., 2007, 2011). Results of mouse Foxp2 manipulations support this, showing alterations in dendrite length and synaptic plasticity (Groszer et al., 2008; Enard et al., 2009; Reimers-Kipping et al., 2011; French et al., 2012). Foxp1 and Foxp2 manipulations in mice also resulted in abnormal vocalizations (Shu et al., 2005; Fujita et al., 2008; Gaub et al., 2010, 2016; Fischer and Hammerschmidt, 2011). Genetic manipulations in Area X were also reported for FoxP2 downregulation (Haesler et al., 2007) and upregulation (Heston and White, 2015) and mir-9 (Shi et al., 2018). This microRNA downregulates FoxP1 and FoxP2 in zebra finches.
All manipulations of FoxP2 in songbirds lead to song impairments and low motif similarity. All of them report syllable omissions and adding elements not found in the tutor (improvizations in Heston and White, 2015). Syntax similarity, a measure similar to stereotypy, was reported to be normal when FoxP2 is overexpressed (Heston and White, 2015) but affected by mir-9 downregulation (Shi et al., 2018), which coincides with our results of FoxP2 downregulation. The FM of the fundamental is abnormal after FoxP2 overexpression (Heston and White, 2015); but when we downregulated FoxP2, or FoxP1 or after mir-9 induced FoxP2 downregulation (Shi et al., 2018), FM was not different from the tutor, whereas downregulation of FoxP4 affected FM (this study).
To compare our stuttering results with those of Kubikova et al. (2014) who reported stuttering behavior in male zebra finches after adult Area X lesions, we analyzed our data using their criteria. Some zebra finches normally repeat elements one or more times in some of their motifs, and this baseline was similar in the pre-Area X lesion adults and controls in Kubikova et al. (2014) and the control-injected animals as well as tutors in our experiment (33% control-injected group, 20% tutor group, and 10%–40% of birds in the pre-Area X lesion groups of Kubikova et al., 2014). In contrast, 72% of FoxP1/2/4 kd birds repeated elements. In those birds that repeated elements, the percentage of motifs containing repetitions was also higher in kds compared with controls and tutors. The Kubikova et al. (2014) study did not report which fraction of motifs contained repetitions. Concerning the number of elements repeated per motif, the males before Area X lesion and control lesioned animals of Kubikova et al. (2014) did not differ from the control-injected animals and the tutors in our study (2.43–4.33 repetitions per motif pre-Area X lesion, 2.25–4.5 for our tutors, and 2 for our controls). However, whereas the FoxP1/2/4 kd animals stayed within the same range of element repetitions as controls and intact animals (this study), those Area X-lesioned animals that already repeated the last element of their motif prelesion increased the average maximum number of element repetitions from 4.3 to 10.2 (Kubikova et al., 2014). Thus, our data indicate that experimental downregulation of FoxP1/2/4 in Area X of developing zebra finches increases the propensity to stutter and the frequency of stuttering in their song, which we assessed at ∼90 d of age, but it does not affect the severity of stuttering (i.e., the number of repetitions per stuttering bout). In contrast, Area X lesions in adults significantly increase the severity of stuttering in birds, but only in birds that already repeated the last elements of their motif preoperatively.
Human phenotypes related to FOXP1 and FOXP2 mutations support a role for these transcription factors in vocal learning (Bacon and Rappold, 2012). FOXP4 mutations lead to developmental delay (Charng et al., 2016), but whether vocal learning was affected was not reported. FOXP4 is expressed more widely and homogeneously in the brain than FOXP1 and FOXP2 are (Mendoza et al., 2015); therefore, a mutation might affect more brain functions than FOXP1 or FOXP2. In our experiments, we downregulated FoxPs in one area important for vocal learning at the time of vocal learning, without the possible effects of the downregulation in other brain regions that may contribute to a more severe phenotype, and without affecting embryonic development.
Possible explanations for the fact that all FoxP downregulations in Area X impacted song learning might be that heterodimers of the FoxP subfamily are important for regulating the function of pathways required for vocal learning. Therefore, the absence or mutation of any one of the FoxP proteins is likely to affect the function of the others. Indeed, FoxP members can bind to, and regulate, some of the same genes, and thereby all affect song learning. This is supported by the fact that all FoxP subfamily proteins regulate the SV40 and VLDLR promoter (Mendoza and Scharff, 2017). Another explanation might be that FoxP subfamily members regulate different target genes and the absence of any (or a set) of these targets could affect vocal learning in different ways. This is consistent with the finding that FoxP1, FoxP2, and FoxP4 do not always bind to the same site in the regulatory regions of their target genes (Sin et al., 2015; Mendoza and Scharff, 2017).
On a technical note, it is unlikely that the observed effects are due to the induction of off-target or toxic effects, since (1) we used different short hairpins for each FoxP subfamily members; (2) we demonstrated that short hairpins are specific, even if compared with the same subfamily; (3) we used small short hairpins proven not to be toxic or to induce other side effects; (4) not all gene downregulations in Area X lead to impaired song (unpublished data); and (5) the specific song impairments differ after downregulation of FoxP1 from those due to downregulation of FoxP2 and those due to downregulation of FoxP4.
Together, our data suggest that the neurally expressed proteins of the FoxP subfamily, FoxP1/2/4, act in Area X in concert but differentially to regulate the function of pathways important in song learning in the zebra finch. Thus, all three FoxPs are needed for the proper regulation of their target genes and, in turn, song learning behavior.
Footnotes
C.S. and P.N. were supported by Deutsche Forschungsgemeinschaft SFB665. E.M. was supported by Consejo Nacional de Ciencia y Tecnología and Deutscher Akademischer Austauschdienst. We thank Sebastian Haesler for advice on preparing FoxP1 and FoxP4 knockdown constructs and the FoxP2 song data that were reanalyzed in the present work; Iris Adam for help with qPCR and for establishing the microbiopsy protocol; and Ursula Kobalz and Nshdejan Arpik for invaluable technical help.
The authors declare no competing financial interests.
References
- Adam I, Scharff C, Honarmand M (2014) Who is who? Non-invasive methods to individually sex and mark altricial chicks. J Vis Exp 87:e51429. 10.3791/51429 [DOI] [PMC free article] [PubMed] [Google Scholar]
- Adam I, Mendoza E, Kobalz U, Wohlgemuth S, Scharff C (2016) FoxP2 directly regulates the reelin receptor VLDLR developmentally and by singing. Mol Cell Neurosci 74:96–105. 10.1016/j.mcn.2016.04.002 [DOI] [PubMed] [Google Scholar]
- Adam I, Mendoza E, Kobalz U, Wohlgemuth S, Scharff C (2017) CNTNAP2 is a direct FoxP2 target in vitro and in vivo in zebra finches: complex regulation by age and activity. Genes Brain Behav 16:635–642. 10.1111/gbb.12390 [DOI] [PubMed] [Google Scholar]
- Aronov D, Andalman AS, Fee MS (2008) A specialized forebrain circuit for vocal babbling in the juvenile songbird. Science 320:630–634. 10.1126/science.1155140 [DOI] [PubMed] [Google Scholar]
- Bacon C, Rappold GA (2012) The distinct and overlapping phenotypic spectra of FOXP1 and FOXP2 in cognitive disorders. Hum Genet 131:1687–1698. 10.1007/s00439-012-1193-z [DOI] [PMC free article] [PubMed] [Google Scholar]
- Bolhuis JJ, Okanoya K, Scharff C (2010) Twitter evolution: converging mechanisms in birdsong and human speech. Nat Rev Neurosci 11:747–759. 10.1038/nrn2931 [DOI] [PubMed] [Google Scholar]
- Bonkowsky JL, Chien CB (2005) Molecular cloning and developmental expression of foxP2 in zebrafish. Dev Dyn 234:740–746. 10.1002/dvdy.20504 [DOI] [PubMed] [Google Scholar]
- Bowers JM, Konopka G (2012) The role of the FOXP family of transcription factors in ASD. Dis Markers 33:251–260. 10.1155/2012/456787 [DOI] [PMC free article] [PubMed] [Google Scholar]
- Castellucci GA, McGinley MJ, McCormick DA (2016) Knockout of Foxp2 disrupts vocal development in mice. Sci Rep 6:23305. 10.1038/srep23305 [DOI] [PMC free article] [PubMed] [Google Scholar]
- Chabout J, Sarkar A, Patel SR, Radden T, Dunson DB, Fisher SE, Jarvis ED (2016) A Foxp2 mutation implicated in human speech deficits alters sequencing of ultrasonic vocalizations in adult male mice. Front Behav Neurosci 10:197. 10.3389/fnbeh.2016.00197 [DOI] [PMC free article] [PubMed] [Google Scholar]
- Charng WL, Karaca E, Coban Akdemir Z, Gambin T, Atik MM, Gu S, Posey JE, Jhangiani SN, Muzny DM, Doddapaneni H, Hu J, Boerwinkle E, Gibbs RA, Rosenfeld JA, Cui H, Xia F, Manickam K, Yang Y, Faqeih EA, Al Asmari A, et al. (2016) Exome sequencing in mostly consanguineous Arab families with neurologic disease provides a high potential molecular diagnosis rate. BMC Med Genomics 9:42. 10.1186/s12920-016-0208-3 [DOI] [PMC free article] [PubMed] [Google Scholar]
- Day NF, Hobbs TG, Heston JB, White SA (2019) Beyond critical period learning: striatal FoxP2 affects the active maintenance of learned vocalizations in adulthood. eNeuro 6:ENEURO.0071–19.2019. 10.1523/ENEURO.0071-19.2019 [DOI] [PMC free article] [PubMed] [Google Scholar]
- Doupe AJ, Kuhl PK (1999) Birdsong and human speech: common themes and mechanisms. Annu Rev Neurosci 22:567–631. 10.1146/annurev.neuro.22.1.567 [DOI] [PubMed] [Google Scholar]
- Enard W. (2011) FOXP2 and the role of cortico-basal ganglia circuits in speech and language evolution. Curr Opin Neurobiol 21:415–424. 10.1016/j.conb.2011.04.008 [DOI] [PubMed] [Google Scholar]
- Enard W, Gehre S, Hammerschmidt K, Hölter SM, Blass T, Somel M, Brückner MK, Schreiweis C, Winter C, Sohr R, Becker L, Wiebe V, Nickel B, Giger T, Müller U, Groszer M, Adler T, Aguilar A, Bolle I, Calzada-Wack J, et al. (2009) A humanized version of Foxp2 affects cortico-basal ganglia circuits in mice. Cell 137:961–971. 10.1016/j.cell.2009.03.041 [DOI] [PubMed] [Google Scholar]
- Endres DM, Schindelin JE (2003) A new metric for probability distributions. IEEE Trans Inform Theory 49:1858–1860. 10.1109/TIT.2003.813506 [DOI] [Google Scholar]
- Estruch SB, Graham SA, Quevedo M, Vino A, Dekkers DH, Deriziotis P, Sollis E, Demmers J, Poot RA, Fisher SE (2018) Proteomic analysis of FOXP proteins reveals interactions between cortical transcription factors associated with neurodevelopmental disorders. Hum Mol Genet 27:1212–1227. 10.1093/hmg/ddy035 [DOI] [PubMed] [Google Scholar]
- Ferland RJ, Cherry TJ, Preware PO, Morrisey EE, Walsh CA (2003) Characterization of Foxp2 and Foxp1 mRNA and protein in the developing and mature brain. J Comp Neurol 460:266–279. 10.1002/cne.10654 [DOI] [PubMed] [Google Scholar]
- Fischer J, Hammerschmidt K (2011) Ultrasonic vocalizations in mouse models for speech and socio-cognitive disorders: insights into the evolution of vocal communication. Genes Brain Behav 10:17–27. 10.1111/j.1601-183X.2010.00610.x [DOI] [PMC free article] [PubMed] [Google Scholar]
- Fisher SE, Scharff C (2009) FOXP2 as a molecular window into speech and language. Trends Genet 25:166–177. 10.1016/j.tig.2009.03.002 [DOI] [PubMed] [Google Scholar]
- French CA, Jin X, Campbell TG, Gerfen E, Groszer M, Fisher SE, Costa RM (2012) An aetiological Foxp2 mutation causes aberrant striatal activity and alters plasticity during skill learning. Mol Psychiatry 17:1077–1085. 10.1038/mp.2011.105 [DOI] [PMC free article] [PubMed] [Google Scholar]
- French CA, Vinueza Veloz MF, Zhou K, Peter S, Fisher SE, Costa RM, De Zeeuw CI (2019) Differential effects of Foxp2 disruption in distinct motor circuits. Mol Psychiatry 24:447–462. 10.1038/s41380-018-0199-x [DOI] [PMC free article] [PubMed] [Google Scholar]
- Fujita E, Tanabe Y, Shiota A, Ueda M, Suwa K, Momoi MY, Momoi T (2008) Ultrasonic vocalization impairment of Foxp2 (R552H) knockin mice related to speech-language disorder and abnormality of Purkinje cells. Proc Natl Acad Sci U S A 105:3117–3122. 10.1073/pnas.0712298105 [DOI] [PMC free article] [PubMed] [Google Scholar]
- Gadagkar V, Puzerey PA, Chen R, Baird-Daniel E, Farhang AR, Goldberg JH (2016) Dopamine neurons encode performance error in singing birds. Science 354:1278–1282. 10.1126/science.aah6837 [DOI] [PMC free article] [PubMed] [Google Scholar]
- Gaub S, Groszer M, Fisher SE, Ehret G (2010) The structure of innate vocalizations in Foxp2-deficient mouse pups. Genes Brain Behav 9:390–401. 10.1111/j.1601-183X.2010.00570.x [DOI] [PMC free article] [PubMed] [Google Scholar]
- Gaub S, Fisher SE, Ehret G (2016) Ultrasonic vocalizations of adult male Foxp2-mutant mice: behavioral contexts of arousal and emotion. Genes Brain Behav 15:243–259. 10.1111/gbb.12274 [DOI] [PubMed] [Google Scholar]
- Glaze CM, Troyer TW (2013) Development of temporal structure in zebra finch song. J Neurophysiol 109:1025–1035. 10.1152/jn.00578.2012 [DOI] [PMC free article] [PubMed] [Google Scholar]
- Graybiel AM. (2005) The basal ganglia: learning new tricks and loving it. Curr Opin Neurobiol 15:638–644. 10.1016/j.conb.2005.10.006 [DOI] [PubMed] [Google Scholar]
- Groszer M, Keays DA, Deacon RM, de Bono JP, Prasad-Mulcare S, Gaub S, Baum MG, French CA, Nicod J, Coventry JA, Enard W, Fray M, Brown SD, Nolan PM, Pääbo S, Channon KM, Costa RM, Eilers J, Ehret G, Rawlins JN, et al. (2008) Impaired synaptic plasticity and motor learning in mice with a point mutation implicated in human speech deficits. Curr Biol 18:354–362. 10.1016/j.cub.2008.01.060 [DOI] [PMC free article] [PubMed] [Google Scholar]
- Haesler S, Wada K, Nshdejan A, Morrisey EE, Lints T, Jarvis ED, Scharff C (2004) FoxP2 expression in avian vocal learners and non-learners. J Neurosci 24:3164–3175. 10.1523/JNEUROSCI.4369-03.2004 [DOI] [PMC free article] [PubMed] [Google Scholar]
- Haesler S, Rochefort C, Georgi B, Licznerski P, Osten P, Scharff C (2007) Incomplete and inaccurate vocal imitation after knockdown of FoxP2 in songbird basal ganglia nucleus area X. PLoS Biol 5:e321. 10.1371/journal.pbio.0050321 [DOI] [PMC free article] [PubMed] [Google Scholar]
- Heston JB, White SA (2015) Behavior-linked FoxP2 regulation enables zebra finch vocal learning. J Neurosci 35:2885–2894. 10.1523/JNEUROSCI.3715-14.2015 [DOI] [PMC free article] [PubMed] [Google Scholar]
- Hisey E, Kearney MG, Mooney R (2018) A common neural circuit mechanism for internally guided and externally reinforced forms of motor learning. Nat Neurosci 21:589–597. 10.1038/s41593-018-0092-6 [DOI] [PMC free article] [PubMed] [Google Scholar]
- Kaestner KH, Knochel W, Martinez DE (2000) Unified nomenclature for the winged helix/forkhead transcription factors. Genes Dev 14:142–146. 10.1101/gad.14.2.142 [DOI] [PubMed] [Google Scholar]
- Karnovsky MJ, Roots L (1964) A “direct-coloring” thiocholine method for cholinesterases. J Histochem Cytochem 12:219–221. 10.1177/12.3.219 [DOI] [PubMed] [Google Scholar]
- Kubikova L, Wada K, Jarvis ED (2010) Dopamine receptors in a songbird brain. J Comp Neurol 518:741–769. 10.1002/cne.22255 [DOI] [PMC free article] [PubMed] [Google Scholar]
- Kubikova L, Bosikova E, Cvikova M, Lukacova K, Scharff C, Jarvis ED (2014) Basal ganglia function, stuttering, sequencing, and repair in adult songbirds. Sci Rep 4:6590. 10.1038/srep06590 [DOI] [PMC free article] [PubMed] [Google Scholar]
- Lai CS, Fisher SE, Hurst JA, Vargha-Khadem F, Monaco AP (2001) A forkhead-domain gene is mutated in a severe speech and language disorder. Nature 413:519–523. 10.1038/35097076 [DOI] [PubMed] [Google Scholar]
- Li S, Weidenfeld J, Morrisey EE (2004) Transcriptional and DNA binding activity of the Foxp1/2/4 family is modulated by heterotypic and homotypic protein interactions. Mol Cell Biol 24:809–822. 10.1128/MCB.24.2.809-822.2004 [DOI] [PMC free article] [PubMed] [Google Scholar]
- Liégeois F, Baldeweg T, Connelly A, Gadian DG, Mishkin M, Vargha-Khadem F (2003) Language fMRI abnormalities associated with FOXP2 gene mutation. Nat Neurosci 6:1230–1237. 10.1038/nn1138 [DOI] [PubMed] [Google Scholar]
- Lin JH. (1991) Divergence measures based on the Shannon entropy. IEEE Trans Inform Theory 37:145–151. 10.1109/18.61115 [DOI] [Google Scholar]
- Mashiko H, Yoshida AC, Kikuchi SS, Niimi K, Takahashi E, Aruga J, Okano H, Shimogori T (2012) Comparative anatomy of marmoset and mouse cortex from genomic expression. J Neurosci 32:5039–5053. 10.1523/JNEUROSCI.4788-11.2012 [DOI] [PMC free article] [PubMed] [Google Scholar]
- Mendoza E, Scharff C (2017) Protein-protein interaction among the FoxP family members and their regulation of two target genes, VLDLR and CNTNAP2 in the zebra finch song system. Front Mol Neurosci 10:112. 10.3389/fnmol.2017.00112 [DOI] [PMC free article] [PubMed] [Google Scholar]
- Mendoza E, Tokarev K, Düring DN, Retamosa EC, Weiss M, Arpenik N, Scharff C (2015) Differential coexpression of FoxP1, FoxP2, and FoxP4 in the zebra finch (Taeniopygia guttata) song system. J Comp Neurol 523:1318–1340. 10.1002/cne.23731 [DOI] [PubMed] [Google Scholar]
- Miller JE, Spiteri E, Condro MC, Dosumu-Johnson RT, Geschwind DH, White SA (2008) Birdsong decreases protein levels of FoxP2, a molecule required for human speech. J Neurophysiol 100:2015–2025. 10.1152/jn.90415.2008 [DOI] [PMC free article] [PubMed] [Google Scholar]
- Mizutani A, Matsuzaki A, Momoi MY, Fujita E, Tanabe Y, Momoi T (2007) Intracellular distribution of a speech/language disorder associated FOXP2 mutant. Biochem Biophys Res Commun 353:869–874. 10.1016/j.bbrc.2006.12.130 [DOI] [PubMed] [Google Scholar]
- Morgan AT, Webster R (2018) Aetiology of childhood apraxia of speech: a clinical practice update for paediatricians. J Paediatr Child Health 54:1090–1095. 10.1111/jpc.14150 [DOI] [PubMed] [Google Scholar]
- Murugan M, Harward S, Scharff C, Mooney R (2013) Diminished FoxP2 levels affect dopaminergic modulation of corticostriatal signaling important to song variability. Neuron 80:1464–1476. 10.1016/j.neuron.2013.09.021 [DOI] [PMC free article] [PubMed] [Google Scholar]
- Norton P, Scharff C (2016) “Bird song Metronomics”: isochronous organization of zebra finch song rhythm. Front Neurosci 10:309. 10.3389/fnins.2016.00309 [DOI] [PMC free article] [PubMed] [Google Scholar]
- Olias P, Adam I, Meyer A, Scharff C, Gruber AD (2014) Reference genes for quantitative gene expression studies in multiple avian species. PLoS One 9:e99678. 10.1371/journal.pone.0099678 [DOI] [PMC free article] [PubMed] [Google Scholar]
- Petkov CI, Jarvis ED (2012) Birds, primates, and spoken language origins: behavioral phenotypes and neurobiological substrates. Front Evol Neurosci 4:12. 10.3389/fnevo.2012.00012 [DOI] [PMC free article] [PubMed] [Google Scholar]
- Pfenning AR, Hara E, Whitney O, Rivas MV, Wang R, Roulhac PL, Howard JT, Wirthlin M, Lovell PV, Ganapathy G, Mouncastle J, Moseley MA, Thompson JW, Soderblom EJ, Iriki A, Kato M, Gilbert MT, Zhang G, Bakken T, Bongaarts A, et al. (2014) Convergent transcriptional specializations in the brains of humans and song-learning birds. Science 346:1256846. 10.1126/science.1256846 [DOI] [PMC free article] [PubMed] [Google Scholar]
- Ravignani A, Norton P (2017) Measuring rhythmic complexity: a primer to quantify and compare temporal structure in speech, movement, and animal vocalizations. J Lang Evol 2:4–19. 10.1093/jole/lzx002 [DOI] [Google Scholar]
- Reimers-Kipping S, Hevers W, Pääbo S, Enard W (2011) Humanized Foxp2 specifically affects cortico-basal ganglia circuits. Neuroscience 175:75–84. 10.1016/j.neuroscience.2010.11.042 [DOI] [PubMed] [Google Scholar]
- Roper A, Zann R (2006) The onset of song learning and song tutor selection in fledgling zebra finches. Ethology 112:458–470. 10.1111/j.1439-0310.2005.01169.x [DOI] [Google Scholar]
- Sasahara K, Tchernichovski O, Takahasi M, Suzuki K, Okanoya K (2015) A rhythm landscape approach to the developmental dynamics of birdsong. J R Soc Interface 12:20150802. 10.1098/rsif.2015.0802 [DOI] [PMC free article] [PubMed] [Google Scholar]
- Scharff C, Nottebohm F (1991) A comparative study of the behavioral deficits following lesions of various parts of the zebra finch song system: implications for vocal learning. J Neurosci 11:2896–2913. 10.1523/JNEUROSCI.11-09-02896.1991 [DOI] [PMC free article] [PubMed] [Google Scholar]
- Scharff C, Nottebohm F, Cynx J (1998) Conspecific and heterospecific song discrimination in male zebra finches with lesions in the anterior forebrain pathway. J Neurobiol 36:81–90. [DOI] [PubMed] [Google Scholar]
- Schulz SB, Haesler S, Scharff C, Rochefort C (2010) Knockdown of FoxP2 alters spine density in area X of the zebra finch. Genes Brain Behav 9:732–740. 10.1111/j.1601-183X.2010.00607.x [DOI] [PubMed] [Google Scholar]
- Shi Z, Piccus Z, Zhang X, Yang H, Jarrell H, Ding Y, Teng Z, Tchernichovski O, Li X (2018) miR-9 regulates basal ganglia-dependent developmental vocal learning and adult vocal performance in songbirds. Elife 7:e29087. 10.7554/eLife.29087 [DOI] [PMC free article] [PubMed] [Google Scholar]
- Shu W, Yang H, Zhang L, Lu MM, Morrisey EE (2001) Characterization of a new subfamily of winged-helix/forkhead (Fox) genes that are expressed in the lung and act as transcriptional repressors. J Biol Chem 276:27488–27497. 10.1074/jbc.M100636200 [DOI] [PubMed] [Google Scholar]
- Shu W, Cho JY, Jiang Y, Zhang M, Weisz D, Elder GA, Schmeidler J, De Gasperi R, Sosa MA, Rabidou D, Santucci AC, Perl D, Morrisey E, Buxbaum JD (2005) Altered ultrasonic vocalization in mice with a disruption in the Foxp2 gene. Proc Natl Acad Sci U S A 102:9643–9648. 10.1073/pnas.0503739102 [DOI] [PMC free article] [PubMed] [Google Scholar]
- Sin C, Li H, Crawford DA (2015) Transcriptional regulation by FOXP1, FOXP2, and FOXP4 dimerization. J Mol Neurosci 55:437–448. 10.1007/s12031-014-0359-7 [DOI] [PubMed] [Google Scholar]
- Siper PM, De Rubeis S, Trelles MD, Durkin A, Di Marino D, Muratet F, Frank Y, Lozano R, Eichler EE, Kelly M, Beighley J, Gerdts J, Wallace AS, Mefford HC, Bernier RA, Kolevzon A, Buxbaum JD (2017) Prospective investigation of FOXP1 syndrome. Mol Autism 8:57. 10.1186/s13229-017-0172-6 [DOI] [PMC free article] [PubMed] [Google Scholar]
- Sohrabji F, Nordeen EJ, Nordeen KW (1990) Selective impairment of song learning following lesions of a forebrain nucleus in the juvenile zebra finch. Behav Neural Biol 53:51–63. 10.1016/0163-1047(90)90797-A [DOI] [PubMed] [Google Scholar]
- Sollis E, Graham SA, Vino A, Froehlich H, Vreeburg M, Dimitropoulou D, Gilissen C, Pfundt R, Rappold GA, Brunner HG, Deriziotis P, Fisher SE (2016) Identification and functional characterization of de novo FOXP1 variants provides novel insights into the etiology of neurodevelopmental disorder. Hum Mol Genet 25:546–557. 10.1093/hmg/ddv495 [DOI] [PubMed] [Google Scholar]
- Sollis E, Deriziotis P, Saitsu H, Miyake N, Matsumoto N, Hoffer MJ, Ruivenkamp CA, Alders M, Okamoto N, Bijlsma EK, Plomp AS, Fisher SE (2017) Equivalent missense variant in the FOXP2 and FOXP1 transcription factors causes distinct neurodevelopmental disorders. Hum Mutat 38:1542–1554. 10.1002/humu.23303 [DOI] [PubMed] [Google Scholar]
- Spaeth JM, Hunter CS, Bonatakis L, Guo M, French CA, Slack I, Hara M, Fisher SE, Ferrer J, Morrisey EE, Stanger BZ, Stein R (2015) The FOXP1, FOXP2 and FOXP4 transcription factors are required for islet alpha cell proliferation and function in mice. Diabetologia 58:1836–1844. 10.1007/s00125-015-3635-3 [DOI] [PMC free article] [PubMed] [Google Scholar]
- Spiteri E, Konopka G, Coppola G, Bomar J, Oldham M, Ou J, Vernes SC, Fisher SE, Ren B, Geschwind DH (2007) Identification of the transcriptional targets of FOXP2, a gene linked to speech and language, in developing human brain. Am J Hum Genet 81:1144–1157. 10.1086/522237 [DOI] [PMC free article] [PubMed] [Google Scholar]
- Takahashi H, Takahashi K, Liu FC (2009) FOXP genes, neural development, speech and language disorders. Adv Exp Med Biol 665:117–129. 10.1007/978-1-4419-1599-3_9 [DOI] [PubMed] [Google Scholar]
- Takahashi K, Liu FC, Hirokawa K, Takahashi H (2003) Expression of Foxp2, a gene involved in speech and language, in the developing and adult striatum. J Neurosci Res 73:61–72. 10.1002/jnr.10638 [DOI] [PubMed] [Google Scholar]
- Takahashi K, Liu FC, Hirokawa K, Takahashi H (2008a) Expression of Foxp4 in the developing and adult rat forebrain. J Neurosci Res 86:3106–3116. 10.1002/jnr.21770 [DOI] [PubMed] [Google Scholar]
- Takahashi K, Liu FC, Oishi T, Mori T, Higo N, Hayashi M, Hirokawa K, Takahashi H (2008b) Expression of FOXP2 in the developing monkey forebrain: comparison with the expression of the genes FOXP1, PBX3, and MEIS2. J Comp Neurol 509:180–189. 10.1002/cne.21740 [DOI] [PubMed] [Google Scholar]
- Tchernichovski O, Nottebohm F (1998) Social inhibition of song imitation among sibling male zebra finches. Proc Natl Acad Sci U S A 95:8951–8956. 10.1073/pnas.95.15.8951 [DOI] [PMC free article] [PubMed] [Google Scholar]
- Tchernichovski O, Lints T, Mitra PP, Nottebohm F (1999) Vocal imitation in zebra finches is inversely related to model abundance. Proc Natl Acad Sci U S A 96:12901–12904. 10.1073/pnas.96.22.12901 [DOI] [PMC free article] [PubMed] [Google Scholar]
- Tchernichovski O, Nottebohm F, Ho CE, Pesaran B, Mitra PP (2000) A procedure for an automated measurement of song similarity. Anim Behav 59:1167–1176. 10.1006/anbe.1999.1416 [DOI] [PubMed] [Google Scholar]
- Teramitsu I, Kudo LC, London SE, Geschwind DH, White SA (2004) Parallel FoxP1 and FoxP2 expression in songbird and human brain predicts functional interaction. J Neurosci 24:3152–3163. 10.1523/JNEUROSCI.5589-03.2004 [DOI] [PMC free article] [PubMed] [Google Scholar]
- Teramitsu I, Poopatanapong A, Torrisi S, White SA (2010) Striatal FoxP2 is actively regulated during songbird sensorimotor learning. PLoS One 5:e8548. 10.1371/journal.pone.0008548 [DOI] [PMC free article] [PubMed] [Google Scholar]
- Thompson CK, Schwabe F, Schoof A, Mendoza E, Gampe J, Rochefort C, Scharff C (2013) Young and intense: FoxP2 immunoreactivity in area X varies with age, song stereotypy, and singing in male zebra finches. Front Neural Circuits 7:24. 10.3389/fncir.2013.00024 [DOI] [PMC free article] [PubMed] [Google Scholar]
- Tramontin AD, Smith GT, Breuner CW, Brenowitz EA (1998) Seasonal plasticity and sexual dimorphism in the avian song control system: stereological measurement of neuron density and number. J Comp Neurol 396:186–192. [DOI] [PubMed] [Google Scholar]
- Vernes SC, Spiteri E, Nicod J, Groszer M, Taylor JM, Davies KE, Geschwind DH, Fisher SE (2007) High-throughput analysis of promoter occupancy reveals direct neural targets of FOXP2, a gene mutated in speech and language disorders. Am J Hum Genet 81:1232–1250. 10.1086/522238 [DOI] [PMC free article] [PubMed] [Google Scholar]
- Vernes SC, Oliver PL, Spiteri E, Lockstone HE, Puliyadi R, Taylor JM, Ho J, Mombereau C, Brewer A, Lowy E, Nicod J, Groszer M, Baban D, Sahgal N, Cazier JB, Ragoussis J, Davies KE, Geschwind DH, Fisher SE (2011) Foxp2 regulates gene networks implicated in neurite outgrowth in the developing brain. PLoS Genet 7:e1002145. 10.1371/journal.pgen.1002145 [DOI] [PMC free article] [PubMed] [Google Scholar]
- Wada K, Howard JT, McConnell P, Whitney O, Lints T, Rivas MV, Horita H, Patterson MA, White SA, Scharff C, Haesler S, Zhao S, Sakaguchi H, Hagiwara M, Shiraki T, Hirozane-Kishikawa T, Skene P, Hayashizaki Y, Carninci P, Jarvis ED (2006) A molecular neuroethological approach for identifying and characterizing a cascade of behaviorally regulated genes. Proc Natl Acad Sci U S A 103:15212–15217. 10.1073/pnas.0607098103 [DOI] [PMC free article] [PubMed] [Google Scholar]
- Watkins KE, Vargha-Khadem F, Ashburner J, Passingham RE, Connelly A, Friston KJ, Frackowiak RS, Mishkin M, Gadian DG (2002) MRI analysis of an inherited speech and language disorder: structural brain abnormalities. Brain 125:465–478. 10.1093/brain/awf057 [DOI] [PubMed] [Google Scholar]
- Williams H. (2004) Birdsong and singing behavior. Ann N Y Acad Sci 1016:1–30. 10.1196/annals.1298.029 [DOI] [PubMed] [Google Scholar]
- Xu S, Liu P, Chen Y, Chen Y, Zhang W, Zhao H, Cao Y, Wang F, Jiang N, Lin S, Li B, Zhang Z, Wei Z, Fan Y, Jin Y, He L, Zhou R, Dekker JD, Tucker HO, Fisher SE, et al. (2018) Foxp2 regulates anatomical features that may be relevant for vocal behaviors and bipedal locomotion. Proc Natl Acad Sci U S A 115:8799–8804. 10.1073/pnas.1721820115 [DOI] [PMC free article] [PubMed] [Google Scholar]


