Abstract
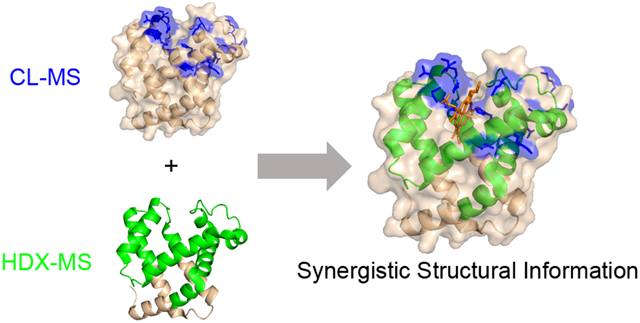
Hydrogen deuterium exchange (HDX) mass spectrometry (MS) and covalent labeling (CL) MS are typically considered to be complementary methods for protein structural analysis because one probes the protein backbone while the other probes side chains. For protein-ligand interactions, we demonstrate in this work that the two labeling techniques can provide synergistic structural information about protein-ligand binding when reagents like diethylpyrocarbonate (DEPC) are used for CL because of the differences in the reaction rates of DEPC and HDX. Using three model protein-ligand systems, we show that the slower timescale for DEPC labeling makes it only sensitive to changes in solvent accessibility and insensitive to changes in protein structural fluctuations, whereas HDX is sensitive to changes in both solvent accessibility and structural fluctuations. When used together, the two methods more clearly reveal binding sites and ligand-induced changes to structural fluctuations that are distant from the binding site, which is more comprehensive information than either technique alone can provide. We predict that these two methods will find widespread usage together for more deeply understanding protein-ligand interactions.
Graphical Abstract
Protein-ligand interactions are fundamental in all living organisms. Understanding the details of protein-ligand interactions is an important step for understanding biology at the molecular level.1 Characterizing protein-ligand binding sites as well as ligand binding induced structural changes can facilitate drug discovery, design, and development.2
Mass spectrometry (MS) based methods have some inherent advantages for studying protein-ligand interactions over other methods that reveal a protein’s higher order structure (HOS) such as X-ray crystallography and NMR.3 These advantages include limited sample consumption, almost no protein size limitations, and the ability to obtain information in mixtures. As a result of these advantages, many MS-based methods have been explored to study protein-ligand interactions to characterize binding stoichiometries, binding constants, and binding sites.4–7
Hydrogen deuterium exchange (HDX) MS is a well-established method to study protein’s HOS that is increasingly used in the pharmaceutical industry.8–10 HDX relies on changes in mass resulting from backbone amide hydrogen exchange with deuterium at rates that vary based on a number of factors, including protein secondary structure, solvent accessibility, pH, and temperature. For a backbone amide hydrogen in an unstructured region of the protein in a solution at neutral pH, the chemical exchange rate is on the order of milliseconds.11 However, in a folded protein this exchange rate can vary significantly from minutes to days as a result of the sequence, structure of the protein, accessibility of a given region to solvent, and protein backbone dynamics.12 Upon ligand binding to a protein, changes in accessibility to solvent and to protein structural fluctuations can occur at the ligand binding site and elsewhere in the structure that can protect the protein from exchange.13,14 This allows HDX-MS to be a useful technique to characterize the protein-ligand binding sites.15–17 However, it is also common that ligand binding can affect overall protein stability and dynamics in other structural regions distant from the binding site. This effect can make it difficult to distinguish which decreases in HDX result from local protection due to ligand binding and which are caused by allosteric effects that lead to distant protection against exchange.
Covalent labeling (CL) MS is another method that has been used to characterize protein-ligand complexes.6, 18–22 In CL, a labeling reagent is used to modify amino acid side chains of the protein by forming a covalent bond.23,24 This results in a mass shift that can be detected via MS. CL-MS can be used to study protein-ligand interactions because ligand binding decreases the solvent accessibility of the side chains involved in ligand binding. Decreased labeling at specific residues can be used to determine the ligand binding site. Covalent labeling techniques can be divided into two categories: amino acid specific labeling techniques (e.g. Lys-specific labeling)25 and non-specific labeling techniques (e.g. hydroxyl radical footprinting, carbene labeling, and DEPC labeling).24,26,27 Non-specific labeling techniques have a range of intrinsic reaction rates, ranging from ns for carbene labeling28,29 to μsec/ms for hydroxyl radical labeling30 to 10’s of seconds for DEPC labeling.31 The faster reacting CL reagents, such as hydroxyl radicals, are likely sensitive to changes in protein dynamics, whereas reagents that react more slowly, such as DEPC, are presumably transparent to protein dynamics.
Because HDX probes backbone amide hydrogens when used with MS and CL probes the solvent accessibility of side chains, these two methods are typically considered to be complementary. Indeed, several studies have used HDX together with CL to obtain more insight into protein structure and protein-ligand interactions.32–37 For example, Konermann and co-workers used HDX and oxidative labeling to more fully characterize membrane proteins,33 and Gross and co-workers have recently demonstrated the value of combining HDX and hydroxyl radical footprinting for antibody epitope mapping.34,35 We hypothesize, though, that as a result of the large differences in reaction rates between HDX and CL reagents like DEPC, the two techniques can provide synergistic information regarding structural changes that take place upon ligand binding. Ligand binding usually induces a decrease in local solvent accessibility at the binding site and often a decrease in protein dynamics at distant sites as proteins are often stabilized by interactions with the ligand. Because HDX responds to changes in both solvent accessibility and structural fluctuations, it sometimes provides ambiguous information with regard to ligand binding site. We predict that the slower labeling timescale for DEPC labeling should make it only sensitive to changes in solvent accessibility and insensitive to changes in protein dynamics. Moreover, because CL is typically done at a single reaction time point, the rate information that often reveals dynamic information in HDX would not be readily apparent in CL experiments. Thus, when used together, HDX and CL have the potential to provide clearer information about protein-ligand binding sites and changes in protein dynamics caused by ligand binding.
Here, we test this hypothesis by comparing HDX-MS and CL-MS on three model protein-ligand complexes. The model protein-ligand systems were chosen to represent protein complexes that range from ones that undergo substantial changes in protein dynamics upon ligand binding to ones that undergo almost no change in protein dynamics. From these experiments we show that when used together the two methods provide both complementary and synergistic information about protein-ligand interactions.
EXPERIMENTAL SECTION
Materials.
The materials used in this study are listed in the Supporting Information (SI).
Sample Preparation.
Proteins were prepared in a 20 mM MOPS buffer at pH 7.5 using the material as received, except for the maltose-binding protein (MBP), which was first buffer exchanged, as described in the SI, into a 20 mM phosphate buffer at pH 7.5. The concentrations before beginning the CL or HDX experiments were 25 or 35 μM for all the proteins. Stock solutions (5 mM) of the brinzolamide were prepared in 1:1 (v/v) acetonitrile and water due to the limited water solubility of this compound. For experiments involving brinzolamide bound to bovine carbonic anhydrase (BCA), the molar ratio between protein and ligand was always 1:1. This ratio was sufficient to lead to more than 99% bound, even after dilution for the HDX experiments, based on the known Kd of 0.1 nM.38 The final concentration of acetonitrile in the prepared sample was always below 1% (v/v). Maltose stock solutions were prepared in 20 mM phosphate buffer, and a maltose concentration of 480 μM was used for the maltose-MBP binding experiments. Based on the known MBP-maltose Kd of 1.5 μM,39 this molar ratio resulted in greater than 99% protein bound during the CL experiments and greater than 90% bound during the HDX experiments.
HDX-MS Experiments.
D2O was prepared in the buffer appropriate for each protein, as indicated above. The pD was adjusted via a pH meter corrected by the following relationship: pD = pH reading + 0.41.40,41 HDX experiments were conducted using the Leap HDX Automation Manager as part of the Waters nanoACQUITY UPLC system (Waters Corporation, Milford, MA, USA). The HDX procedure, including the exchange reaction, quench, proteolytic digestion, LC separation, and MS conditions are detailed in the SI.
Peptides were identified as having statistically significant differences in deuterium uptake between ligand-bound and ligand-free states if at least two out of three exchange time points (i.e. 10 s, 10 min, and 4 (or 24) h) showed significantly different deuterium uptake levels. The 10 s, 10 min, and 4 h (or 24 h) time points were chosen to represent short, medium, and long exchange times, respectively. Statistical differences in uptake were determined using the following two-step statistical cutoff: 1) a difference in deuterium uptake between the ligand bound and ligand free states at a given time point was larger than the global deuterium uptake significance limit as described by Hageman and Weis,42 the value of which was decided with a 99% confidence interval; and 2) the relative deuterium uptake of the two states at a given time point were significantly different from one another according to a Welch’s t-test at a 99% confidence interval.
CL-MS Experiments.
In all CL experiments, conditions were chosen to control labeling to 1 to 1.5 labels on average per protein molecule to maintain the structural integrity of the protein during the modification reactions.23,24 DEPC labeling was performed following procedures and conditions previously developed by our group.31,43 DEPC is capable of labeling His, Lys, Tyr, Ser, Thr, and free Cys residues, with Cys, His, and Lys being the most reactive.23,24 DEPC stock solutions were prepared in acetonitrile. The reaction was initiated by adding an aliquot of the DEPC stock solution into the prepared sample. The final concentration of DEPC was 120 μM for myoglobin, 360 μM for BCA, 300 μM for MBP. The final volume of acetonitrile was less than 1% (v/v) in all experiments. The reaction proceeded at 37 °C for 1 min and then was quenched by the addition of imidazole at a final concentration of 10 mM. The dimethyl(2-hydroxy-5-nitrobenzyl)sulfonium bromide (HNSB) labeling reactions were initiated by adding an aliquot of an HNSB solution at 2.7 mM to the prepared sample. The reactions were allowed to proceed at room temperature for 3 min before being stopped by the addition of tryptophan at 5 mM. After the protein labeling reactions, the samples were prepared for digestion using the procedure described in the SI.
The digested proteins were analyzed by LC/MS on a Thermo Scientific (Waltham, MA) Orbitrap Fusion mass spectrometer with a nano-electrospray ionization source. The MS, tandem MS, and LC-MS parameters are described in detail in the SI.
For peptide identification and determination of CL extents, a custom software pipeline specifically designed for protein CL-MS studies was used.44,45 Residue level CL modification percentages (% labeling) were determined from the chromatographic peak areas of modified and unmodified peptides and by applying eq. 1.
| (1) |
In eq. 1, Ai,z represents the peptide peak area from any given peptide (i) that contains the residue of interest, and considers all detectable charge states (z) for that peptide. The resulting modification percentage is a relative rather than an absolute value because the modified and unmodified peptides have different ionization efficiencies and elute at different retention times. It is important to note that % labeling, as determined by eq. 1, can only be used if all the charge states that are summed are present in all samples, and this was the case for the reported data. Unpaired student t-tests with a 99% confidence interval were used to determine if a given residue underwent a change in labeling when the ligand was present as compared to when the ligand was absent.
RESULTS AND DISCUSSION
Myoglobin.
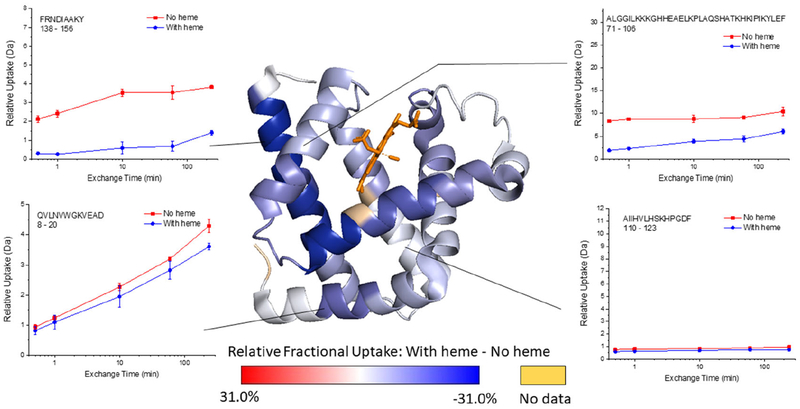
Holomyoglobin (i.e. heme bound) and apomyoglobin were selected to test our hypothesis that DEPC labeling is insensitive to protein dynamics and thus can provide synergistic information when combined with HDX-MS. Apomyoglobin is known to be more dynamic than holomyoglobin,46,47 making myoglobin an excellent model system. Comparative HDX-MS measurements of holomyoglobin and apomyoglobin result in a large number of peptides that undergo a statistically significant change in deuterium uptake (Figure 1, Table S1, and Figure S1). Twenty-one measured peptides undergo significant changes and come from four regions of the protein that include residues 12–29, 30–69, 70–106, and 137–153 (see Table S1). We only observe decreases in deuterium uptake in holomyoglobin and do not observe any peptides that significantly increase in deuterium uptake upon ligand binding. Results from HDX/MS indicate that the presence of the heme significantly stabilizes the protein, especially in the region spanned by residues 30–106, which is consistent with previous studies by NMR46,48 and HDX-MS.47,49 Interestingly, exchange decreases are apparent throughout the protein upon ligand binding and are not localized to just the ligand binding site. Peptides in the heme-binding pocket, including parts of residues 30–69 and 70–106, as well as other regions not directly involved in the heme-binding site (e.g. 137–153) or even remote from the binding pocket (e.g. 12–29) also have significantly decreased deuterium uptake. With the HDX-MS data alone, it would be difficult to identify the heme binding site due to the widespread stabilization of the protein.
Figure 1.
Representative deuterium uptake plots for myoglobin (i.e. with heme) and apomyoglobin (i.e. without heme), and the relative fractional uptake (at the 4 h exchange time point) mapped onto the holo myoglobin structure (PDB 1DWR). The darker the blue color on the structure, the more the HDX decreases upon heme binding. Calculations of the Relative Fractional Uptake of deuterium, as mapped on the protein structure, were performed using the Waters DynamX software (see the Supporting Information for more details).
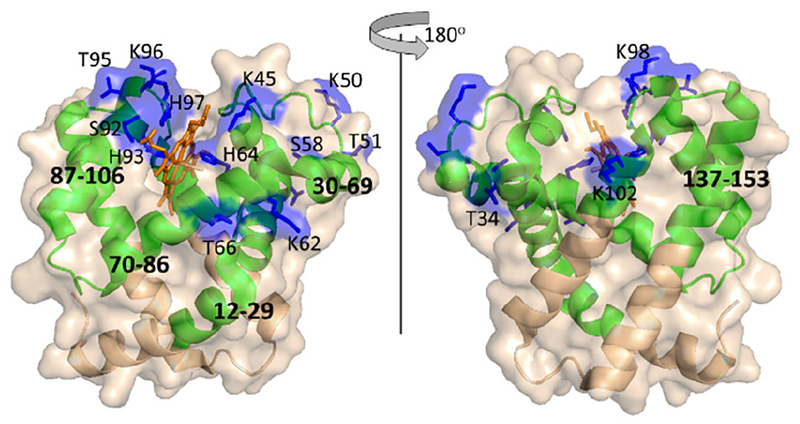
Changes in CL-MS with and without the heme are not as widespread throughout the protein. Several residues have significant decreases in labeling upon heme binding, including T34, K45, K50, T51, K62, H64, S92, H93, T95, K96, H97, K98, and K102 (Figure S2), and these residues are primarily localized around the heme-binding site (Figure S3). A few of these residues (K50, T51, S58, and K62) are about 12 Å from the heme in the bound form. While these residues are not immediately next to the heme, the fact that these residues lie in an unstructured loop or in a helix that interacts with the heme causes us to surmise that heme binding induces a rearrangement of these side chains. These rearrangements could change their solvent accessibility and/or microenvironment, which would influence their reactivity with DEPC.
More importantly, there are several protein regions that undergo significant decreases in HDX in holomyoglobin (e.g. 12–29, 71–86, 143–151) (Figure 2), but show no significant changes in CL. These regions of the protein are stabilized in holomyoglobin, but because they do not directly interact with the heme, they presumably do not undergo significant changes in solvent accessibility or microenvironment. Residues 12–29 contain a DEPC-modified residue, K16; however, this residue does not experience a significant change in labeling extent (Figure S2). Residues K76, K77, K78, H80, and H81, which all fall within region 71–86, are modified by DEPC, but none of them show significant decreases in CL (Figure S2). While residues 71–86 are part of the larger region of the protein that is significantly stabilized by heme binding,46,47 they do not interact with the heme so their solvent exposure and microenvironment likely remains relatively unchanged. A similar result is obtained for residues between 143 and 151. Our results and previous HDX-MS results indicate protection in this region upon heme binding,47 but the CL changes that K145, Y146 and K147 undergo are not significant at a 99% confidence interval (Figure S2).
Figure 2.
A comparison of the differential CL and HDX results for myoglobin mapped on its crystal structure (PDB 1DWR). Regions that undergo significant decreases in HDX upon heme binding are shown in green. Residues that undergo significant decreases in DEPC labeling are shown in blue.
Overall, the myoglobin data support our hypothesis that CL by DEPC is relatively insensitive to changes in dynamics as a result of its relatively slow reaction rate. Residues in protein regions that undergo changes in their transient folding/unfolding (i.e. dynamics) do not undergo changes in DEPC reactivity because the reagent reacts too slowly to respond to these transient changes in solvent accessibility, whereas HDX is sensitive to these changes because the H to D exchange reaction is orders of magnitude faster. Heme binding in holomyoglobin stabilizes the protein, causing several regions (e.g. 12–29, 71–86, and 143–151) to sample solvent exposed states less frequently (i.e. become less dynamic) and thus undergo decreased HDX. These same regions either undergo no significant change in solvent accessibility/microenvironment or the lifetimes of these more solvent exposed states are too short to allow labeling by DEPC. It is also important to note that the DEPC reactions are done at a single time point (i.e. 60 s), whereas the HDX measurements are done at time points ranging from 10 s to 4 h. Consequently, it is possible that there is not enough time to populate the solvent exposed states for sufficient CL by slow-reacting DEPC. Because CL by DEPC is primarily affected by changes in solvent exposure caused by ligand (i.e. heme) binding, DEPC-based CL and HDX-MS can provide synergistic structural information. HDX-MS indicates regions that are both protected by heme binding and undergo decreased structural fluctuations, while CL by DEPC is predominantly sensitive to decreases in solvent accessibility. When used together, the techniques provide a more definitive picture of the binding site and binding-induced stabilization.
Bovine Carbonic Anhydrase II.
The second model system we selected was bovine carbonic anhydrase II (BCA) and its inhibitor brinzolamide. Extensive studies of human carbonic anhydrase II (HCA) indicate that brinzolamide does not cause a significant structural or dynamic change to the protein.50,51 BCA and HCA have a high degree of sequence and structural homology (Figure S4), thus brinzolamide binding has a similarly small effect on BCA.50 This model system provides another test of the complementarity and potential synergy of DEPC-based CL and HDX-MS measurements.
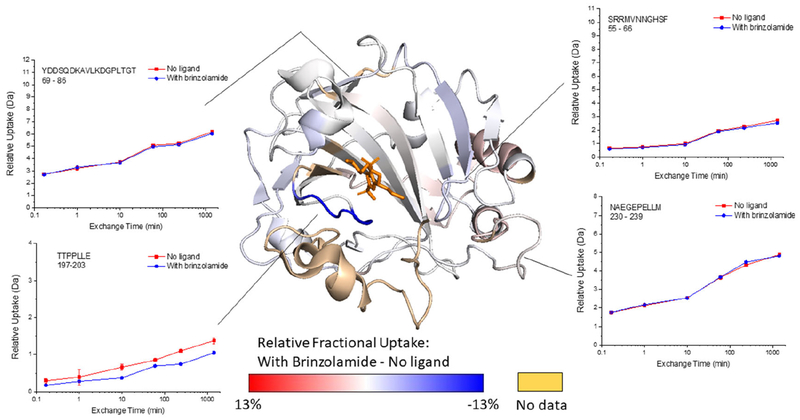
The vast majority of BCA undergoes no significant change in HDX for up to 24 h when brinzolamide is bound (Figure 3 and Figure S5), which is consistent with the known effects of ligand binding. However, there is one peptide, 197–203, that undergoes a measurable, albeit subtle change in exchange. This peptide contains Thr197, Thr198, and Pro202, which are residues known to interact with brinzolamide in the binding pocket of the protein.52 Presumably, the decreased HDX of this peptide is due to decreased solvent exposure upon ligand binding.
Figure 3.
Representative deuterium uptake plots for BCA and the BCA-brinzolamide complex, and the relative fractional uptake (at the 24 h exchange time point) mapped onto the BCA crystal structure (PDB 1V9E), with the position of brinzolamide adapted from HCA-brinzolamide complex (PDB 1A42). The darker the blue color on the structure, the more the HDX decreases upon ligand binding. Calculations of the Relative Fractional Uptake of deuterium, as mapped on the protein structure, were performed using the Waters DynamX software (see the Supporting Information for more details).
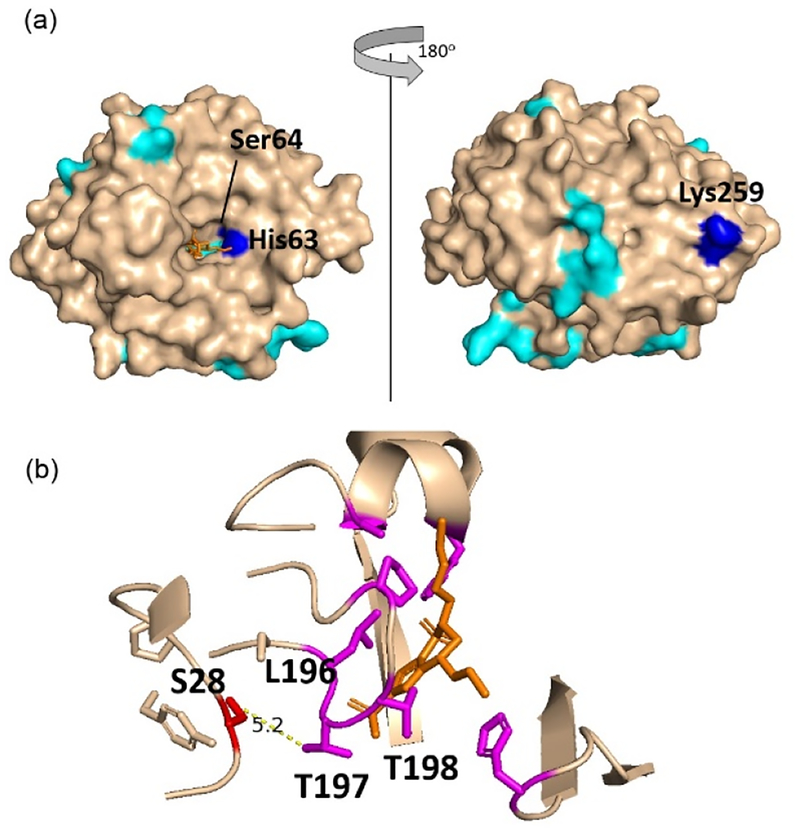
When BCA is labeled with DEPC, 19 residues are modified, but only His63, Ser64 and Lys259 undergo a significant decrease in labeling in the presence of brinzolamide, while Ser28 significantly increases in labeling upon ligand binding (Figure S6). Unfortunately, no labeled residues were measured between residues 197 and 203. His63 and Ser64 are on the edge of the brinzolamide binding pocket, so it is not surprising that their labeling extent decreases in the presence of the ligand (Figure 4a). The decreased labeling by Lys259, which is the C-terminal residue, is more difficult to explain. Upon brinzolamide binding, this residue reorients itself but does not undergo a significant change in SASA. The increased labeling of Ser28 was unexpected because its solvent accessible surface area does not change upon ligand binding. One possible explanation is that its local microenvironment changes upon brinzolamide binding. Ser28 is about 5 Å from Thr198, which interacts with brinzolamide (Figure 4b). Perhaps the presence of brinzolamide decreases the pKa of the Ser side chain, making it more reactive with DEPC.
Figure 4.
(a) Structure of bovine carbonic anhydrase with sites undergoing no change in covalent labeling (cyan) or a significant decrease in covalent labeling (blue) with binding site residues His63 and Ser64 indicated. (b) Expanded region around the brinzolamide binding site in bovine carbonic anhydrase, indicating residues (in magenta) interacting with brinzolamide (orange) and the proximity of Ser 28 (red) to the binding residues.
Applying HDX/MS and CL/MS to BCA demonstrates that the two techniques can provide complementary information. HDX reveals that the protein undergoes very little change in dynamics or structure upon ligand binding, although decreased exchange is observed in some parts of the ligand binding site. CL provides complementary insight by revealing other regions of the ligand binding site that undergo decreased solvent accessibility that are not reported by HDX/MS. Moreover, CL at Ser28 is affected indirectly by ligand binding, revealing a subtle change in structure around the binding site.
Maltose Binding Protein.
For a third model system we selected the maltose binding protein (MBP) and its ligand maltose, which is known to undergo a conformational change upon ligand binding. Two globular domains in MBP are connected by a hinge region that includes a short helix (around residues 315–328) and a two-stranded B-sheet (around residues 167–184).53 These two domains adopt an “open” and “closed” state by a hinge rotation of 35° (Figure S7).54–56 According to previous NMR studies, this conformational change occurs with no significant dynamic changes in MBP induced by maltose binding.57 Such a conformational rearrangement with minimal dynamics changes allows this protein-ligand system to reveal other aspects of the synergy provided by CL and HDX-MS measurements.
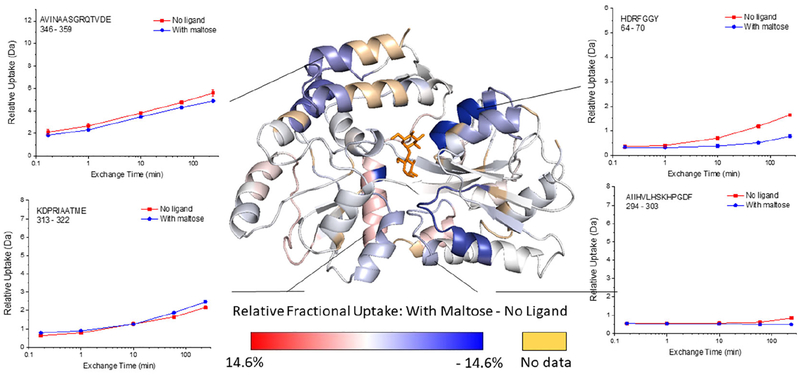
HDX indicates that 10 out of 125 detected peptides (Figure 5, Table S2, and Figure S8) have a significant decrease in exchange, and these peptides span four regions of the protein: 8–22, 62–76, 322–336 and 346–361 (Figure S9). The peptides 8–22 and 62–75 contain residues that line the ligand-binding pocket and form hydrogen bonds with maltose.53,58 The peptide 322–336 represents part of the hinge region and also has residues that are as close as 4 Å from the maltose binding site. The peptide 346–361 is remote from ligand binding site and also is not part of the hinge region, suggesting that this region undergoes dynamic changes that were too subtle or occur on the a different timescale to have been detected in previous NMR experiments.57
Figure 5.
Representative deuterium uptake plots for maltose binding protein (MBP) and the MBP-maltose complex, and the relative fractional uptake (at the 4 h exchange time point) mapped onto the MBP-maltose complex crystal structure (PDB ID 1ANF). The darker the blue color on the structure, the more the HDX decreases upon ligand binding. Calculations of the Relative Fractional Uptake of deuterium, as mapped on the protein structure, were performed using the Waters DynamX software (see the Supporting Information for more details).
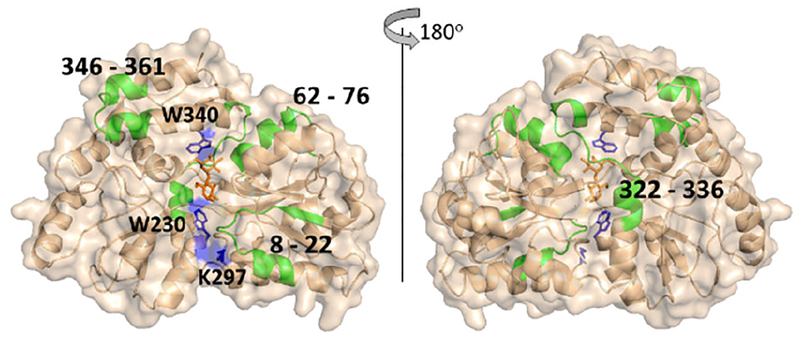
DEPC labeling of MBP results in 26 modified residues, yet only Lys297 shows a statistically significant decrease in labeling upon ligand binding (Figure S10). Unfortunately, of the seven modifiable residues (Lys15, Tyr17, His64, Tyr70, Lys326, Ser252, Thr356) in the four regions that undergo changes in HDX (i.e. 8–22, 62–76, 322–336 and 346–361), none of them are found to be labeled by DEPC. The residue that does decrease in labeling, Lys297, is partially buried when the protein undergoes the conformational change from the open to closed state. This observation is also supported by the change in solvent accessible surface area (SASA) of Lys297 from 38% in the open state to 23% in the closed state. This decrease in SASA of Lys297 is the most significant decrease among all the measured DEPC modified residues upon ligand binding and the conformational change (Table S3). A few residues become relatively more exposed upon ligand binding, such as Lys25 and Lys189, but these residues are already very exposed to solvent, and we have found that residues that are already highly exposed rarely undergo significant increases in labeling.45 In other words, CL is more sensitive to decreases in SASA.
Because there are a limited number of residues along the maltose binding pocket that can be modified by DEPC, we applied another labeling reagent, HNSB, which specifically modifies tryptophan side chains with reaction kinetics that are similarly as slow as DEPC.23 HNSB was chosen because there are two Trp residues (Trp230 and Trp340) near the binding site. Eight Trp residues are labeled by HNSB, and only Trp230 and Trp340 significantly decrease in labeling extent upon ligand binding. It should be noted that Trp232, which is located near the hinge region also undergoes a notable decrease in SASA (Table S3) but does not significantly decrease in labeling extent. The reasons for this are not clear.
Comparing the results from HDX and CL for the MBP-maltose system further indicate the value of obtaining results from both techniques. The two methods together provide a clearer picture of the ligand binding site (Figure 6). CL data from both DEPC and HNSB reveal only residues that decrease in labeling due to significant decreases in SASA. Lys297, Trp230, and Trp340 all significantly decrease in SASA value upon ligand binding and the associated conformational change, but these three residues alone are somewhat insufficient to fully map the binding site. The data from HDX-MS alone is also insufficient to identify the binding site because too many non-proximate regions of the protein undergo decreases in deuterium uptake in the presence of the ligand. Considering the data together, however, allows one to more confidently map the maltose binding site.
Figure 6.
A comparison of the differential CL and HDX results for the maltose binding protein mapped on its crystal structure (PDB 1ANF). Regions that undergo significant decreases in HDX upon maltose binding are shown in green. Residues that undergo significant decreases in DEPC labeling are shown in blue.
CONCLUSION
Using three model protein-ligand systems, we demonstrate that HDX-MS and CL-MS can provide complementary and synergistic information about protein-ligand interactions. For brinzolamide binding to BCA and maltose binding to MBP, the two techniques together provide separate information that more clearly indicates the ligand binding site. Changes in side chain solvent accessibility upon ligand binding cause significant decreases in CL that complement the decreases in HDX that also occur at the ligand binding site. When used together on the same protein-ligand system, the different timescales of the two labeling techniques can also provide information that is not accessible to either technique alone. This synergy is most clearly evident in the holomyoglobin and apomyoglobin comparison. Heme binding to holomyoglobin causes decreases in HDX at the ligand binding site and distant from the ligand binding site, which would make it difficult to definitively identify the heme binding site with HDX alone. In contrast, CL is only influenced by changes in side-chain solvent accessibility at the heme binding site and is insensitive to changes in protein structural fluctuations at sites distant from the heme binding site. When used together, HDX/MS and CL/MS provide more comprehensive information, revealing more clearly the binding site and ligand induced changes in protein structural fluctuations caused by the stabilizing effect of heme binding. With this better understanding of the complementarity and potential synergy of the two MS-based labeling techniques, we predict that these two methods will find widespread usage together for more deeply understanding protein-ligand systems that are important in areas such as drug discovery.
Supplementary Material
ACKNOWLEDGEMENTS
This work was supported by National Institutes of Health (NIH) grant R01 GM075092. The CL data described herein were acquired on a Thermofisher Orbitrap Fusion Tribrid mass spectrometer funded by NIH grant 1S10OD010645-01A1. The authors would like to thank Prof. Stephen J. Eyles for his helpful suggestions and for his help with the operation of the mass spectrometer used in this study.
Footnotes
SUPPORTING INFORMATION AVAILABLE
Materials and sample preparation descriptions; experimental procedures for HDX-MS and LC-MS; lists of peptides undergoing significant changes in HDX; deuterium uptake plots as a function of time for proteins with and without ligands; summaries of DEPC labeling percentages for proteins with and without ligands; DEPC labeling results mapped on protein crystal structures; and SASA values for residues in proteins are found in the Supporting Information.
REFERENCES
- (1).Baron R; McCammon JA Molecular Recognition and Ligand Association. Annu. Rev. Phys. Chem 2013, 64, 151–175. [DOI] [PubMed] [Google Scholar]
- (2).Babine RE, & Bender SL Molecular Recognition of Protein–Ligand Complexes: Applications to Drug Design. Chem. Rev 1997, 97, 1359–1472. [DOI] [PubMed] [Google Scholar]
- (3).Du X; Li Y; Xia Y-L; Ai S-M; Liang J; Sang P; Ji X-L; Liu S-Q Insights into Protein–Ligand Interactions: Mechanisms, Models, and Methods. Int. J. Mol. Sci 2016, 17, 144. [DOI] [PMC free article] [PubMed] [Google Scholar]
- (4).Riccardi Sirtori F; Altomare A; Carini M; Aldini G; Regazzoni L MS methods to study macromolecule-ligand interaction: Applications in drug discovery. Methods 2018, 144, 152–174. [DOI] [PubMed] [Google Scholar]
- (5).Kitova EN; El-Hawiet A; Schnier PD; Klassen JS Reliable Determinations of Protein–Ligand Interactions by Direct ESI-MS Measurements. Are We There Yet? J. Am. Soc. Mass Spectrom 2012, 23, 431–441. [DOI] [PubMed] [Google Scholar]
- (6).Guan J-Q; Vorobiev S; Almo SC; Chance MR Mapping the G-Actin Binding Surface of Cofilin Using Synchrotron Protein Footprinting. Biochemistry 2002, 41, 5765–5775. [DOI] [PubMed] [Google Scholar]
- (7).Liu XR; Zhang MM; Rempel DL; Gross ML A Single Approach Reveals the Composite Conformational Changes, Order of Binding, and Affinities for Calcium Binding to Calmodulin. Anal. Chem 2019, 91, 5508–5512. [DOI] [PMC free article] [PubMed] [Google Scholar]
- (8).Rogstad S; Faustino A; Ruth A; Keire D; Boyne M; Park J A Retrospective Evaluation of the Use of Mass Spectrometry in FDA Biologics License Applications. J. Am. Soc. Mass Spectrom 2017, 28, 786–794. [DOI] [PubMed] [Google Scholar]
- (9).Beck A; Diemer H; Ayoub D; Debaene F; Wagner-Rousset E; Carapito C; Van Dorsselaer A; Sanglier-Cianférani S Analytical characterization of biosimilar antibodies and Fc-fusion proteins. Trends Anal. Chem 2013, 48, 81–95. [Google Scholar]
- (10).Kaltashov IA; Bobst CE; Abzalimov RR; Wang G; Baykal B; Wang S Advances and challenges in analytical characterization of biotechnology products: mass spectrometry-based approaches to study properties and behavior of protein therapeutics. Biotechnol. Adv 2012, 30, 210–222. [DOI] [PMC free article] [PubMed] [Google Scholar]
- (11).Bai Y; Milne JS; Mayne L; Englander SW Primary structure effects on peptide group hydrogen exchange. Proteins Struct. Funct. Bioinform 1993, 17, 75–86. [DOI] [PMC free article] [PubMed] [Google Scholar]
- (12).Englander SW Hydrogen exchange and mass spectrometry: A historical perspective. J. Am. Soc. Mass Spectrom 2006, 17, 1481–1489. [DOI] [PMC free article] [PubMed] [Google Scholar]
- (13).Powell KD; Ghaemmaghami S; Wang MZ; Ma L; Oas TG; Fitzgerald MC A General Mass Spectrometry-Based Assay for the Quantitation of Protein–Ligand Binding Interactions in Solution. J. Am. Chem. Soc 2002, 124, 10256–10257. [DOI] [PubMed] [Google Scholar]
- (14).Zhu MM; Rempel DL; Du Z; Gross ML Quantification of Protein–Ligand Interactions by Mass Spectrometry, Titration, and H/D Exchange: PLIMSTEX. J. Am. Chem. Soc 2003, 125, 5252–5253. [DOI] [PubMed] [Google Scholar]
- (15).Chalmers MJ; Busby SA; Pascal BD; West GM; Griffin PR Differential hydrogen/deuterium exchange mass spectrometry analysis of protein-ligand interactions. Expert Rev. Proteomics 2011, 8, 43–59. [DOI] [PMC free article] [PubMed] [Google Scholar]
- (16).Iacob RE; Engen JR Hydrogen exchange mass spectrometry: are we out of the quicksand? J. Am. Soc. Mass Spectrom 2012, 23, 1003–1010. [DOI] [PMC free article] [PubMed] [Google Scholar]
- (17).Percy AJ; Rey M; Burns KM; Schriemer DC Probing protein interactions with hydrogen/deuterium exchange and mass spectrometry-a review. Anal. Chim. Acta 2012, 721, 7–21. [DOI] [PubMed] [Google Scholar]
- (18).Liu T, Marcinko TM, Kiefer PA, & Vachet RW Using Covalent Labeling and Mass Spectrometry To Study Protein Binding Sites of Amyloid Inhibiting Molecules. Anal. Chem 2017, 89, 11583–11591. [DOI] [PMC free article] [PubMed] [Google Scholar]
- (19).Li Z; Moniz H; Wang S; Ramiah A; Zhang F; Moremen KW; Linhardt RJ; Sharp JS High Structural Resolution Hydroxyl Radical Protein Footprinting Reveals an Extended Robo1-Heparin Binding Interface. J. Biol. Chem 2015, 290, 10729–10740. [DOI] [PMC free article] [PubMed] [Google Scholar]
- (20).Rashidzadeh H; Khrapunov S; Chance MR; Brenowitz M Solution Structure and Interdomain Interactions of the Saccharomyces cerevisiae “TATA Binding Protein” (TBP) Probed by Radiolytic Protein Footprinting. Biochemistry 2003, 42, 3655–3665. [DOI] [PubMed] [Google Scholar]
- (21).Hambly D; Gross M Laser flash photochemical oxidation to locate heme binding and conformational changes in myoglobin. Int. J. Mass Spectrom 2007, 259, 124–129. [Google Scholar]
- (22).Zhang H; Gau BC; Jones LM; Vidavsky I; Gross ML Fast Photochemical Oxidation of Proteins (FPOP) for Comparing Structures of Protein/Ligand Complexes: The Calmodulin-peptide Model System. Anal. Chem 2011, 83, 311–318. [DOI] [PMC free article] [PubMed] [Google Scholar]
- (23).Mendoza VL; Vachet RW Probing protein structure by amino acid-specific covalent labeling and mass spectrometry. Mass Spectrom. Rev 2009, 28, 785–815. [DOI] [PMC free article] [PubMed] [Google Scholar]
- (24).Limpikirati P; Liu T; Vachet RW Covalent labeling-mass spectrometry with non-specific reagents for studying protein structure and interactions. Methods 2018, 144, 79–93. [DOI] [PMC free article] [PubMed] [Google Scholar]
- (25).Suckau D; Mak M; Przybylski M Protein surface topology-probing by selective chemical modification and mass spectrometric peptide mapping. Proc. Natl. Acad. Sci. USA 1992, 89, 5630–5634. [DOI] [PMC free article] [PubMed] [Google Scholar]
- (26).Xu G; Chance MR Hydroxyl Radical-Mediated Modification of Proteins as Probes for Structural Proteomics. Chem. Rev 2007, 107, 3514–3543. [DOI] [PubMed] [Google Scholar]
- (27).Zhang B; Cheng M; Rempel D; Gross ML Implementing fast photochemical oxidation of proteins (FPOP) as a footprinting approach to solve diverse problems in structural biology. Methods 2018, 144, 94–103. [DOI] [PMC free article] [PubMed] [Google Scholar]
- (28).Jumper CC; Schriemer DC Mass Spectrometry of Laser-Initiated Carbene Reactions for Protein Topographic Analysis. Anal. Chem 2011, 83, 2913–2920. [DOI] [PubMed] [Google Scholar]
- (29).Jumper CC; Bomgarden R; Rogers J; Etienne C; Schriemer DC High-Resolution Mapping of Carbene-Based Protein Footprints. Anal. Chem 2012, 84, 4411–4418. [DOI] [PubMed] [Google Scholar]
- (30).Gau BC; Sharp JS; Rempel DL; Gross ML Fast Photochemical Oxidation of Protein Footprints Faster than Protein Unfolding. Anal. Chem 2009, 81, 6563–6571. [DOI] [PMC free article] [PubMed] [Google Scholar]
- (31).Mendoza VL; Vachet RW Protein surface mapping using diethylpyrocarbonate with mass spectrometric detection. Anal. Chem 2008, 80, 2895–2904. [DOI] [PMC free article] [PubMed] [Google Scholar]
- (32).Zheng X; Wintrode PL; Chance MR Complementary structural mass spectrometry techniques reveal local dynamics in functionally important regions of a metastable serpin. Structure 2008, 16, 38–51. [DOI] [PubMed] [Google Scholar]
- (33).Pan Y; Piyadasa H O’Neil JD; Konermann L Conformational Dynamics of a Membrane Transport Protein Probed by H/D Exchange and Covalent Labeling: The Glycerol Facilitator. J. Mol. Biol 2012, 416, 400–413. [DOI] [PubMed] [Google Scholar]
- (34).Li J; Wei H; Krystek SR Jr.; Bond D; Brender TM; Cohen D; Feiner J; Hamacher N; Harshman J; Huang RY-C;H Julien SH; Lin Z; Moore K.; Mueller, L.; Noriega C; Sejwal P; Sheppard P; Stevens B; Chen G; Tymiak AA; Gross ML; Schneeweis LA Mapping the Energetic Epitope of an Antibody/Interleukin-23 Interaction with Hydrogen/Deuterium Exchange, Fast Photochemical Oxidation of Proteins Mass Spectrometry, and Alanine Shave Mutagenesis. Anal. Chem 2017, 89, 2250–2258. [DOI] [PMC free article] [PubMed] [Google Scholar]
- (35).Li KS; Chen G; Mo J; Huang RY-C; Deyanova EG; Beno BR; O’Neil SR; Tymiak AA; Gross ML Orthogonal Mass Spectrometry-Based Footprinting for Epitope Mapping and Structural Characterization: The IL-6 Receptor upon Binding of Protein Therapeutics. Anal. Chem 2017, 89, 7742–7749. [DOI] [PMC free article] [PubMed] [Google Scholar]
- (36).Borotto NB; Zhang Z; Dong J; Burant B; Vachet RW Increased β-Sheet Dynamics and D–E Loop Repositioning Are Necessary for Cu(II)-Induced Amyloid Formation by β−2-Microglobulin. Biochemistry 2017, 56, 1095–1104. [DOI] [PMC free article] [PubMed] [Google Scholar]
- (37).Shi L; Liu T; Gross ML; Huang Y Recognition of Human IgG1 by Fcγ Receptors: Structural Insights from Hydrogen-Deuterium Exchange and Fast Photochemical Oxidation of Proteins Coupled with Mass Spectrometry. Biochemistry 2019, 58, 1074–1080. [DOI] [PMC free article] [PubMed] [Google Scholar]
- (38).Boriack-Sjodin PA; Zeitlin S; Chen H-H; Crenshaw L; Gross S; Dantanarayana A; Delgado P; May JA; Dean T; Christianson DW Structural analysis of inhibitor binding to human carbonic anhydrase II. Protein Sci 1998, 7, 2483–2489. [DOI] [PMC free article] [PubMed] [Google Scholar]
- (39).Walker IH; Hsieh P; Riggs PD Mutations in maltose-binding protein that alter affinity and solubility properties. Appl. Microbiol. Biotechnol 2010, 88, 187–197. [DOI] [PMC free article] [PubMed] [Google Scholar]
- (40).Glasoe PK; Long FA Use of Glass Electrodes to Measure Acidities in Deuterium Oxide. J. Phys. Chem 1960, 64, 188–190. [Google Scholar]
- (41).Krȩżel A; Bal WA A formula for correlating pKa values determined in D2O and H2O. J. Inorg. Biochem 2004, 98, 161–166. [DOI] [PubMed] [Google Scholar]
- (42).Hageman TS; Weis DD Reliable Identification of Significant Differences in Differential Hydrogen Exchange-Mass Spectrometry Measurements Using a Hybrid Significance Testing Approach. Anal. Chem 2019, 91, 8008–8016. [DOI] [PubMed] [Google Scholar]
- (43).Zhou Y; Vachet RW Increased Protein Structural Resolution from Diethylpyrocarbonate-based Covalent Labeling and Mass Spectrometric Detection. J. Am. Soc. Mass Spectrom 2012, 23, 708–717. [DOI] [PMC free article] [PubMed] [Google Scholar]
- (44).Borotto NB; Zhou Y; Hollingsworth SR; Hale JE; Graban EM; Vaughan RC; Vachet RW Investigating Therapeutic Protein Structure with Diethylpyrocarbonate Labeling and Mass Spectrometry. Anal. Chem 2015, 87, 10627–10634. [DOI] [PMC free article] [PubMed] [Google Scholar]
- (45).Limpikirati P; Hale JE; Hazelbaker M; Huang Y, Jia Z, Yazdani M; Vachet RW Covalent labeling and mass spectrometry reveal subtle higher order structural changes for antibody therapeutics. mAbs 2019, 11, 463–476. [DOI] [PMC free article] [PubMed] [Google Scholar]
- (46).Eliezer D; Wright PE Is apomyoglobin a molten globule? Structural characterization by NMR. J. Mol. Biol 1996, 263, 531–538. [DOI] [PubMed] [Google Scholar]
- (47).Pan J; Han J; Borchers CH; Konermann L Hydrogen/Deuterium Exchange Mass Spectrometry with Top-Down Electron Capture Dissociation for Characterizing Structural Transitions of a 17 kDa Protein. J. Am. Chem. Soc 2009, 131, 12801–12808. [DOI] [PubMed] [Google Scholar]
- (48).Eliezer D; Yao J; Dyson HJ; Wright PE Structural and dynamic characterization of partially folded states of apomyoglobin and implications for protein folding. Nat. Struct. Mol. Biol 1998, 5, 148. [DOI] [PubMed] [Google Scholar]
- (49).Johnson RS; Walsh KA Mass spectrometric measurement of protein amide hydrogen exchange rates of apo- and holo-myoglobin. Protein Sci 1994, 3, 2411–2418. [DOI] [PMC free article] [PubMed] [Google Scholar]
- (50).Krishnamurthy VM; Kaufman GK; Urbach AR; Gitlin I; Gudiksen KL; Weibel DB; Whitesides GM Carbonic Anhydrase as a Model for Biophysical and Physical-Organic Studies of Proteins and Protein–Ligand Binding. Chem. Rev 2008, 108, 946–1051. [DOI] [PMC free article] [PubMed] [Google Scholar]
- (51).Jain A; Whitesides GM; Alexander RS; Christianson DW Identification of Two Hydrophobic Patches in the Active-Site Cavity of Human Carbonic Anhydrase II by Solution-Phase and Solid-State Studies and Their Use in the Development of Tight-Binding Inhibitors. J. Med. Chem 1994, 37, 2100–2105. [DOI] [PubMed] [Google Scholar]
- (52).Stams T; Chen Y; Boriack-Sjodin PA; Hurt JD; Liao J; May JA; Dean T; Laipis P; Silverman DN; Christianson DW Structures of murine carbonic anhydrase IV and human carbonic anhydrase II complexed with brinzolamide: molecular basis of isozyme-drug discrimination. Protein Sci 1998, 7, 556–563. [DOI] [PMC free article] [PubMed] [Google Scholar]
- (53).Spurlino JC; Lu GY; Quiocho FA The 2.3-Å resolution structure of the maltose- or maltodextrin-binding protein, a primary receptor of bacterial active transport and chemotaxis. J. Biol. Chem 1991, 266, 5202–5219. [DOI] [PubMed] [Google Scholar]
- (54).Sharff AJ; Rodseth LE; Spurlino JC; Quiocho FA Crystallographic evidence of a large ligand-induced hinge-twist motion between the two domains of the maltodextrin binding protein involved in active transport and chemotaxis Biochemistry 1992, 31, 10657–10663. [DOI] [PubMed] [Google Scholar]
- (55).Tang C; Schwieters CD; Clore GM Open-to-closed transition in apo maltose-binding protein observed by paramagnetic NMR. Nature 2007, 449, 1078–1082. [DOI] [PubMed] [Google Scholar]
- (56).Bucher D; Grant BJ; McCammon JA Induced Fit or Conformational Selection? The Role of the Semi-closed State in the Maltose Binding Protein. Biochemistry 2011, 50, 10530–10539. [DOI] [PMC free article] [PubMed] [Google Scholar]
- (57).Evenäs J; Tugarinov V; Skrynnikov NR; Goto NK; Muhandiram R; Kay LE Ligand-induced structural changes to maltodextrin-binding protein as studied by solution NMR spectroscopy. J. Mol. Biol 2001, 309, 961–974. [DOI] [PubMed] [Google Scholar]
- (58).Quiocho FA; Spurlino JC; Rodseth LE Extensive features of tight oligosaccharide binding revealed in high-resolution structures of the maltodextrin transport/chemosensory receptor. Structure 1997, 5, 997–1015. [DOI] [PubMed] [Google Scholar]
Associated Data
This section collects any data citations, data availability statements, or supplementary materials included in this article.


