Abstract
The long-lasting stability of nanoparticle (NP) suspensions in aqueous solution is one of the main challenges in colloidal science. The addition of surfactants is generally adopted to increase the free energy barrier between NPs and hence to ensure a more stable condition avoiding the NP sedimentation. However, a tailored prediction of surfactant concentration enabling a good dispersion of NPs is still an ambitious objective. Here, we demonstrate the efficiency of coupling steered molecular dynamics (SMD) with the Langmuir theory of adsorption in the low surfactant concentration regime, to predict the adsorption isotherm of sodium-dodecyl-sulfate (SDS) on bare α-alumina NPs suspended in aqueous solution. The resulting adsorption free energy landscapes (FELs) are also investigated by tuning the percentage of SDS molecules coating the target bare NP. Our findings shed light on the competing role of enthalpic and entropic interaction contributions. On one hand, the adsorption is highly promoted by the tail–NP and tail–tail nonbonded interaction adhesion; on the other hand, our results unveil the entropic nature of water and surfactant steric effects occurring at the NP surface and preventing the adsorption. Finally, a thorough analysis on the steering works emphasizes the role of the NP curvature in the FEL of adsorption. In particular, we show that, moving from a solid infinite flat surface to a nanoscale particle, a deviation from a Markovian dynamics of adsorption occurs in close proximity to a curved solid–liquid interface. Here, both the NP curvature effect and nanoscale morphology promote a modification of the thermodynamics state of adsorption with a consequent splitting of the free energy profiles and the identification of specific sites of adsorption. The modeling framework suggested in this Article provides physical insights in the surfactant adsorption onto spherical NPs and suggests some guidelines to rationally design stable NP suspensions in aqueous solutions.
Short abstract
A novel methodology is presented for predicting the surfactant adsorption isotherm at low coverage on high-curvature nanoparticles by linking molecular dynamics and the Langmuir theory of adsorption.
Introduction
Surface-active agents, commonly known as surfactants, are amphiphilic molecules with widespread use in several industrial processes to achieve the long-lasting stability of nanocolloidal suspensions,1−3 emulsions,4,5 and foams.6,7 In fact, when two or more immiscible phases are mixed, the addition of surfactants promotes their adsorption at the phases’ interface thereby lowering the surface free energy and avoiding coalescence and separation of phases. The success of the industrial processes treating surface-active agents relies on a good prediction of the adsorption isotherm curves which connect the concentration of surfactants in suspension with the quantity adsorbed at the interfaces. Although several models and experimental approaches have been developed to facilitate the industrial production of surfactant-based products,8−10 many challenges, including the variety of physical and chemical interfacial mechanisms, are still limiting an exhaustive estimation of the adsorption isotherms with consequent issues in the rational design. In this Article we propose a molecular modeling-based approach to explore the competing role of enthalpic and entropic interaction contributions in the surfactant adsorption onto nanoparticles process. We analyze sodium-dodecyl-sulfates (SDSs) on alumina nanoparticles (NPs) suspended in aqueous solution because besides the specific system, it gives us a unique opportunity to validate the method by a comparison with the experiments. Beyond the validation of the model, our results shed light both on the driven adsorption contributions at the solid–liquid interface and on the nanoparticle curvature effects affecting the Markovian dynamics of adsorption.
The comprehension of surfactant adsorption phenomena at solid–liquid interfaces is key to rationally guiding the experimental preparation of nanocolloidal suspensions, including paints, inks, cosmetic products, and engineering nanofluids.1,11−13 However, dealing with adsorption phenomena at the solid–liquid interface requires both the analysis of the free energy change in transferring a single surfactant molecule and the investigation of the multiscale adsorption mechanisms regarding the overall NP and surfactant suspension. The thermodynamics of surfactant adsorption on a solid substrate has been primarily investigated by Nagarajan, who recalled the molecular thermodynamics theory to explain the different free energy contributions in transferring a single surfactant molecule from the bulk solution to the solid.14,15 However, because of the poor accuracy in capturing the physical and chemical details of nanoscale interfaces, pure thermodynamics-based models have revealed a strong inefficiency in predicting the free energy and consequentially the adsorption isotherms. On the other hand, molecular dynamics (MD) simulations have been successfully exploited to atomistically describe the interfacial environment, highlighting the variety of the free energy landscapes of surfactants approaching solid substrates.16,17 Enhanced-sampling algorithms, specifically well-tempered metadynamics,18 umbrella sampling,19,20 and steered molecular dynamics,21,22 have attracted considerable attention to explore the equilibrium states of adsorption without simulating the extensive natural progression of surfactant exchange from bulk to the solid interface. Interesting results have unveiled that ion exchange, ion pairing, dispersion forces, and hydrophobic bonding are the main adsorption mechanisms of surface-active molecules onto a solid substrate.23,24 More in general, the quality of solvents on one hand and the chemical, physical, and topographical features of the nanoscale interfaces on the other hand exhibit dominant roles in altering the process of adsorption and the orientation of surfactant molecules.25−28
Although the physical insights attained in the past decades by MD simulations have certainly advanced the understanding of the free energy of adsorption, the prediction of the adsorption isotherms from the perspective of pure MD still encounters remarkable deficiencies. In particular, modeling the entire process of adsorption in NP suspensions requires a simultaneous sampling of the bulk and interface. In fact, such exchanges of surfactants between interface and bulk can be extremely rare events for atomistic simulations, making the modeling infeasible in terms of computational expenses. Moreover, also enhanced sampling could result as inefficient to describe the multiscale and multiphase environment. To overcome these modeling challenges, some alternative pathways have been suggested in the literature to predict the adsorption isotherms.8,29,30 For example, Jaishankar et al.30 developed a combined approach of MD simulations and a molecular-thermodynamic theory (MTT) to predict adsorption isotherms of organic friction modifiers on iron oxide flat surfaces. Farrow et al.,29 instead, carried out coarse-grained simulations in implicit solvent to estimate the adsorption isotherms of a surfactant onto a nanoparticle surface in a dilute suspension. However, very few works are focused on the NP curvature and entropic effects during the adsorption process,25,29,31 and a more thorough investigation from a modeling point of view is required for a tailored design of nanocolloidal suspensions stabilized by surfactants.
In this Article we present a multiscale modeling approach enabling the prediction of the adsorption isotherm of SDS molecules onto α-alumina NPs suspended in aqueous solution. The modeling framework is developed by coupling, in a synergistic way, steered molecular dynamics (SMD) simulations with the Langmuir theory of adsorption. First, the enhanced sampling provided by SMD simulations allows the extrapolation of the free energy of transferring one molecule from the bulk to the solid–liquid interface. Second, the minimum in the free energy landscape (FEL) is exploited in the Langmuir theory to compute the equilibrium constant and to define the adsorption isotherm curve. The validation of the predicted isotherm is achieved in the low surfactant concentration regime, namely, very dilute solution and absence of self-assembly of the surfactants to form reverse micelles. Beyond the predictive multiscale model, an intensive campaign of MD simulations enables the clarification of the adsorption mechanisms in light of the competitive contributions between the enthalpic and entropic interaction effects. Finally, the SMD simulations highlight how the NP curvature effects strongly alter the Markovian description of surfactant dynamics in a close proximity to the solid surface. In particular, the spherical shape of the considered NP promotes a differentiation of the free energy profiles at the solid–liquid interface, highlighting diverse sites of adsorption. The Article is organized as follows. The next section contains our key findings and their detailed analysis, specifically, the prediction of the adsorption isotherm and the NP curvature effects in the surfactant adsorption process. The discussion and conclusion are then reported, and finally, the model and the simulation procedure are explained in the Methods section.
Results and Discussion
Prediction of the Adsorption Isotherm
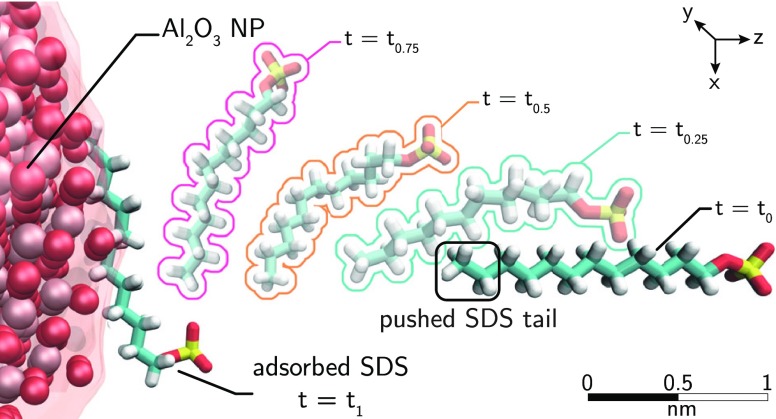
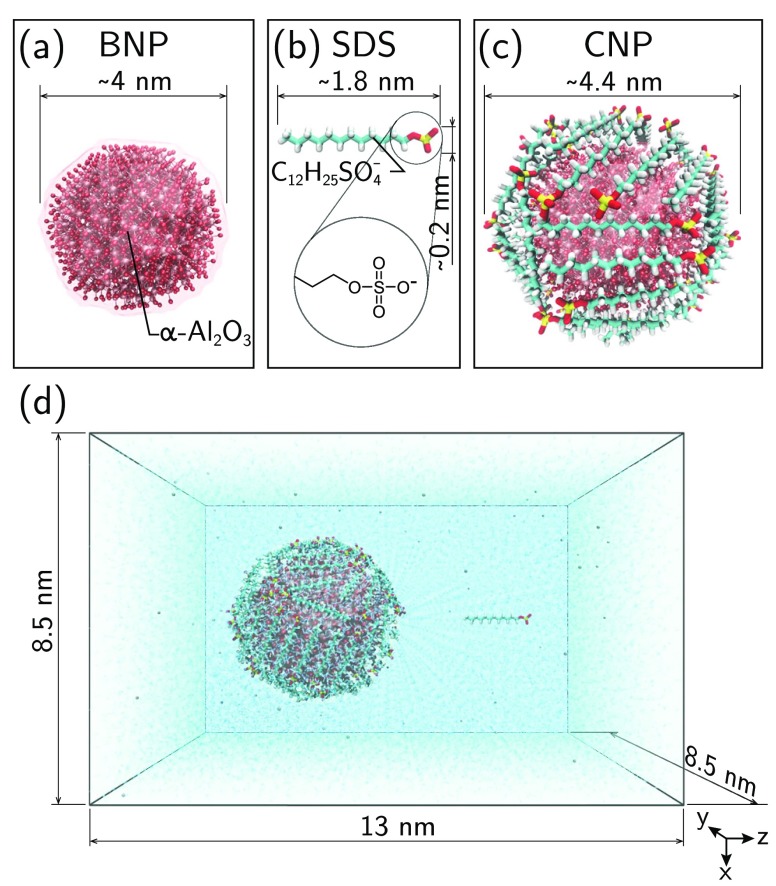
The adsorption isotherm of SDS molecules on alumina NPs suspended in aqueous solution is predicted by blending MD simulations with the Langmuir theory of adsorption. The first essential component of the proposed model is the calculation, via molecular dynamics, of the free energy of adsorption, ΔG, of a single SDS molecule onto an alumina NP. Because of the extremely high probability to be trapped in a local minimum during the adsorption process, and because of the rare event of escaping from that, the SMD method is adopted to sample the transition of the surfactant between the thermodynamics state of bulk solvation and the adsorption state at the solid–liquid interface. As shown in Figure 1, the enhanced sampling provided by the SMD simulations is realized by adding to the standard Hamiltonian a harmonic time-dependent potential promoting the pushing of the SDS molecule from the bulk toward the NP surface, along a reaction coordinate, ξ, in the z direction. Four study cases, corresponding to NP coatings with 60, 40, 10, and 0 SDS molecules, are investigated. Two extreme MD configurations, namely, one bare NP with 0 SDS (BNP) and one fully coated particle with 60 adsorbed molecules (CNP), are depicted in Figure 2a,c, respectively.
Figure 1.
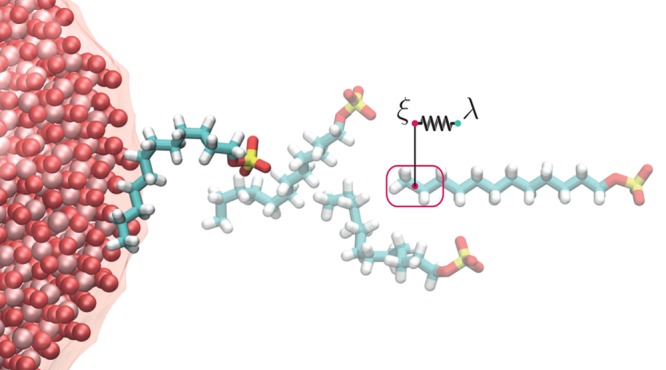
Space evolution of one steered molecular dynamics (SMD) simulation entailing the pushing of one sodium-dodecyl-sulfate (SDS) molecule onto a bare alumina surface (α-Al2O3). The harmonic potential used to sample the adsorption is applied to the final portion of the SDS tail (SDSt) identified in the red box. ξ and λ are the reaction and the evolution coordinates, respectively. Note that the surfactant samples different orientations during the steering MD.
Figure 2.
Molecular representation of (a) the bare α-Al2O3 nanoparticle (BNP), (b) sodium-dodecyl-sulfate (SDS), and (c) the coated α-Al2O3 nanoparticle (CNP) with 60 SDS molecules. (d) Example of the initial setup utilized in the SMD simulations: the SDS molecule in panel b is solvated in aqueous solution at 4 nm far from the center of mass of a single coated NP (CNP).
Figure 3a shows the mean work profiles, ⟨W⟩, and the Gibbs free energy change, ΔG, correlated to the change of the surfactant thermodynamics states. In particular, the total number of the steered trajectories is analyzed to calculate the work of pushing the SDS molecule from the bulk to the interface, while a correction of the Jarzynski22 equality is employed to compute the free energy landscapes as a function of the reaction coordinate ξ(r) and the NP coverage (see the Methods section for the technical details). The change of the free energy plotted in Figure 3a with colored lines clearly highlights a potential well when the reaction coordinate is roughly 2.2 nm. Such a minimum, spanning from 0 in the case of 40 adsorbed SDS molecules to −20 kJ/mol in the case of BNP, describes the local equilibrium condition corresponding to the surfactant adsorption state at the solid interface. However, slightly before the adsorption, when the SDS tail is less than 1 nm far from the NP surface, the ΔG profiles manifest remarkable free energy barriers preventing the adsorption process. Here, a combination of the hydration repulsion due to nanoconfined water at the interface32,33 and the surfactant excluded volume effects are recognized as the main sources of such potential barriers.34,35 Indeed, to confirm the effect of steric repulsion triggered by the steered SDS and adsorbed SDS overlap, Figure 3a shows the enhancement of the free energy barriers by increasing the number of SDS molecules already adsorbed on the NP. On the other hand, following the FELs, we notice that the process of adsorbing one further SDS molecule on the alumina NP is highly facilitated at low NP coverage, as proven by the deepening potential wells going from 60 to 0 SDS molecules in the NP coating.
Figure 3.
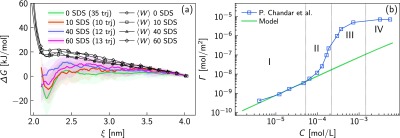
(a) Mean steering work, ⟨W⟩, and the free energy change of adsorption, ΔG, as a function of the reaction coordinate ξ. 60, 40, 10, and 0 SDS molecules coating the target NP are modeled to compute the free energy landscapes (FELs). The number of trajectories (trj) used for the FELs after the pruning is specified in the legend. (b) Comparison of the developed model (green solid line) and experimental results36 (blue square marks) for predicting the surface density of adsorbed surfactants, Γ, given a specific bulk concentration in aqueous solution (C). The model is implemented by coupling SMD simulations with the Langmuir theory of adsorption.
In order to fully derive the Langmuir adsorption isotherm in the low-concentration regime (region I in Figure 3b), we incorporate the minimum of the free energy profile related to the BNP in the equilibrium constant equation (eq 4). Then, the adsorption isotherm is extracted as shown in eq 5. Note that, increasing the SDS concentration, surfactant micelles may form, and competitive adsorption mechanisms between solvated surfactants, NPs, and micelles would imply a modeling environment substantially diverse from the implemented setup in the developed model. For this reason, we consider in our model the FEL of the BNP. Figure 3b reveals an excellent agreement of our modeling results with the experimental values in the low SDS concentration regime (region I).36
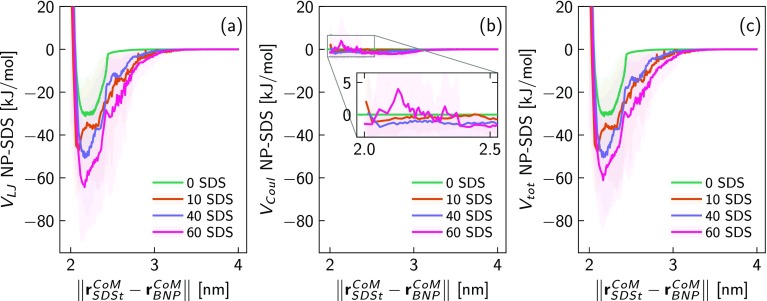
To have a thorough understanding of the competitive interaction mechanisms during the adsorption process, we analyze the electrostatic and dispersion potential between the steered SDS tail (SDSt) and the considered NPs. Figure 4a,b displays the resulting Lennard-Jones (VLJ) and Coulomb (VCoul) potential, respectively, as a function of the centers of mass (CoM) distance ∥rSDStCoM – rBNP∥. Because the alumina NP has been modeled in aqueous suspension close to the isoelectric point (IEP), the adsorption mechanisms between the steered SDS molecule and the considered NPs are mostly driven by the dispersion interactions (VLJ) as clear by comparing Figure 4a,b. Essentially, the VCoul weights less than 6% on the total enthalpic potential Vtot obtained as Vtot = VCoul + VLJ and plotted in Figure 4c. Interesting observations also arise detecting the adsorption process of the steered surfactant on the NP coated with 60 SDS molecules. In this case, the Coulomb interactions between SDSt and CNP (purple line in Figure 4b) promote the SDS adsorption when 2.3 < ∥rSDStCoM – rBNP∥ < 3 nm. On the other hand, the electrostatic repulsion between charged SDS heads predominates at short separation distance, namely, at 0.5 nm from the NP surface, as demonstrated in the zoom of Figure 4b where the purple pick is roughly 3.7 kJ/mol. Regardless of the specific interactions, Figure 4c indicates that the CNPs show overall stronger nonbonded interactions than the BNP with the steered surfactant, suggesting, at first glance, the most favorable configuration for the adhesion of SDS molecules. However, the previous analysis about the free energy change and nonbonded interactions (Figures 3a and 4c, respectively) sheds lights on the potential role played by the entropy in the surfactant adsorption phenomena. Recall that the free energy change corresponding to the transfer of a single molecule from the bulk solution to a solid interface consists of both enthalpic and entropic contributions, namely, ΔG = ΔH – TΔS. In particular, the change of the enthalpic component, ΔH, is related, in our system, to the variation of the nonbonded interactions along the steering trajectories, while the entropic contribution, ΔS, is mainly owed to the steric and excluded volume effects at the solid–liquid interface. As shown in Figure 4c, the enthalpic change is much more remarkable increasing the percentage of NP coverage by SDS molecules. However, we promptly notice from the FEL in Figure 3a that such deeper adsorption onto the coated NPs is strongly weakened. Therefore, the intensity of the potential wells in the ΔG profiles clearly unveils that the process of surfactant adsorption is more favorable in the case of BNP than CNP. The leading explanation is attributable to the steric repulsion of entropic nature promoted by modified water layer structure and excluded volume effects between the SDSt and coating surfactants.
Figure 4.
(a) Lennard-Jones (VLJ) and (b) Coulomb (VCoul) interaction potentials between the pushed SDS tail (SDSt) and the considered NPs following their center of mass (CoM) distance over the steering trajectories. (c) Total nonbonded interactions including VCoul and VLJ plotted in panels a and b, respectively. The shadow profiles in pnels a–c represent the standard deviations obtained after averaging the potentials over the total number of trajectories. The nonbonded potentials are investigated for NP coatings with 0, 10, 40, and 60 SDS molecules.
NP Curvature Effect on the Free Energy of Adsorption
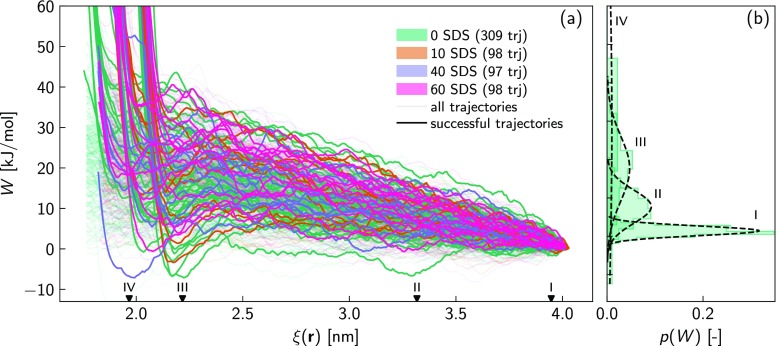
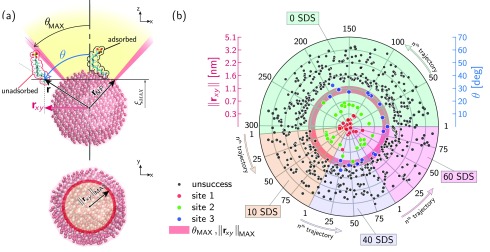
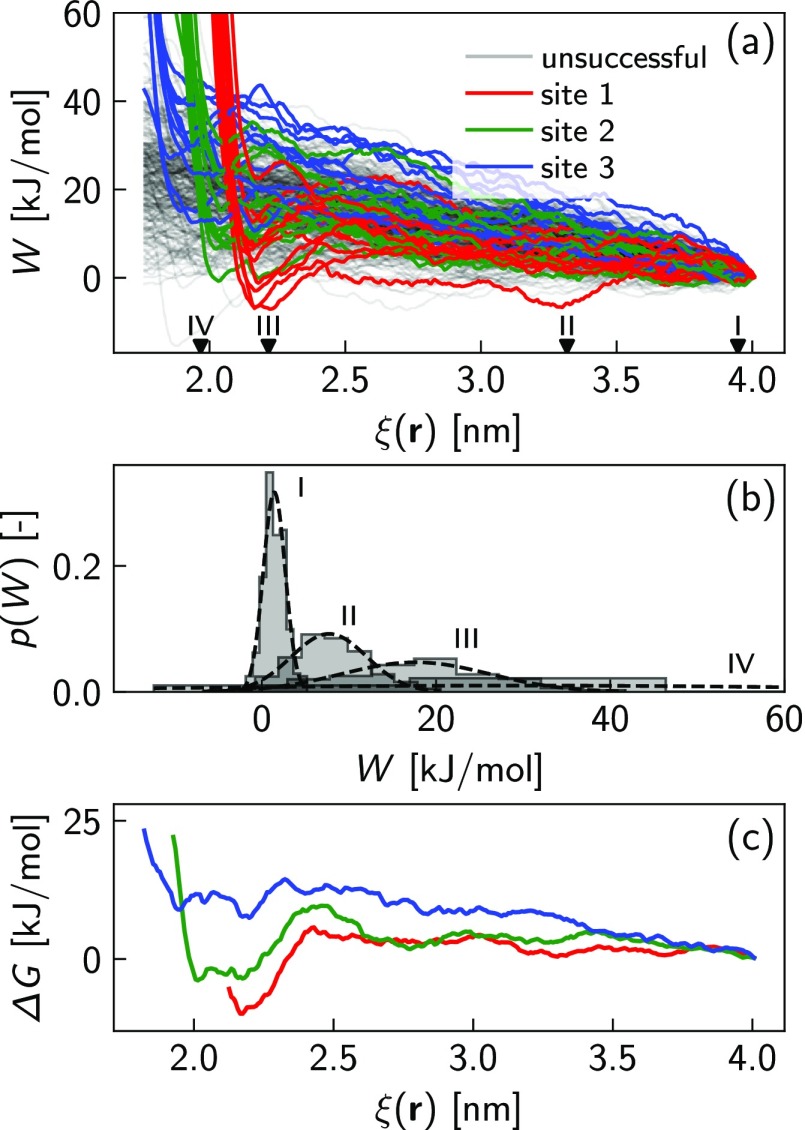
The effect of NP curvature is clarified by first exploring the work of transferring a single SDS molecule from the bulk solution to the NP interface. Figure 5a shows the resulting work profiles, W, as a function of the reaction coordinate ξ(r), including all the considered NP coatings. First, coupling the visualization of the trajectories with the computed transferring work, we observed that, over the total pushing trials, a very low percentage of the steered SDS molecules successfully reach the NP surface. More quantitatively, roughly 10% of the total sampling trajectories are classified as successful events and employed in the calculation of the FEL (see the Methods section for further details on the successful event criterion). Second, Figure 5a highlights, within the successful trajectories, a sharp increase of W when the steered SDS molecule is approaching the NP surface. In particular, regardless of the NP surface coverage and unlike the adsorption on a planar surface, three distinct sites of such enhanced work are detected, namely, at ξ = 1.8 nm, ξ = 2 nm, and ξ = 2.2 nm. With the previous observations in mind, we advance the hypothesis that, because of the NP curvature effect, there is a large probability that the adsorption phenomenon may not occur at a fixed reaction coordinate, but multiple sites of adsorption, corresponding to different ξ(r) and angles, may be feasible. The sketch in Figure 6a gives a clear picture of the possible adsorption scenario. Assuming a maximum reaction coordinate, ξMAX, as our target position to complete the adsorption pathway, then a spherical cap is defined by cutting the alumina NP with a plane passing in z = ξMAX, and θMAX is described as the solid angle subtended by the spherical cap. During the enhanced sampling carried out with SMD simulations, the steered surfactant molecule may either reach the NP surface within the spherical cap and solid angle θMAX (adsorbed SDS in Figure 6a) or touch the outer surface of θMAX, making the adsorption process highly unfavorable (unadsorbed SDS in Figure 6a). Consequentially, within the adsorption successful events, a splitting of the free energy landscape is expected in very close proximity to the NP surface.
Figure 5.
(a) Work profiles obtained by pushing, along the reaction coordinate ξ(r), a single SDS molecule from the bulk to the NP surface. The evolution of W is plotted for the total number of trials (trj) including all the considered NPs, coated with 0, 10, 40, and 60 SDS molecules. Note that the successful trajectories are highlighted with colored solid lines, leaving all the remaining ones transparent. (b) Probability distribution functions (p(W)) of applying the steering works, W, corresponding to ξ = 3.94 nm (case I), ξ = 3.31 nm (case II), ξ = 2.21 nm (case III), and ξ = 1.96 nm (case IV), marked in panel a with black triangles. Note that the p(W) functions only refer to the adsorption on BNP.
Figure 6.
(a) Frontal and top view of the possible final positions reached by the steered SDS molecule after the pushing process ending at z = ξmax. θ and r are the SDS final spherical coordinates, and rxy is the projection of r in the xy-plane. Defining θmax as the maximum solid angle generated by cutting the NP with the plane z = ξmax, adsorbed and unadsorbed SDS molecules are identified when θ < θmax and θ > θmax, respectively. (b) Polar plot of the steered SDS final positions including all processed trajectories. The total number of trajectories is grouped according to the NP coverage in colored circular sectors whose amplitude is related to the number of pushing trials. The radius of the polar plot indicates the final rxy and intrinsically θ of steered SDS. Black and colored points stand for the unadsorbed and adsorbed molecules onto the NP surface, respectively. Red, green, and blue points identify the three sites of adsorption corresponding to three specific final spherical coordinates of the steered SDS molecule.
In order to provide a quantitative validation of the previous adsorption scenario, more thorough investigations are carried out. We first explore the Markovian nature of the enhanced sampling adopted to study the surfactant adsorption at the solid interface. Figure 5b displays four probability distribution profiles of applying the work of steering a single surfactant onto the BNP in t = 35 ps, t = 350 ps, t = 900 ps, and t = 1025 ps, roughly corresponding to ξ = 3.94 nm, ξ = 3.31 nm, ξ = 2.21 nm, and ξ = 1.96 nm, respectively. These resulting probability distribution functions exhibit Gaussian-like behaviors for ξ > 2.21 nm (cases I, II, and III). However, the enhanced sampling starts to strongly deviate from a Markovian dynamics and hence from a Gaussian-like distribution when the steered SDS gets very close to the NP surface (case IV in Figure 5b). Such non-Markovian behavior mainly unveils that, approaching to the NP surface, the free energy profile is not exclusively identified, but diverse landscapes are realizable.
Figure 6b further remarks the diverse adsorption pathways by displaying the final position θ and rxy of the steered SDS molecule once the maximum reaction coordinate ξmax is reached. Specifically, for each single trajectory and NP surface coverage, r represents the final steered SDS coordinate, namely, rSDStCoM – rBNP. Then, the angular position, θ, and the projection of r on the xy-plane are calculated and plotted along the radius of the polar plot in Figure 6b. Here, the total number of trajectories is grouped in the colored circular sectors according to the NP coverage, and the amplitude of such circular sectors is related to the overall pushing trials. The unsuccessful cases in Figure 6b are identified with black circles, while the adsorption cases, selected according the condition θ < θmax, are highlighted with colored circles. It is interesting to note that only three main angular positions are attained by the steered molecule, roughly corresponding to θ = 10° (red circles), θ = 20° (green circles), and θ = 30° (blue circles). Such three angular positions are mostly correlated to three distinct sites of adsorption. Further details about the physical location of the adsorption sites are reported in the Supporting Information (SI).
In conclusion, the histogram analysis shown in Figure 5b and the polar plot in Figure 6b seriously suggest and prove that the NP curvature strongly promotes a distinction of the free energy landscapes while approaching the NP surface, with a consequent identification of specific adsorption sites. Preliminary results about the splitting of the FEL in the case of BNP are detailed and investigated in Figure 7. Here, the steering work, W, and the free energy profiles, ΔG, are computed for each single site of adsorption. As is clear from Figure 7c, as soon as the steered SDS molecule approaches the surface, namely, when its tail position is less than 2.5 nm from the CoM of the BNP, the unique free energy profile displayed in Figure 3a is branched off into three distinct landscapes. The most probable profile showing the largest free energy change, ΔG, corresponds to the first site of adsorption (red circles in Figures 6b). Then, the probability of adsorption decreases as the final angular position increases, namely, from the second (green circles in Figure 6b) to the third (blues circles in Figure 6b) adsorption sites. Further results of the FEL differentiation related to the different coatings are presented in the Supporting Information. However, in the case of CNPs, a massive amount of simulations should be carried out to have statistical validity for the results.
Figure 7.
(a) Steering work, W, to transfer one SDS molecule from the bulk solution to the BNP surface. (b) Probability distribution functions of applying specific steering works corresponding to the reaction coordinates, I, II, III, and IV highlighted with black triangular marks in panel a. (c) Free energy changes, ΔG, obtained by applying eq 2. Here, the FELs are computed by considering separately the trajectories of site 1 (red line), site 2 (green line), and site 3 (blue line) of adsorption.
Conclusion
In this Article, the proposed protocol of coupling the enhanced-sampling algorithm of SMD with the Langmuir theory shows a remarkable capacity of predicting the SDS adsorption isotherm, thereby providing some guidelines for a more rational design of NP suspensions. Specifically, the free energy of adsorption obtained with SMD simulations is utilized to compute the equilibrium constant; then, the Langmuir theory is employed to correlate the surfactant concentration with the adsorbed surfactants at the solid–liquid interface. The developed model is able to match the experimental data with an excellent agreement in the first concentration region, where the highly dilute solution condition prevents the self-assembly of the surfactants and the consequent SDS organization in micelles. A possible development of the model may include the investigation of the free energy landscapes for the micelle aggregation and then the use of an extended Langmuir theory, as the one proposed by Phamet al.,37 to reproduce the adsorption isotherm, extending the validity of such a multiscale approach.
Beyond the prediction of the surfactant isotherm, our results enlighten the prominent role of entropy in the surfactant adsorption mechanisms. Precisely, by tuning the initial SDS surface coverage on a bare NP, we observe competitive contributions of both enthalpic and entropic nature in the steered SDS–NP interactions. Although dispersion and Coulomb potentials strongly promote the adhesion between the bulk SDS molecules and the SDS-coated particle (CNP), the free energy profiles exhibit a more favorable adsorption in the case of a bare solid surface (BNP). Recalling that ΔG = ΔH – TΔS, such an outcome points out the presence of repulsive interactions, mainly of entropic nature, between steered SDS and CNP. In fact, excluded volume and steric effects rise by increasing the SDS density on the BNP coating, with a consequent reduction of the adsorption probability.
Finally, a differentiation of the adsorption free energy profile is detectable at the solid–liquid interface, where the hypothesis of a Markovian dynamics of the steering process fails. In particular, our results unveil that both the NP curvature effect and heterogeneities in the NP surface morphology facilitate the splitting of free energy landscapes corresponding to diverse possible sites of adsorption. Specifically, the physical and chemical NP morphology may be the reason for possible asymmetric dislocation of the sites of adsorption.
Ultimately, the proposed a modeling framework enables the translation of nanoscale interfacial phenomena into a continuum theory of adsorption, drawing the formulation of design rules to engineer NP aqueous suspensions suitable for a wide range of applications.
Methods
To predict the adsorption isotherm, we have designed a multiscale protocol able to couple molecular dynamics (MD) and classic Langmuir theory. Two distinct steps are then carried out: (i) evaluation of the Gibbs free energy of adsorption by implementing the enhanced sampling of steered molecular dynamics (SMD); and (ii) estimation of the equilibrium constant in the Langmuir isotherm by employing the Gibbs free energy of adsorption obtained in phase i. Steps i and ii are detailed in the following subsections.
Steered Molecular Dynamics
To explore the free energy landscape (FEL) with MD simulations, we first consider a molecular modeling setup including one α-alumina nanoparticle (NP) and a sodium-dodecyl-sulfate (SDS) molecule, as shown in Figure 1. The initial position of the SDS molecule is at ∼2 nm away from the NP surface, with the tail oriented toward the NP. Note that a configuration with the SDS head oriented toward the NP is also tested, and the results are reported in the Supporting Information. The alumina bare NP (BNP), Figure 2a, has a diameter of about 4 nm, and it is built following the same protocol employed by Cardellini et al.34 Beyond the BNP, we also investigate coated NPs (CNPs) with 60, 40, and 10 wrapping molecules as shown in Figure 2c. Thus, a total of four study cases are studied. We use the routine Packmol38 to arrange the SDS molecules around the target NP surface. The chosen box has a volume of 8.5 × 8.5 × 13 nm3 (Figure 2d), and the NP center of mass (CoM) is located at the origin of the Cartesian axis, while the steered SDS molecule is placed along the z direction. The box is filled with water molecules represented by the SPC/E model,39 and with Na+ ions to ensure a null overall electric charge. Periodic boundary conditions are finally applied in all box directions.
The nonbonded and bonded parameters of α-alumina are taken from the CLAYFF force field developed by Cygan et al.40 Note that, in order to compare our modeling framework with the experimental data and thus to simulate a system with a pH close to the isoelectric point (IEP), we leave the NP surface uncharged. The OPLS-AA force-field41 is instead adopted to describe the SDS molecules. All the van der Waals interactions are modeled using Lennard-Jones potential (LJ), implemented with a cutoff of 1.3 nm and a standard geometric-mean mixing rule for unlike atoms. The short-range electrostatic interactions are evaluated by summing all particle contributions within a cutoff of 1.3 nm, while for the remaining long-range interactions a particle-mesh Ewald (PME)42 summation is applied in Fourier space.
The SMD protocol first includes a total energy minimization of the described MD setup. The resulting state is then equilibrated in three different stages and two ensembles. Initially, we apply the canonical ensemble (NVT) for 500 ps using a Maxwell–Boltzmann speed distribution and the V-rescale thermostat43 with τT = 0.1 ps to reach the equilibrium temperature of 300 K. Then, the first isothermal–isobaric ensemble (NPT) at 1 bar is set by using the Berendsen barostat44 and a time constant of τp = 2 ps for further 500 ps. We conclude the equilibration with a second NPT for 100 ps, using the Nosé–Hoover thermostat45 (τT = 0.22 ps) and the Parrinello–Rahman barostat46 (τp = 2 ps). Once the desired thermodynamic conditions are reached, we leave the SDS molecules to freely self-assemble on the NP surface.
From the resulting configurations, we explore the free energy landscapes by imposing the following harmonic potential, h, to drive the evolution of our system toward the adsorption:
| 1 |
where ξ(r) is the reaction coordinate, λ is the evolution coordinate, and k is the spring constant. Usually, the evolution coordinate follows a linear motion law λ = λ0 + tv·uz, and the stiffness k is chosen high enough to neglect the difference between the two coordinates, but low enough to not introduce instability in the dynamics.47 Thus, after a preliminary study, explained in the Supporting Information, we set the pushing rate v = −2 × 10⁻³uz nm/ps, and the spring constant k = 4 × 10⁴ kJ mol–1 nm–2. According to the standard protocol of the SMD algorithm, we implement the enhanced sampling by generating at least 100 trajectories of the pushing process for both BNP and each CNP considered in this work.
In order to compute the steering work in all the trajectories, we integrate the gradient of h(r, λ) along the evolution coordinate, namely, W(λ) = ∫λ0λ ∂λh(r, λ) dλ. Then, within all possible steering trajectories, we remove the outliers with the interquartile range (IQR) method,48 and we apply a further pruning by exclusively considering the successful trajectories describing the adsorption. Specifically, the adsorption criterion consists in satisfying the condition ∥rSDSt – rBNPCoM∥ ≤ 2 at ξ(r) = 1.8 nm (see Figure 5 for the resulting steering works and Figure 6a for graphical details of successful adsorption). Next, from the successful trajectories, we derive the free energy profiles using Jarzisky’s equality:21,49,50
| 2 |
where ΔG(ξ) is the free energy profile along the reaction coordinate, β = 1/(kBT), with kB the Boltzmann constant and T the temperature. Note that the last equality in eq 2 is valid if and only if the dynamics of the system is Markovian.22 In other words, if the probability distribution functions of the steering works follow a Gaussian shape, then only the first two terms of the Maclaurin expansion of Jarzisky’s equality can be used to compute the FEL.51 In order to verify the Markovian condition, we compute the frequency histogram of the work at each time step (see Figure 5), and we measure the distance between the theoretical and empirical distribution with the Kolmogorov–Smirnov test (see Figure S3 in the Supporting Information). Our results show a good agreement with the Markovian dynamics up to 0.1 nm from the NP surface; thus, the cumulant expansion of Jarzisky’s equality (right-hand side of eq 2) is applied in the validity window for the estimation of the free energy profiles. All MD simulations are carried out with the open source code GROMACS 2018,52 by integrating Newton’s second law with the Leap-Frog53 algorithm and a time step of 1 fs.
Langmuir Adsorption Isotherm
To predict the adsorption isotherm, we adopt the ideal solution hypothesis with the SDS concentration below the critical micelle concentration (CMC). Under this condition, the adsorption phenomenon is described as an equilibrium condition between two thermodynamics states, namely State 0 and State 1:
| 3 |
where the equilibrium constant of the adsorption process explained in eq 3 is given by
| 4 |
ΔGads⊖ is the standard free energy of adsorption that in our case is assumed equal to the binding energy computed with the SMD, that is, ΔGads = min(ΔG(ξ)). Considering the free energy profiles shown in Figure 3, the most probable event of adsorption occurs in the case of BNP; hence, we hold ΔGads⊖ = min(ΔG(ξ)BNP). The definition of the equilibrium constant K in eq 4 allows the transition from the atomistic to the thermodynamic description of the phenomenon. In fact, we include K in the Langmuir theory of adsorption at the solid–liquid interface:
| 5 |
where Γ∞ is the maximum coverage of a bare alumina NP of 2 nm radius by a single layer of SDS molecules, C is the SDS concentration in mol L–1, and Ctot is the total molar concentration that can be assumed equal to the molar concentration of water at standard conditions (Ctot = 55.5 mol L–1).
Acknowledgments
The authors thank all members of the SMaLL group in Politecnico of Torino (https://www.polito.it/small) for the interesting discussions and useful suggestions. The authors acknowledge the support of the Italian National Project PRIN “Heat transfer and Thermal Energy Storage Enhancement by Foams and Nanoparticles” (2017F7KZWS) and the computational resources provided by HPC@POLITO (http://www.hpc.polito.it).
Supporting Information Available
The Supporting Information is available free of charge on the ACS Publications website at DOI: 10.1021/acscentsci.9b00773.
Additional details, calculations, and figures, including SMD setting tests, investigation of the Markovian nature of the simulations, identification of adsorption sites, and comparison of different FEL exploring strategies (PDF)
3D animation useful for the reader to understand the simulations and the results of this work (MP4)
Author Contributions
A.C. designed the setup and the computational framework. P.D.A. carried out the simulations and the postprocessing of the data. A.C. and P.D.A. worked on the analysis and interpretation of the results and wrote the manuscript. P.A. conceived the idea of coupling SMD with Langmuir theory and supervised the project. All the authors read and approve the final manuscript.
The authors declare no competing financial interest.
Supplementary Material
References
- Bigdeli M. B.; Fasano M.; Cardellini A.; Chiavazzo E.; Asinari P. A review on the heat and mass transfer phenomena in nanofluid coolants with special focus on automotive applications. Renewable Sustainable Energy Rev. 2016, 60, 1615–1633. 10.1016/j.rser.2016.03.027. [DOI] [Google Scholar]
- Cardellini A.; Fasano M.; Bigdeli M. B.; Chiavazzo E.; Asinari P. Thermal transport phenomena in nanoparticle suspensions. J. Phys.: Condens. Matter 2016, 28, 483003. 10.1088/0953-8984/28/48/483003. [DOI] [PubMed] [Google Scholar]
- Gong X.; Liu J.; Baskaran S.; Voise R. D.; Young J. S. Surfactant-assisted processing of carbon nanotube/polymer composites. Chem. Mater. 2000, 12, 1049–1052. 10.1021/cm9906396. [DOI] [Google Scholar]
- Katepalli H.; John V. T.; Bose A. The response of carbon black stabilized oil-in-water emulsions to the addition of surfactant solutions. Langmuir 2013, 29, 6790–6797. 10.1021/la400037c. [DOI] [PubMed] [Google Scholar]
- Zarzar L. D.; Sresht V.; Sletten E. M.; Kalow J. A.; Blankschtein D.; Swager T. M. Dynamically reconfigurable complex emulsions via tunable interfacial tensions. Nature 2015, 518, 520. 10.1038/nature14168. [DOI] [PMC free article] [PubMed] [Google Scholar]
- Hunter T. N.; Pugh R. J.; Franks G. V.; Jameson G. J. The role of particles in stabilising foams and emulsions. Adv. Colloid Interface Sci. 2008, 137, 57–81. 10.1016/j.cis.2007.07.007. [DOI] [PubMed] [Google Scholar]
- Qu C.; Wang J.; Yin H.; Lu G.; Li Z.; Feng Y. Condensate oil-tolerant foams stabilized by an anionic-sulfobetaine surfactant mixture. ACS Omega 2019, 4, 1738–1747. 10.1021/acsomega.8b02325. [DOI] [PMC free article] [PubMed] [Google Scholar]
- Sresht V.; Lewandowski E. P.; Blankschtein D.; Jusufi A. Combined molecular dynamics simulation-molecular-thermodynamic theory framework for predicting surface tensions. Langmuir 2017, 33, 8319–8329. 10.1021/acs.langmuir.7b01073. [DOI] [PubMed] [Google Scholar]
- Katepalli H.; Bose A. Response of surfactant stabilized oil-in-water emulsions to the addition of particles in an aqueous suspension. Langmuir 2014, 30, 12736–12742. 10.1021/la502291q. [DOI] [PubMed] [Google Scholar]
- Shih C.-J.; Lin S.; Strano M. S.; Blankschtein D. Understanding the stabilization of single-walled carbon nanotubes and graphene in ionic surfactant aqueous solutions: large-scale coarse-grained molecular dynamics simulation-assisted DLVO theory. J. Phys. Chem. C 2015, 119, 1047–1060. 10.1021/jp5093477. [DOI] [Google Scholar]
- Parent M. E.; Yang J.; Jeon Y.; Toney M. F.; Zhou Z.-L.; Henze D. Influence of surfactant structure on reverse micelle size and charge for nonpolar electrophoretic inks. Langmuir 2011, 27, 11845–11851. 10.1021/la202660d. [DOI] [PubMed] [Google Scholar]
- Khairul M.; Shah K.; Doroodchi E.; Azizian R.; Moghtaderi B. Effects of surfactant on stability and thermo-physical properties of metal oxide nanofluids. Int. J. Heat Mass Transfer 2016, 98, 778–787. 10.1016/j.ijheatmasstransfer.2016.03.079. [DOI] [Google Scholar]
- Wang H.; Zhao G.; Pumera M. Crucial role of surfactants in bubble-propelled microengines. J. Phys. Chem. C 2014, 118, 5268–5274. 10.1021/jp410003e. [DOI] [Google Scholar]
- Johnson R. A.; Nagarajan R. Modeling self-assembly of surfactants at solid/liquid interfaces. I. Hydrophobic surfaces. Colloids Surf., A 2000, 167, 31–46. 10.1016/S0927-7757(99)00481-1. [DOI] [Google Scholar]
- Johnson R.; Nagarajan R. Modeling self-assembly of surfactants at solid-liquid interfaces. II. Hydrophilic surfaces. Colloids Surf., A 2000, 167, 21–30. 10.1016/S0927-7757(99)00480-X. [DOI] [Google Scholar]
- Jimènez Àngeles F.; Firoozabadi A. Hydrophobic hydration and the effect of NaCl salt in the adsorption of hydrocarbons and surfactants on clathrate hydrates. ACS Cent. Sci. 2018, 4, 820–831. 10.1021/acscentsci.8b00076. [DOI] [PMC free article] [PubMed] [Google Scholar]
- Comer J.; Chen R.; Poblete H.; Vergara-Jaque A.; Riviere J. E. Predicting adsorption affinities of small molecules on carbon nanotubes using molecular dynamics simulation. ACS Nano 2015, 9, 11761–11774. 10.1021/acsnano.5b03592. [DOI] [PubMed] [Google Scholar]
- Barducci A.; Bussi G.; Parrinello M. Well-tempered metadynamics: a smoothly converging and tunable free-energy method. Phys. Rev. Lett. 2008, 100, 020603. 10.1103/PhysRevLett.100.020603. [DOI] [PubMed] [Google Scholar]
- Kästner J. Umbrella sampling. Wiley Interdisciplinary Reviews: Computational Molecular Science 2011, 1, 932–942. 10.1002/wcms.66. [DOI] [Google Scholar]
- Wang X.; Wang M.; Wei Q.; Yang X.; Yang Y.; Cui B.; Yang X.; Xu Z. Modulation of solid-water-peptide interfacial properties towards surface adsorption/bioresistance. Appl. Surf. Sci. 2019, 483, 373–382. 10.1016/j.apsusc.2019.03.317. [DOI] [Google Scholar]
- Jarzynski C. Nonequilibrium equality for free energy differences. Phys. Rev. Lett. 1997, 78, 2690. 10.1103/PhysRevLett.78.2690. [DOI] [Google Scholar]
- Park S.; Schulten K. Calculating potentials of mean force from steered molecular dynamics simulations. J. Chem. Phys. 2004, 120, 5946–5961. 10.1063/1.1651473. [DOI] [PubMed] [Google Scholar]
- Jimènez Àngeles F.; Khoshnood A.; Firoozabadi A. Molecular dynamics simulation of the adsorption and aggregation of ionic surfactants at liquid-solid interfaces. J. Phys. Chem. C 2017, 121, 25908–25920. 10.1021/acs.jpcc.7b09466. [DOI] [Google Scholar]
- Liu Z.; Yu J.-G.; O’Rear E. A.; Striolo A. Aqueous dual-tailed surfactants simulated on the alumina surface. J. Phys. Chem. B 2014, 118, 9695–9707. 10.1021/jp502916x. [DOI] [PubMed] [Google Scholar]
- Xu Z.; Yang X.; Yang Z. A molecular simulation probing of structure and interaction for supramolecular sodium dodecyl sulfate/single-wall carbon nanotube assemblies. Nano Lett. 2010, 10, 985–991. 10.1021/nl9041005. [DOI] [PubMed] [Google Scholar]
- Tummala N. R.; Shi L.; Striolo A. Molecular dynamics simulations of surfactants at the silica-water interface: Anionic vs nonionic headgroups. J. Colloid Interface Sci. 2011, 362, 135–143. 10.1016/j.jcis.2011.06.033. [DOI] [PubMed] [Google Scholar]
- Striolo A. Studying surfactants adsorption on heterogeneous substrates. Curr. Opin. Chem. Eng. 2019, 23, 115–122. 10.1016/j.coche.2019.03.009. [DOI] [Google Scholar]
- Lin S.; Shih C.-J.; Strano M. S.; Blankschtein D. Molecular insights into the surface morphology, layering structure, and aggregation kinetics of surfactant-stabilized graphene dispersions. J. Am. Chem. Soc. 2011, 133, 12810–12823. 10.1021/ja2048013. [DOI] [PubMed] [Google Scholar]
- Farrow M. R.; Camp P. J.; Dowding P. J.; Lewtas K. The effects of surface curvature on the adsorption of surfactants at the solid-liquid interface. Phys. Chem. Chem. Phys. 2013, 15, 11653–11660. 10.1039/c3cp50585e. [DOI] [PubMed] [Google Scholar]
- Jaishankar A.; Jusufi A.; Vreeland J. L.; Deighton S.; Pellettiere J.; Schilowitz A. M. Adsorption of stearic acid at the iron oxide/oil interface: theory, experiments, and modeling. Langmuir 2019, 35, 2033–2046. 10.1021/acs.langmuir.8b03132. [DOI] [PubMed] [Google Scholar]
- Lin S.; Blankschtein D. Role of the bile salt surfactant sodium cholate in enhancing the aqueous dispersion stability of single-walled carbon nanotubes: a molecular dynamics simulation study. J. Phys. Chem. B 2010, 114, 15616–15625. 10.1021/jp1076406. [DOI] [PubMed] [Google Scholar]
- Chiavazzo E.; Fasano M.; Asinari P.; Decuzzi P. Scaling behaviour for the water transport in nanoconfined geometries. Nat. Commun. 2014, 5, 3565. 10.1038/ncomms4565. [DOI] [PMC free article] [PubMed] [Google Scholar]
- Cardellini A.; Fasano M.; Chiavazzo E.; Asinari P. Interfacial water thickness at inorganic nanoconstructs and biomolecules: Size matters. Phys. Lett. A 2016, 380, 1735–1740. 10.1016/j.physleta.2016.03.015. [DOI] [Google Scholar]
- Cardellini A.; Alberghini M.; Rajan A. G.; Misra R. P.; Blankschtein D.; Asinari P. Multi-scale approach for modeling stability, aggregation, and network formation of nanoparticles suspended in aqueous solutions. Nanoscale 2019, 11, 3979–3992. 10.1039/C8NR08782B. [DOI] [PubMed] [Google Scholar]
- Israelachvili J. N.; Pashley R. M. Molecular layering of water at surfaces and origin of repulsive hydration forces. Nature 1983, 306, 249. 10.1038/306249a0. [DOI] [Google Scholar]
- Chandar P.; Somasundaran P.; Turro N. J. Fluorescence probe studies on the structure of the adsorbed layer of dodecyl sulfate at the alumina—water interface. J. Colloid Interface Sci. 1987, 117, 31–46. 10.1016/0021-9797(87)90165-2. [DOI] [Google Scholar]
- Pham T. D.; Kobayashi M.; Adachi Y. Adsorption of anionic surfactant sodium dodecyl sulfate onto alpha alumina with small surface area. Colloid Polym. Sci. 2015, 293, 217–227. 10.1007/s00396-014-3409-3. [DOI] [Google Scholar]
- Martínez L.; Andrade R.; Birgin E. G.; Martínez J. M. PACKMOL: a package for building initial configurations for molecular dynamics simulations. J. Comput. Chem. 2009, 30, 2157–2164. 10.1002/jcc.21224. [DOI] [PubMed] [Google Scholar]
- Berendsen H.; Grigera J.; Straatsma T. The missing term in effective pair potentials. J. Phys. Chem. 1987, 91, 6269–6271. 10.1021/j100308a038. [DOI] [Google Scholar]
- Cygan R. T.; Liang J.-J.; Kalinichev A. G. Molecular models of hydroxide, oxyhydroxide, and clay phases and the development of a general force field. J. Phys. Chem. B 2004, 108, 1255–1266. 10.1021/jp0363287. [DOI] [Google Scholar]
- Jorgensen W. L.; Maxwell D. S.; Tirado-Rives J. Development and testing of the OPLS all-atom force field on conformational energetics and properties of organic liquids. J. Am. Chem. Soc. 1996, 118, 11225–11236. 10.1021/ja9621760. [DOI] [Google Scholar]
- Darden T.; York D.; Pedersen L. Particle mesh Ewald: An N · log(N) method for Ewald sums in large systems. J. Chem. Phys. 1993, 98, 10089–10092. 10.1063/1.464397. [DOI] [Google Scholar]
- Bussi G.; Donadio D.; Parrinello M. Canonical sampling through velocity rescaling. J. Chem. Phys. 2007, 126, 014101. 10.1063/1.2408420. [DOI] [PubMed] [Google Scholar]
- Berendsen H. J.; Postma J. v.; van Gunsteren W. F.; DiNola A.; Haak J. Molecular dynamics with coupling to an external bath. J. Chem. Phys. 1984, 81, 3684–3690. 10.1063/1.448118. [DOI] [Google Scholar]
- Nosé S. A molecular dynamics method for simulations in the canonical ensemble. Mol. Phys. 1984, 52, 255–268. 10.1080/00268978400101201. [DOI] [Google Scholar]
- Parrinello M.; Rahman A. Polymorphic transitions in single crystals: A new molecular dynamics method. J. Appl. Phys. 1981, 52, 7182–7190. 10.1063/1.328693. [DOI] [Google Scholar]
- Park S.; Khalili-Araghi F.; Tajkhorshid E.; Schulten K. Free energy calculation from steered molecular dynamics simulations using Jarzynski’s equality. J. Chem. Phys. 2003, 119, 3559–3566. 10.1063/1.1590311. [DOI] [Google Scholar]
- Upton G.; Cook I.. Understanding statistics; Oxford University Press, 1996. [Google Scholar]
- Jarzynski C. Equilibrium free-energy differences from nonequilibrium measurements: A master-equation approach. Phys. Rev. E: Stat. Phys., Plasmas, Fluids, Relat. Interdiscip. Top. 1997, 56, 5018. 10.1103/PhysRevE.56.5018. [DOI] [Google Scholar]
- Crooks G. E. Nonequilibrium measurements of free energy differences for microscopically reversible Markovian systems. J. Stat. Phys. 1998, 90, 1481–1487. 10.1023/A:1023208217925. [DOI] [Google Scholar]
- Marcinkiewicz J. On a property of the Gauss law. Math. Z. 1939, 44, 612–618. 10.1007/BF01210677. [DOI] [Google Scholar]
- Abraham M. J.; Murtola T.; Schulz R.; Páll S.; Smith J. C.; Hess B.; Lindahl E. GROMACS: High performance molecular simulations through multi-level parallelism from laptops to supercomputers. SoftwareX 2015, 1, 19–25. 10.1016/j.softx.2015.06.001. [DOI] [Google Scholar]
- Hockney R.; Goel S.; Eastwood J. Quiet high-resolution computer models of a plasma. J. Comput. Phys. 1974, 14, 148–158. 10.1016/0021-9991(74)90010-2. [DOI] [Google Scholar]
Associated Data
This section collects any data citations, data availability statements, or supplementary materials included in this article.


