

Abstract
Our civilization relies on synthetic polymers for all aspects of modern life; yet, inefficient recycling and extremely slow environmental degradation of plastics are causing increasing concern about their widespread use. After a single use, many of these materials are currently treated as waste, underutilizing their inherent chemical and energy value. In this study, energy-rich polyethylene (PE) macromolecules are catalytically transformed into value-added products by hydrogenolysis using well-dispersed Pt nanoparticles (NPs) supported on SrTiO3 perovskite nanocuboids by atomic layer deposition. Pt/SrTiO3 completely converts PE (Mn = 8000–158,000 Da) or a single-use plastic bag (Mn = 31,000 Da) into high-quality liquid products, such as lubricants and waxes, characterized by a narrow distribution of oligomeric chains, at 170 psi H2 and 300 °C under solvent-free conditions for reaction durations up to 96 h. The binding of PE onto the catalyst surface contributes to the number averaged molecular weight (Mn) and the narrow polydispersity (Đ) of the final liquid product. Solid-state nuclear magnetic resonance of 13C-enriched PE adsorption studies and density functional theory computations suggest that PE adsorption is more favorable on Pt sites than that on the SrTiO3 support. Smaller Pt NPs with higher concentrations of undercoordinated Pt sites over-hydrogenolyzed PE to undesired light hydrocarbons.
Short abstract
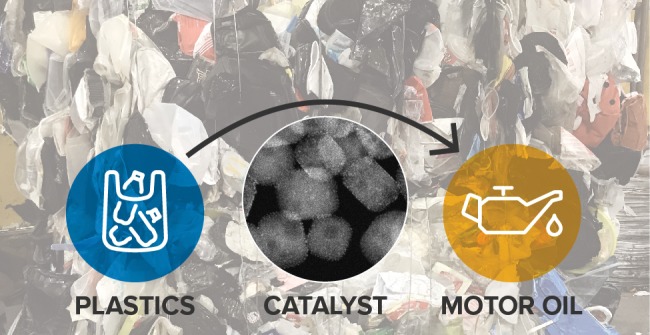
Single-use polyethylene is converted into value-added high-quality liquid products by a catalytic upcycling process using platinum nanoparticles supported on perovskites.
Introduction
Polyolefins are ubiquitous in single-use and short-term applications because their starting materials are abundant and inexpensive. In addition, researchers have learned to vary the chemical structure of the polymer chains (such as branching, molecular weight, and dispersity) through catalysis, and in such alter their physical properties. The single-use nature of plastics is essential in sterile packaging for foods, strong-but-inexpensive materials for transportation and storage, and safe and disposable components in medical devices, leading to their manufacture in tremendous quantities. Three hundred and eighty million tons (380 Mt) of plastics are created worldwide each year, which corresponds to roughly 7% of crude oil and natural gas produced. Moreover, the plastic market is currently increasing, and some analysts predict quadrupled production by 2050 (∼1100 to 1500 Mt per year).1−3 The downside, however, is the massive quantity of waste, pollution, and lost-value associated with single-use plastics. Over 75% of materials produced each year, 300 Mt, are discarded after a single use. Currently, most of this waste is either lost to landfills and the environment, or inefficiently incinerated in power plants to produce electricity, generating greenhouse gases (e.g., CO2) and toxic byproducts in the process. Glass and aluminum recycling are effective, whereas processing of plastic waste is limited by technical challenges, which include contamination from mixtures of polymers and additives as well as oxidative degradation during melt reprocessing. Thus, recycling provides lower-value materials with downgraded properties (downcycling).1−3 Polyolefin waste represents a vast and as-yet untapped resource for the production of chemicals and new materials. Efficient technologies for extracting this value from discarded polymers would be equivalent to recovering about 3.5 billion barrels of oil ($175B at $50/barrel) each year and could create entirely new industries. Consequently, selective catalytic processes that transform abundant plastic waste into value-added products (upcycling) could provide both scientific and technical advances. Today, existing conversions of waste polymers include catalytic pyrolysis, tandem alkane metathesis/transfer hydrogenation catalysis,4 and unselective hydrocracking, which converts raw materials into a lower value, broad distribution of smaller molecular fragments including light hydrocarbons and aromatics at temperatures higher than 500 °C.5−7
To date, there have been few reports of catalytic hydrogenolysis of PE.8−10 In particular, Dufaud and Basset showed that highly electrophilic Zr–H species synthesized by surface organometallic chemistry transformed short-chain (C20–C50) and high molecular weight (Mw = 125,000 Da) PE into fuels and short-chain hydrocarbons.8 Excessive hydrogenolysis, however, resulted in further transformations, producing light hydrocarbons such as methane, ethane, propane, and butane. Nakagawa, Tomishige, and co-workers deconstructed squalane (C30) by regioselective hydrogenolysis of internal C–C bonds into lighter hydrocarbons over Ru/CeO2 at 240 °C and 60 bar.9,10 While it was shown that the choice of support and particle size of Ru affected the hydrogenolysis of internal C–C bonds as compared to terminal C–C bonds of methyl branching, the catalytic features responsible for steering the pathways for hydrogenolysis were not clear.
Owing to the chemical resemblance of the feedstocks, some aspects of catalytic hydrogenolysis of polyolefins may be guided by the principles governing hydrogenolysis of n-alkanes. Catalytic hydrogenolysis of C2–C10 alkanes has been studied extensively by Iglesia and co-workers over supported Pt, Ir, Ru, and Rh NPs.11−15 The catalytic performance depends on a number of factors including operating conditions (temperature and H2 pressure), characteristics of supported metal particles (size and metal type), and degree of substitution at each carbon atom of n-alkanes.11−17 The kinetically relevant step in the hydrogenolysis reaction network is the cleavage of C–C bonds, after sequential quasi-equilibrated dehydrogenation steps that progressively weaken the C–C bonds and facilitate hydrogenolysis. The hydrogenolysis of n-alkanes is, however, prone to inhibition due to adsorbed hydrogen that limits the availability of active sites.11−17
Our approach for the transformation of high molecular weight PE requires the C−C bonds to undergo selective hydrogenolysis to produce a narrow molecular weight distribution of high-quality liquid hydrocarbons (Scheme 1). Such liquids, with a molecular weight ranging from 200 to 1000 Da, would be perfectly linear or have branching defined by the polyolefin feedstock and have advanced applications as lubricating oil18−21 or as intermediates (e.g., waxes) that can be further processed to produce ingredients for everyday necessities such as detergents and cosmetics.22,23 Waxes, for example, are intensively employed in coatings to enhance electrical insulation, thermal stability, surface nature, friction stability, and heat and chemical resistance, with an expected revenue of more than USD 370 million by the end of 2024.24 New catalytic hydrogenolysis that could affect the mean molecular weight and provide a narrow molecular distribution of products would allow access to such materials from polyolefin wastes, allowing this feedstock to be part of the circular economy.
Scheme 1. Hydrogenolysis of PE into High-Quality Liquid Products.

Benchmarks for activity and selectivity for hydrogenolysis of PE are not available prior to the work described below. On the basis of the earlier hydrogenolysis of n-alkanes studies mentioned above, this catalytic transformation is expected to take place at high temperatures and pressures. Thus, we speculate that harsh, condensed-phase conditions require exceptionally stable nanoparticle–support interactions that resist sintering/deactivation under reaction conditions.
Strontium titanate (SrTiO3) is an excellent support because its crystalline, highly ordered, and well-characterized surfaces assist the assembly of ordered NP arrays.25 SrTiO3 is an archetypical cubic perovskite (Pm3̅m) that is optically transparent and possesses a high band gap.26,27 The SrTiO3 used in the present study features single crystal nanocuboids having a sub-100 nm average size, with {100} facets and rounded stepped edges. It is synthesized under hydrothermal conditions,28,29 and the majority {100} surface termination has been determined to be the (√13 × √13)R33.7° TiO2 double-layer surface reconstruction.25,28−33 The SrTiO3 nanocuboids are used as a support for deposition of Pt NPs to form a Pt/SrTiO3 hydrogenolysis catalyst. Atomic layer deposition (ALD) is chosen for this process because it allows programmed control over key catalyst features that are potentially important to hydrogenolysis. ALD affords Pt NPs rather than films,34 and the size of the Pt NP depends on the ALD conditions and the interaction between the metal and the support.35,36 The close lattice-match between the cubic SrTiO3 and FCC Pt results in a cube-on-cube epitaxy for Pt NPs on the {100} facets of SrTiO3. The cube-on-cube epitaxy contributes to a large interfacial energy term for the Pt/SrTiO3 interface, which in turn stabilizes the Pt NPs.37−39
Here, we investigate (1) Pt/SrTiO3 as a hydrogenolysis catalyst for the upcycling of linear PE chains with negligible branching, (2) the adsorption of PE onto the catalyst surface by kinetics, solid-state nuclear magnetic resonance (ssNMR) spectroscopy and computational modeling, (3) the structure sensitivity of Pt NPs by varying the facet to edges/corners ratio and by DFT models, and (4) the catalytic competence of Pt/SrTiO3 compared to commercially available Pt/Al2O3 catalyst. It will be seen that the catalytic performance of Pt/SrTiO3 balances on preferential binding of longer hydrocarbon chains onto the Pt surface and the rate of hydrogenolysis at different catalytic sites (facet versus edge/corner). Thus, controlling the Pt edge to facet ratio is essential for suppressing over-hydrogenolysis.
Results and Discussion
Catalytic Hydrogenolysis of Polyethylene Using Pt/SrTiO3
The catalyst support, SrTiO3 nanocuboids with an average size of 65 ± 19 nm, was synthesized via hydrothermal methods (Figure S1).31,34 Five ALD cycles (5c) of Pt deposition using trimethyl(methylcyclopentadienyl)platinum(IV) precursor and ozone on SrTiO3 afforded highly dispersed Pt NPs with an average size of 2.0 ± 0.5 nm (Figure 1). A growth rate of 1.9 ± 0.2 wt %/cycle was established on the SrTiO3 surface as measured by inductively coupled plasma–optical emission spectroscopy (ICP–OES). The catalytic performance of 5c-Pt/SrTiO3 was first investigated using a PE with Mn = 8150 Da, Mw = 22,150 Da, and dispersity (Đ) of 2.7, employing a high-throughput batch reactor (see the Supporting Information for experimental details). Reaction parameters that were varied (Figure S2) include catalyst loading (from 1 mg to 50 mg), reaction temperature (100, 300, and 350 °C), hydrogen pressure (100, 170, 400, and 600 psi), and reaction duration (up to 96 h). Optimized experimental conditions based on conversion of PE into high-quality liquid products are 170 psi H2 at 300 °C under solvent-free conditions for 96 h, 10 mg of catalyst per 50 mg of PE. Solvent-free conditions have been chosen to eliminate competing adsorption and reaction of the hydrocarbon solvent with PE. Under these reaction conditions, 5c-Pt/SrTiO3 converts the starting PE into a high-quality lubricant-like product (Mn = 590 Da, Mw = 625 Da, and Đ = 1.1) at a yield of 42% (yield = mass of liquid hydrocarbons vs initial mass of PE; Table 1). 13C and 1H NMR analysis (Figures S3 and S4, respectively) of the liquid product (10 methyl branch/1000C) indicates the formation of linear products with a negligible amount of olefinic groups.
Figure 1.
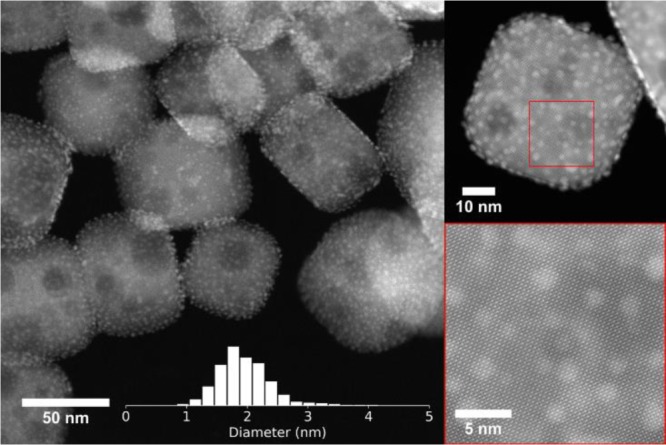
Electron micrographs of Pt NPs with an average size of 2.0 ± 0.5 nm, deposited by ALD on SrTiO3 nanocuboid supports via 5 ALD cycles. Inset: histogram for Pt particle size distribution on 5c-Pt/SrTiO3.
Table 1. Properties of PE Feedstocks and Hydrogenolyzed Products over Thermal Hydrogenolysis or Catalytic Hydrogenolysis Using 5c-Pt/SrTiO3a.
| entry | Mn, Da | Mw, Da | Đ | yield,b % |
|---|---|---|---|---|
| PE | 8150 | 22,150 | 2.7 | n/a |
| thermal | 5700 | 18,200 | 3.2 | n/a |
| 5c-Pt/SrTiO3 | 590 | 625 | 1.1 | 42 |
| PE | 15,400 | 17,200 | 1.1 | n/a |
| thermal | 17,300 | 19,550 | 1.1 | n/a |
| 5c-Pt/SrTiO3 | 660 | 700 | 1.1 | 68 |
| PE | 64,300 | 70,400 | 1.1 | n/a |
| thermalc | 30,050 | 54,900 | 1.8 | n/a |
| 5c-Pt/SrTiO3 | 800 | 920 | 1.2 | 91 |
| PE | 158,000 | 420,000 | 2.7 | n/a |
| thermalc | 16,800 | 136,250 | 8.1 | n/a |
| 5c-Pt/SrTiO3 | 820 | 960 | 1.2 | >99 |
| plastic bag | 33,000 | 115,150 | 3.5 | n/a |
| thermal | 38,800 | 114,800 | 3.0 | n/a |
| 5c-Pt/SrTiO3 | 990 | 1130 | 1.3 | 97 |
Reaction conditions: 170 psi H2, 300 °C, 96 h, and 50 mg PE, and 1.1 mg of Pt as 5c-Pt/SrTiO3 (11.1 wt % Pt loading).
Yield is defined as the mass of the weight of hydrocarbons recovered relative to the initial mass of PE. Owing to the high viscosity of the melt polymer, mass transfer effects cannot be ruled out completely.
Bimodal distribution.
The control experiment performed under thermal hydrogenolysis (no catalyst) in the presence of H2 shows a significant reduction in Mn (from 8150 to 5700 Da), whereas Mw exhibits a slight decrease (from 22,150 Da to 18,200 Da), resulting in a broadened distribution of polymeric material (Đ = 3.2). Note also that another control experiment of hydrogenolysis of PE using Pt-free SrTiO3 displays negligible changes in the molecular weight distribution compared to thermal hydrogenolysis, (Figure S5), indicating that the Pt is responsible for catalytic hydrogenolysis. The catalytic performance of 5c-Pt/SrTiO3 was further examined using PE with different molecular weights (Mn = 8000–160,000 Da and Mw = 18,000–420,000 Da). The 5c-Pt/SrTiO3 catalyst again completely converts PE into the same low-molecular weight product in high yield and narrow molecular weight distribution independently of the chain length of the starting PE (Table 1). Remarkably, the catalytic hydrogenolysis of PE is also effective starting with a single-use, commercial-grade plastic bag as a feedstock (Mn = 33,000 Da, Mw = 115,150 Da, and Đ = 3.5) to afford similar high-quality liquid products (Mn = 990 Da, Mw = 1130 Da, and Đ = 1.3) as obtained from research-grade HDPE (Table 1). These results suggest that the additives present in the plastic bag may not affect the catalyst.40
Polyethylene–Catalyst Interaction
Several sets of experiments were performed in order to gain insight into a possible relationship between selective conversion and the interactions between polymer and the catalyst surface, including (i) monitoring the change in molecular weight and distribution versus time, to (ii) measuring the conformation of adsorbed PE, and (iii) determining the strength of adsorption of alkanes on relevant crystalline facets.
Hydrogenolysis of PE in a Parr batch reactor at 170 psi H2 and 300 °C affords hydrogenolyzed products with progressively shifted Mn to lower molecular weights over a series of reaction times (Figure 2). This progressive shift indicates that all of the molecules in the sample are hydrogenolyzed to some extent. Conversion of the starting polymer Mn of 8,150 to 625 Da corresponds to an average of 12 C–C bond cleavage steps per chain by the end of the reaction. Importantly, the decreasing Đ also suggests that the PE chains with the highest molecular weights are more susceptible to hydrogenolysis than molecules with lower molecular weights. Carr et al. have shown that the highest molecular weight fraction of PE and other polymers preferentially adsorb to alkali halide crystals and that this adsorption could be used to preferentially extract the highest molecular weight fraction of a given sample.41 A similar preferential adsorption of longer chains onto 5c-Pt/SrTiO3 is consistent with the low dispersity of hydrocarbon chains, whereas preferential adsorption of lighter molecules to the catalyst would result in increased Đ with time as lighter species are hydrogenolyzed into even shorter chains (see Figure S6). Given that sequential hydrogenolysis takes place and leads to the selective formation of narrower high-quality liquid products, it is reasonable to assume that PE adsorption on the catalyst surface plays a key role in the overall performance. Examination of the interactions between the hydrocarbon chain and the surface was then carried out by 13C magic-angle-spinning (MAS) ssNMR spectroscopy.
Figure 2.
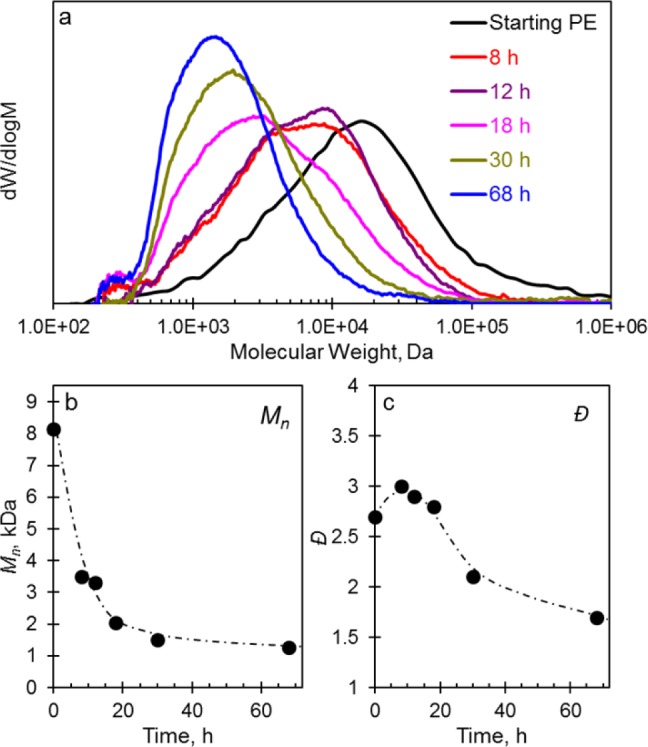
(a) Weight distribution, (b) Mn, and (c) Đ plots of the hydrogenolyzed products with respect to time over 5c-Pt/SrTiO3. Reaction conditions: 170 psi H2, 300 °C, 3 g of PE, and 8 mg of Pt as 5c-Pt/SrTiO3.
A monolayer of 13C-enriched PE (see Supporting Information) was loaded onto the 5c-Pt/SrTiO3 catalyst and the Pt-free SrTiO3 support. As shown by Ando et al.,42,4313C MAS ssNMR spectroscopy is able to distinguish mobile (δ = 30 ppm), anti (δ = 32.9 ppm), and gauche (δ = 27.5 ppm) PE adsorbed on surfaces, and thus both the rigidity and linearity of PE onto the catalyst surface can be established. The 13C MAS spectra are quantitative, while the 1H → 13C cross-polarization (CP) MAS spectra highlight the signals from the most rigid polymer molecules, presumably those that are closest to the surface. As can be seen in Figure 3a, no signal from gauche conformations can be detected for polymer adsorbed on the SrTiO3 nanocuboid materials, despite the presence of a strong resonance belonging to the antipolymer conformer, indicative of a rigid conformation. This is in stark contrast with polymers adsorbed on silica gel for which clear evidence of nonlinearity is present.43 On the other hand, the polymer mobility is dramatically enhanced when the surface contains Pt NPs (Figure 3a). This suggests that interactions with the metal NPs prevent the polymer from interacting as strongly with the SrTiO3 surface. Thus, the observed catalytic behavior arises from the adsorption of the long chain hydrocarbon onto the active cleavage metal NP sites.
Figure 3.
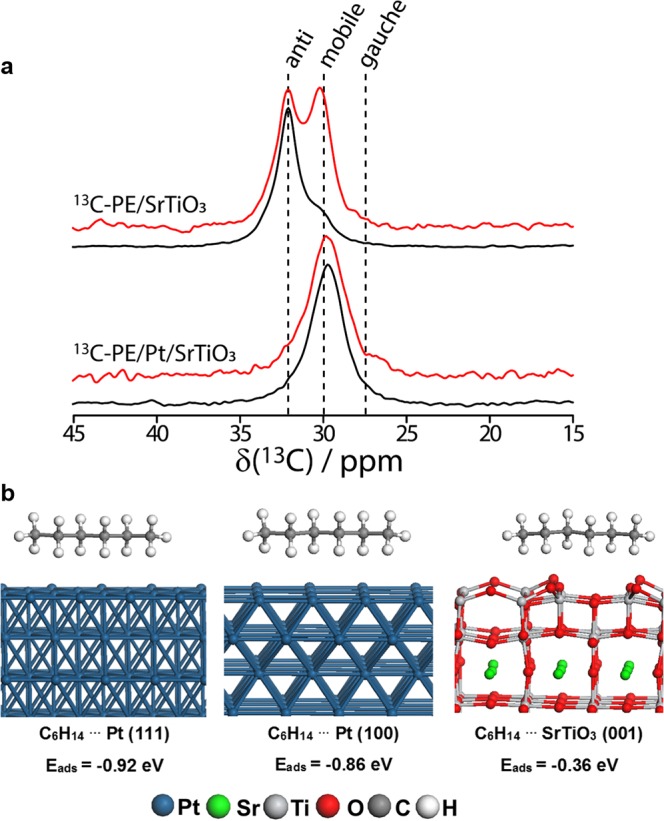
(a) 13C MAS (red) and CPMAS (black) spectra of 13C-enriched PE adsorbed on the SrTiO3 support (top), and Pt/SrTiO3 catalyst (bottom). (b) Side view of the optimized structures of n-hexane on Pt (111), Pt (100), and TiO2 double-layer terminated SrTiO3 (001) surface models.
Theoretical models support the idea that hydrocarbon molecules interact more strongly with the Pt NPs than with the SrTiO3. DFT calculations were performed using the VASP code44−47 based on the SCAN-rVV10 functional and the projector augmented-wave method (see Supporting Information). The adsorption energies were calculated for the interaction of model n-alkanes (CnH2n+2, n = 4, 6, 8) onto Pt(100) and Pt(111) surface models as representations of the Pt NPs, as well as the TiO2 double-layer terminated SrTiO3(001)48,49 model as a representation of SrTiO3 support. The n-alkanes prefer to adsorb on Pt surfaces, aligning their C–C bonds with all-anti conformation parallel to the metal surface (Figure 3b and Figure S7) as suggested by previous reflection-adsorption infrared spectroscopic studies50−52 and ssNMR (vide supra). Despite the fact that adsorption onto Pt NPs is favored, the particles introduce irregularities onto the surface, which disfavor all-anti conformers (Figure 1), particularly in the space between the particles where interactions with the SrTiO3 are limited and the polymer must bridge between particles. Such an interaction is responsible for the increased mobility of the surface-bound polymer. In addition, the total adsorption energy of n-alkanes increases with the number of carbon atoms (Figure S8). The adsorption of n-alkanes on the Pt(111) surface (−0.15 eV per CH2 group) is slightly more favorable compared to the Pt(100) surface (−0.14 eV per CH2). The adsorption of n-alkanes on the SrTiO3 support is found to occur through the oxygen on the TiO2 double-layer terminated SrTiO3 surface, with a lower average binding energy of only about −0.06 eV per carbon atom (Figure S9). The predicted linearity in the binding energy of the n-alkanes with respect to the number of carbon atoms (Figure S8) suggests that the trends observed here can be extended to larger alkanes. Furthermore, these results support the earlier hypothesis that the stronger binding of higher molecular weight polymer molecules helps in directing the decrease of the Đ index.
Catalyst Structure Sensitivity of Polyethylene Hydrogenolysis
The structure sensitivity of hydrogenolysis of short-chain n-alkanes has been well established;15,53 however, to the best of our knowledge, no catalytic studies have been conducted on the effect of structure sensitivity on polyolefin hydrogenolysis. Here, Pt NPs of different metal loading, size, and edge to facet ratio were synthesized by varying the number of ALD cycles.54−56 For 1 cycle (1c-), 5 cycles (5c-), and 10 cycles (10c-) Pt/SrTiO3, the loading of Pt and the volume of the Pt NPs increase linearly with the number of ALD cycles (Figure S10 and Table S2). Average particle sizes of Pt NPs on 1c-Pt/SrTiO3, 5c-Pt/SrTiO3, and 10c-Pt/SrTiO3 are found to be 1.2 ± 0.2 nm, 2.3 ± 0.7 nm, and 2.9 ± 1.1 nm, respectively (Figure S11). The majority of Pt particles on the SrTiO3(100) facet have a cube-on-cube epitaxy with a truncation of 61% relative to the free Wulff shape of a Pt NPs.54 The proportion of undercoordinated edge sites to the total Pt surface area increases as the diameter of the Pt NPs decreases (Table S2). Similarly to previous observations, the spacing of the Pt NPs, measured as the center-to-center distance, increased with the number of ALD cycles.34
Hydrogenolysis of PE performed at 300 °C and 170 psi over 1c-, 5c-, and 10c-Pt/SrTiO3 catalysts shows that the Pt particle size and coordination of surface atoms affect the molecular weight and dispersity of products. Catalytic experiments were performed under an equal basis of Pt surface area in the reactor (2000 cm2 Pt) (Table 2) for 96 h. Catalyst 1c-Pt/SrTiO3 completely transforms PE into gaseous hydrocarbons (C1–C8), while 5c-Pt/SrTiO3 and 10c-Pt/SrTiO3 convert PE into a similar high-quality liquid product (Mn ≈ 675 Da and Đ = 1.1) at yields of 42% and 95%, respectively. In addition, experiments performed for 24 h under an equal basis of the Pt amount in the reactor (1.0 mg Pt) show that the lowest molecular weight of hydrogenolyzed products is achieved with 1c-Pt/SrTiO3. 1c-Pt/SrTiO3 reduced the Mn from 8150 Da to 1250 Da in 24 h, while 5c and 10c reduced the Mn to 2150 Da and 3400 Da, respectively. It should be noted that the molecular weight of the hydrogenolyzed products at 24 h (Mn = 1250 Da, ∼C90) is not low enough for mass losses into the headspace to be a significant contributor to yield. Furthermore, for extended time (96 h), 1c-Pt/SrTiO3 completely converts the starting PE into gaseous products while lubricant-like hydrocarbons (Mn ≈ 800 Da and Đ = 1.1) are obtained over 5c-Pt/SrTiO3 and 10c-Pt/SrTiO3. The results show that smaller Pt NPs with higher concentrations of undercoordinated Pt sites promote over-hydrogenolysis of PE to undesired light hydrocarbons. This, however, can be prevented by controlling the Pt properties such as size and edge to facet ratio while obtaining a high-quality liquid product with relatively narrow polydispersity at high yields.
Table 2. Catalytic Activity Comparison of 1c, 5c, and 10c-Pt/SrTiO3 under Equal Surface Area (2000 cm2) or Mass (1 mg) of Pt in the Reactora.
| catalyst | Pt weight loadingb, % | average Pt diameterc, nm | Pt edge/facet ratiod, nm/nm2 | amount of Pt, mg | surface area of Pte, cm2 | time, h | Mn, Daf | Đf | yieldg, % |
|---|---|---|---|---|---|---|---|---|---|
| thermal | − | − | − | − | − | 24 | 5600 | 4.2 | h |
| 96 | 5700 | 3.2 | >99 | ||||||
| Equal Surface Area of Pt (2000 cm2) | |||||||||
| 1c-Pt/SrTiO3 | 1.7 | 1.2 | 0.27 | 0.6 | 2000 | 96 | over-hydrogenolysis | ||
| 5c-Pt/SrTiO3 | 11.1 | 2.3 | 0.14 | 1.1 | 96 | 600 | 1.1 | 42 | |
| 10c-Pt/SrTiO3 | 18.8 | 2.9 | 0.11 | 1.4 | 96 | 750 | 1.1 | 95 | |
| Equal Weight of Pt (1 mg) | |||||||||
| 1c-Pt/SrTiO3 | 1.7 | 1.2 | 0.27 | 1.0 | 3270 | 24 | 1250 | 4.7 | 91 |
| 96 | over-hydrogenolysis | ||||||||
| 5c-Pt/SrTiO3 | 11.1 | 2.3 | 0.14 | 2000 | 24 | 2150 | 4.7 | 97 | |
| 96 | 600 | 1.1 | 42 | ||||||
| 10c-Pt/SrTiO3 | 18.8 | 2.9 | 0.11 | 1480 | 24 | 3400 | 3.4 | >99 | |
| 96 | 800 | 1.2 | >99 | ||||||
Reaction conditions: 170 psi H2, 300 °C, 24 or 96 h, and 50 mg PE (Mn = 8150 Da, Đ = 2.7).
Determined by ICP-OES.
Determined by TEM particle size analysis.
Pt NPs approximated as Winterbottom constructions, with γPt{111}:γPt{100} = 0.84, Pt(100)||SrTiO3(100) at 61% truncation.
Surface area calculated from Pt loading and average particle size, assuming the minimum energy Winterbottom construction.
Determined by GPC.
Yield is defined as the mass of the weight of liquid hydrocarbons recovered relative to the initial mass of PE.
Not measured.
Under the experimental reaction conditions (T = 300 °C; PH2 = 170–300 psi), the presence of excess H2 could inhibit the adsorption of PE and limit the availability of active sites for C–C bond hydrogenolysis. The dissociative adsorption of H2 to form surface −OH moieties on the SrTiO3 surface is endergonic (SrTiO3 + H2(gas) → 2H···SrTiO3, ΔE = −0.09 eV; ΔG = 0.48 eV at T = 300 °C and PH2 = 300 psi) suggesting that the SrTiO3 surface is free of adsorbed H atoms under experimental conditions. On the other hand, the adsorption of H atoms on Pt surface sites was found to be exergonic under our experimental reaction conditions (Figure S12). The calculations predicted that the average binding energy for a monolayer (ML) coverage of H calculated with reference to the energy of gas phase H2 is −0.79 eV (ΔG (300 °C) = −0.50 eV) and −0.38 eV (ΔG (300 °C) = −0.10 eV) for the Pt(100) and Pt(111) surfaces, respectively. Removing a single H atom from the 1 ML H-covered surface was found to be endergonic by 0.51 eV on the Pt(100) surface and is slightly exergonic by −0.02 eV on the Pt(111) surface. These results suggest that the (100) surface facets are fully covered by H under reaction conditions, whereas some sites are available for the adsorption and cleavage of C–C bonds of the hydrocarbon on the close-packed Pt(111) sites. On the fully hydrogenated Pt(100) and Pt(111) surface facets, the hydrocarbon adsorption strength per site (and carbon atom) is found to be only slightly larger (−0.09 and −0.10 eV, respectively, Figure S12) than on the SrTiO3 support. However, calculations suggested that a large fraction of the surface hydrogen atoms can be displaced from the Pt(111) facet under reaction conditions and the hydrocarbon chain is able to strongly interact with this facet (Eads = −0.22 eV per CH2, Figure S12c–d) and can facilitate dehydrogenation and C–C cleavage reactions at nearby sites. This finding is in agreement with a recent literature report that H* saturates Pt at lower coverages, both on edge and terrace sites, and only a few H vacancies are necessary to activate the *HC–CH* bond on Pt compared to other metals such as Ru, Rh, and Ir.16
Comparison of Pt/SrTiO3 versus Pt/Al2O3
Commercially available Pt/Al2O3 (1 wt %, Sigma-Aldrich) provides remarkable contrast to the behavior of 5c-Pt/SrTiO3. The comparison of catalytic activity between 5c-Pt/SrTiO3 and Pt/Al2O3 at the equal basis of Pt amount in the reactor (Table S3) shows that the Mn of the hydrogenolyzed products is similar over both samples (∼1950 Da) after 18 h. Both Mw and Đ, however, highlight the effect of Pt/SrTiO3 on catalytic performance. Mw of the hydrogenolyzed product over 5c-Pt/SrTiO3 (5800 Da) is significantly lower than that over Pt/Al2O3 (10,750 Da). Negligible variation of Đ of the hydrogenolyzed products from 5c-Pt/SrTiO3 is detected with respect to the starting PE. In contrast, the Đ of the products over Pt/Al2O3 increases to ∼6. The broadening of the hydrogenolyzed product distribution from the Pt/Al2O3 catalyst is also observed by pyrolysis gas chromatography–mass (GC-MS) spectrometry analysis (Figures S13–S15). In addition, the quantification of the gases in the headspace of the reactor by GC (Figure S16) revealed that the formation of light hydrocarbons (saturated C1–C8 and cyclic C5–C6 alkanes) is significantly suppressed over 5c-Pt/SrTiO3, when compared to Pt/Al2O3. Note that thermal degradation leads to the formation of C1–C8 gases, even in the absence of any catalyst (Table S3), due to the thermal degradation of the PE. After the amount of light hydrocarbons formed from the thermal degradation (0.65 mmol, 3 g of PE at 300 °C, 170 psi H2 for 18 h) was accounted for, the total number of light hydrocarbons produced over Pt/Al2O3 (1.69 mmol) is more than 3× that produced over 5c-Pt/SrTiO3 (0.52 mmol). This difference constitutes an important advantage since relatively narrow dispersity, high-quality liquid products are obtained at high yields without producing any substantial amounts of light hydrocarbons.
Comparison of hydrogenolysis performance under equal area × time (defined as surface area of Pt multiplied by reaction time) for 1c-Pt/SrTiO3 and Pt/Al2O3 (1.2 nm, Figures S11 and S17, respectively) reveals unique aspects of the SrTiO3 support. While the Mn of the hydrogenolyzed products is similar (Mn ≈ 1500 Da) (Figure S18), the Đ index of the product from 1c-Pt/SrTiO3 (Đ = 2.4) is significantly lower than for Pt/Al2O3 (Đ = 6.6), indicating for the latter that part of the starting material is not converted to HQL (Figure S18). In addition, the extent of over-hydrogenolysis for Pt/Al2O3 is greater compared to the entire Pt/SrTiO3 series (Figure S19), suggesting that Al2O3 catalyst promotes the formation of light hydrocarbons.
TEM images of Pt NPs on γ-Al2O3 (Figure S17 and Table S4) reveal that the average particle size is 1.2 ± 0.4 nm and after 18 h of PE hydrogenolysis is 1.6 ± 0.4 nm. The average Pt particle diameter for 5c-Pt/SrTiO3 increased from 2.0 ± 0.5 nm to 2.1 ± 0.5 nm after 18 h (Figure 1 and Figure S20). The negligible change in particle size of Pt in 5c-Pt/SrTiO3 suggests that the stabilization of Pt by SrTiO3 relative to γ-Al2O3 is effective in minimizing the effect of sintering under reaction conditions. Note that platinum has a weaker interfacial interaction with γ-Al2O3 than with SrTiO3 and the minimum energy Winterbottom shape of Pt on γ-Al2O3 is closer to that of a free Wulff particle, facilitating the sintering.39
5c-Pt/SrTiO3 is shown to be recyclable for hydrogenolysis of PE, albeit with reduced catalytic performance (Table S5). Although no changes in average particle size of Pt NPs were noted (vide supra), the reduced catalytic performance is attributed to oxidation of Pt NPs during physical recovery of the catalyst from the reaction medium.
Conclusions
Catalytic processes that convert waste PE into value-added products are key to mitigating adverse impacts of the plastic pollution and developing a circular economy. An effective catalyst for chemical upcycling of PE must be able to break carbon–carbon bonds of longer chains in preference to shorter chains. In this work, Pt NPs supported on SrTiO3 nanocuboids by ALD completely converted PE samples, ranging from Mn of 8000–158,000 Da and Mw of 17,200–420,000 Da, into narrowly distributed high-quality liquid products, such as motor oil and waxes. The hydrogenolysis occurred at 300 °C and 170 psi of H2 under solvent-free conditions, yielding negligible amounts of light hydrocarbons, in marked contrast to the benchmark hydrogenolysis catalyst Pt/Al2O3.
Several features of Pt/SrTiO3 contribute to its performance in selective PE hydrogenolysis. First, the selective hydrogenolysis is attributed to more favorable adsorption of PE on Pt sites than on the SrTiO3 support as evidenced by ssNMR and DFT and preferential binding of high molecular weight PE on the Pt NPs surface. Second, the electronic and geometric properties of Pt NPs on SrTiO3 play a key role in producing high-quality liquid products from a single-use PE stream and suppressing the undesired over-hydrogenolysis to light hydrocarbons. Specifically, Pt edge sites are found to be highly reactive for hydrogenolysis of PE compared to Pt facets. Cube-on-cube epitaxy for Pt NPs on the {100} facets of SrTiO3 provides significant nanoparticle–support interactions that minimized sintering under the solvent-free, harsh reaction conditions.
The substantially superior performance of 5c-Pt/SrTiO3 compared to commercial Pt/Al2O3 in selective PE hydrogenolysis suggests that there may be some special features of the former material that could guide future catalyst development. In particular, evenly dispersed and similarly sized Pt NPs on Pt/SrTiO3 should be noted. These features would also affect the distances between sites where carbon–carbon bond cleavage occurs. Because the macromolecules are long and could adsorb to multiple NPs on a face of the SrTiO3 nanocuboid support, the ordering and distances may also exert an influence over selective formation of specific chain lengths. While the organization of Pt particles in 5c-Pt/SrTiO3 is insufficient to test this idea, the next phase of this project is focused on synthesis of ordered and organized catalytic materials. Such materials, with well-characterized distances between sites, may ultimately provide the fundamental design principles needed for effective upcycling catalysis.
Materials and Methods
SrTiO3 nanocuboids were synthesized hydrothermally according to literature procedures.31 Platinum NPs were deposited onto the SrTiO3 using ALD in a viscous flow reactor.34 ALD precursor (MeCp)PtMe3 (Strem Chemicals, 99%) and 70% output O3 (Pacific Ozone L11 Ozone Generator, ultrahigh purity 20 Torr O2 source) were used. The ALD deposition temperature was set to 200 °C. A pretreatment of O3 exposure at 200 °C for 2 h was used for all ALD-prepared Pt samples. The resulting samples were characterized by TEM and ICP-OES. ssNMR experiments were performed using 13C-labeled PE adsorbed onto the surface of the samples. DFT calculations were performed using the Vienna ab initio simulation package (VASP). A Parr reactor and a high-throughput screening pressure reactor (SPR; Unchained Labs) at the Argonne National Laboratory’s High-Throughput Research Laboratory were used for catalytic activity experiments. Activity experiments were performed under solvent-free conditions at 170 psi and 300 °C, unless otherwise noted. Samples were analyzed by high temperature GPC to obtain molecular weight after hydrogenolysis. The accuracy of the GPC measurements was verified by calibration at low-molecular weights (Table S1; 400–1000 Da). For detailed experimental information, see the Supporting Information.
Acknowledgments
The authors acknowledge Dr. D. M. Kaphan and Dr. J. Wen for helpful discussions. This work made use of the Center for Nanoscale Materials, an Office of Science user facility, supported by the U.S. Department of Energy, Office of Science, Office of Basic Energy Sciences, under Contract No. DE-AC02-06CH11357. This work also made use of (i) the EPIC and BioCryo facilities of Northwestern University’s NUANCE Center, which has received support from the Soft and Hybrid Nanotechnology Experimental (SHyNE) Resource (NSF ECCS-1542205); the MRSEC program (NSF DMR-1720139) at the Materials Research Center; the International Institute for Nanotechnology (IIN); the Keck Foundation; and the State of Illinois, through the IIN, (ii) CryoCluster equipment, which has received support from the MRI program (NSF DMR-1229693), and (iii) Jerome B. Cohen X-ray Diffraction Facility supported by the MRSEC program of the National Science Foundation (DMR-1720139) at the Materials Research Center of Northwestern University and the Soft and Hybrid Nanotechnology Experimental (SHyNE) Resource (NSF ECCS-1542205). Finally, computational resources provided by XSEDE resources located at San Diego Supercomputer Center and Texas Advanced Computing Center (Grant No. TG-CTS090100) as well as Pacific Northwest National Laboratory (Ringgold ID 130367, Grant Proposal 50576) are gratefully acknowledged.
Supporting Information Available
The Supporting Information is available free of charge on the ACS Publications website at DOI: 10.1021/acscentsci.9b00722.
This work was supported as part of Catalysis for Polymer Upcycling (CPU) by the U.S. Department of Energy (DOE), Office of Basic Energy Sciences, Division of Chemical Sciences, Geosciences, and Biosciences, under Contract DE-AC-02-06CH11357 (Argonne National Laboratory) and DE-AC-02 07CH11358 (Ames Laboratory).
The authors declare the following competing financial interest(s): Two patent applications partially based on this work have been filed (US Patent Applications 62/796,482 and 62/892,347).
Supplementary Material
References
- Advancing Sustainable Materials Management, 2014 fact sheet, EPA530-R-17-01; United States Environmental Protection Agency (EPA) - Office of Land and Emergency Management (5306P), 2016.
- Hopewell J.; Dvorak R.; Kosior E. Plastics recycling: challenges and opportunities. Philos. Trans. R. Soc., B 2009, 364, 2115–2126. 10.1098/rstb.2008.0311. [DOI] [PMC free article] [PubMed] [Google Scholar]
- Rahimi A.; García J. M. Chemical recycling of waste plastics for new materials production. Nat. Rev. Chem. 2017, 1, 0046. 10.1038/s41570-017-0046. [DOI] [Google Scholar]
- Jia X.; Qin C.; Friedberger T.; Guan Z.; Huang Z. Efficient and selective degradation of polyethylenes into liquid fuels and waxes under mild conditions. Sci. Adv. 2016, 2, e1501591 10.1126/sciadv.1501591. [DOI] [PMC free article] [PubMed] [Google Scholar]
- Burange A. S.; Gawande M. B.; Lam F. L. Y.; Jayaram R. V.; Luque R. Heterogeneously catalyzed strategies for the deconstruction of high density polyethylene: plastic waste valorisation to fuels. Green Chem. 2015, 17, 146–156. 10.1039/C4GC01760A. [DOI] [Google Scholar]
- Wong S.; Ngadi N.; Tuan Abdullah T. A.; Inuwa I. M. Catalytic cracking of LDPE dissolved in benzene using nickel-impregnated zeolites. Ind. Eng. Chem. Res. 2016, 55, 2543–2555. 10.1021/acs.iecr.5b04518. [DOI] [Google Scholar]
- Mastral J. F.; Berrueco C.; Gea M.; Ceamanos J. Catalytic degradation of high density polyethylene over nanocrystalline HZSM-5 zeolite. Polym. Degrad. Stab. 2006, 91, 3330–3338. 10.1016/j.polymdegradstab.2006.06.009. [DOI] [Google Scholar]
- Dufaud V.; Basset J.-M. Catalytic hydrogenolysis at low temperature and pressure of polyethylene and polypropylene to diesels or lower alkanes by a zirconium hydride supported on silica-alumina: A step toward polyolefin degradation by the microscopic reverse of Ziegler–Natta polymerization. Angew. Chem., Int. Ed. 1998, 37, 806–810. . [DOI] [PubMed] [Google Scholar]
- Oya S.-i.; Kanno D.; Watanabe H.; Tamura M.; Nakagawa Y.; Tomishige K. Catalytic production of branched small alkanes from biohydrocarbons. ChemSusChem 2015, 8, 2472–2475. 10.1002/cssc.201500375. [DOI] [PubMed] [Google Scholar]
- Nakaji Y.; Nakagawa Y.; Tamura M.; Tomishige K. Regioselective hydrogenolysis of alga-derived squalane over silica-supported ruthenium-vanadium catalyst. Fuel Process. Technol. 2018, 176, 249–257. 10.1016/j.fuproc.2018.03.038. [DOI] [Google Scholar]
- Hibbitts D. D.; Flaherty D. W.; Iglesia E. Effects of chain length on the mechanism and rates of metal-catalyzed hydrogenolysis of n-alkanes. J. Phys. Chem. C 2016, 120, 8125–8138. 10.1021/acs.jpcc.6b00323. [DOI] [Google Scholar]
- Flaherty D. W.; Uzun A.; Iglesia E. Catalytic ring opening of cycloalkanes on Ir clusters: Alkyl substitution effects on the structure and stability of C–C bond cleavage transition states. J. Phys. Chem. C 2015, 119, 2597–2613. 10.1021/jp511688x. [DOI] [Google Scholar]
- Flaherty D. W.; Hibbitts D. D.; Iglesia E. Metal-Catalyzed C–C Bond Cleavage in Alkanes: Effects of Methyl Substitution on Transition-State Structures and Stability. J. Am. Chem. Soc. 2014, 136, 9664–9676. 10.1021/ja5037429. [DOI] [PubMed] [Google Scholar]
- Flaherty D. W.; Hibbitts D. D.; Gürbüz E. I.; Iglesia E. Theoretical and kinetic assessment of the mechanism of ethane hydrogenolysis on metal surfaces saturated with chemisorbed hydrogen. J. Catal. 2014, 311, 350–356. 10.1016/j.jcat.2013.11.026. [DOI] [Google Scholar]
- Flaherty D. W.; Iglesia E. Transition-state enthalpy and entropy effects on reactivity and selectivity in hydrogenolysis of n-alkanes. J. Am. Chem. Soc. 2013, 135, 18586–18599. 10.1021/ja4093743. [DOI] [PubMed] [Google Scholar]
- Almithn A.; Hibbitts D. Comparing rate and mechanism of ethane hydrogenolysis on transition-metal catalysts. J. Phys. Chem. C 2019, 123, 5421–5432. 10.1021/acs.jpcc.8b11070. [DOI] [Google Scholar]
- Almithn A.; Hibbitts D. Effects of catalyst model and high adsorbate coverages in ab initio studies of alkane hydrogenolysis. ACS Catal. 2018, 8, 6375–6387. 10.1021/acscatal.8b01114. [DOI] [Google Scholar]
- Holmberg K.; Andersson P.; Erdemir A. Global energy consumption due to friction in passenger cars. Tribol. Int. 2012, 47, 221–234. 10.1016/j.triboint.2011.11.022. [DOI] [Google Scholar]
- Holmberg K.; Erdemir A. Influence of tribology on global energy consumption, costs and emissions. Friction 2017, 5, 263–284. 10.1007/s40544-017-0183-5. [DOI] [Google Scholar]
- Holmberg K.; Erdemir A. The impact of tribology on energy use and CO2 emission globally and in combustion engine and electric cars. Tribol. Int. 2019, 135, 389–396. 10.1016/j.triboint.2019.03.024. [DOI] [Google Scholar]
- Hamad A.; Al-Zubaidy E.; Fayed M. E. Used lubricating oil recycling using hydrocarbon solvents. J. Environ. Manage. 2005, 74, 153–159. 10.1016/j.jenvman.2004.09.002. [DOI] [PubMed] [Google Scholar]
- Liang Z.; Chen L.; Alam M. S.; Zeraati Rezaei S.; Stark C.; Xu H.; Harrison R. M. Comprehensive chemical characterization of lubricating oils used in modern vehicular engines utilizing GC × GC-TOFMS. Fuel 2018, 220, 792–799. 10.1016/j.fuel.2017.11.142. [DOI] [Google Scholar]
- Stubington J. F.; Sergeant G. D.; Barrett D.; Do P. T. D. H.; Raval K. A. Molecular weight determination in the study of the lubricating oil potential of shale oils. Fuel 1995, 74 (1), 79–82. 10.1016/0016-2361(94)P4334-X. [DOI] [Google Scholar]
- Pulidindi K.; Pandey H.. Polyethylene Wax Market Size By Form (Pellets, Powders, Flakes), By Application (Candles, Packaging, Wood & Firelogs, Plastic Additives & Lubricants, Rubber, Adhesive & Coatings, Cosmetics), Industry Analysis Report, Regional Outlook (U.S., Canada, Germany, UK, France, Spain, Italy, China, India, Japan, Australia, Indonesia, Malaysia, Brazil, Mexico, South Africa, GCC), Growth Potential, Price Trends, Competitive Market Share & Forecast, 2016–2024; Global Market Insights, 2018.
- Andersen T. K.; Fong D. D.; Marks L. D. Pauling’s rules for oxide surfaces. Surf. Sci. Rep. 2018, 73, 213–232. 10.1016/j.surfrep.2018.08.001. [DOI] [Google Scholar]
- Deak D. S. Strontium titanate surfaces. Mater. Sci. Technol. 2007, 23, 127–136. 10.1179/174328407X154383. [DOI] [Google Scholar]
- Goodenough J. B. Electronic and ionic transport properties and other physical aspects of perovskites. Rep. Prog. Phys. 2004, 67, 1915–1993. 10.1088/0034-4885/67/11/R01. [DOI] [Google Scholar]
- Crosby L. A.; Chen B.-R.; Kennedy R. M.; Wen J.; Poeppelmeier K. R.; Bedzyk M. J.; Marks L. D. All roads lead to TiO2: TiO2-rich surfaces of barium and strontium titanate prepared by hydrothermal synthesis. Chem. Mater. 2018, 30, 841–846. 10.1021/acs.chemmater.7b04404. [DOI] [Google Scholar]
- Lin Y.; Wen J.; Hu L.; Kennedy R. M.; Stair P. C.; Poeppelmeier K. R.; Marks L. D. Synthesis-dependent atomic surface structures of oxide nanoparticles. Phys. Rev. Lett. 2013, 111, 156101. 10.1103/PhysRevLett.111.156101. [DOI] [PubMed] [Google Scholar]
- Kienzle D. M.; Marks L. D. Surface transmission electron diffraction for SrTiO3 surfaces. CrystEngComm 2012, 14, 7833–7839. 10.1039/c2ce25204j. [DOI] [Google Scholar]
- Rabuffetti F. A.; Kim H.-S.; Enterkin J. A.; Wang Y.; Lanier C. H.; Marks L. D.; Poeppelmeier K. R.; Stair P. C. Synthesis-Dependent First-Order Raman Scattering in SrTiO3 Nanocubes at Room Temperature. Chem. Mater. 2008, 20, 5628–5635. 10.1021/cm801192t. [DOI] [Google Scholar]
- Marks L. D.; Peng L. Nanoparticle shape, thermodynamics and kinetics. J. Phys.: Condens. Matter 2016, 28, 053001. 10.1088/0953-8984/28/5/053001. [DOI] [PubMed] [Google Scholar]
- Crosby L.; Enterkin J.; Rabuffetti F.; Poeppelmeier K.; Marks L. Wulff shape of strontium titanate nanocuboids. Surf. Sci. 2015, 632, L22–L25. 10.1016/j.susc.2014.10.014. [DOI] [Google Scholar]
- Christensen S. T.; Elam J. W.; Rabuffetti F. A.; Ma Q.; Weigand S. J.; Lee B.; Seifert S.; Stair P. C.; Poeppelmeier K. R.; Hersam M. C.; Bedzyk M. J. Controlled Growth of Platinum Nanoparticles on Strontium Titanate Nanocubes by Atomic Layer Deposition. Small 2009, 5, 750–757. 10.1002/smll.200801920. [DOI] [PubMed] [Google Scholar]
- Dendooven J.; Ramachandran R. K.; Solano E.; Kurttepeli M.; Geerts L.; Heremans G.; Rongé J.; Minjauw M. M.; Dobbelaere T.; Devloo-Casier K.; Martens J. A.; Vantomme A.; Bals S.; Portale G.; Coati A.; Detavernier C. Independent tuning of size and coverage of supported Pt nanoparticles using atomic layer deposition. Nat. Commun. 2017, 8, 1074. 10.1038/s41467-017-01140-z. [DOI] [PMC free article] [PubMed] [Google Scholar]
- Grillo F.; Van Bui H.; La Zara D.; Aarnink A. A. I.; Kovalgin A. Y.; Kooyman P.; Kreutzer M. T.; van Ommen J. R. From single atoms to nanoparticles: Autocatalysis and metal aggregation in atomic layer deposition of Pt on TiO2 nanopowder. Small 2018, 14, 1800765. 10.1002/smll.201800765. [DOI] [PubMed] [Google Scholar]
- Enterkin J. A.; Poeppelmeier K. R.; Marks L. D. Oriented Catalytic Platinum Nanoparticles on High Surface Area Strontium Titanate Nanocuboids. Nano Lett. 2011, 11, 993–997. 10.1021/nl104263j. [DOI] [PubMed] [Google Scholar]
- Enterkin J. A.; Setthapun W.; Elam J. W.; Christensen S. T.; Rabuffetti F. A.; Marks L. D.; Stair P. C.; Poeppelmeier K. R.; Marshall C. L. Propane oxidation over Pt/SrTiO3 nanocuboids. ACS Catal. 2011, 1, 629–635. 10.1021/cs200092c. [DOI] [Google Scholar]
- Zhang Z.; Li L.; Yang J. C. Adhesion of Pt Nanoparticles Supported on γ-Al2O3 Single Crystal. J. Phys. Chem. C 2013, 117, 21407–21412. 10.1021/jp407798b. [DOI] [Google Scholar]
- Hahladakis J. N.; Velis C. A.; Weber R.; Iacovidou E.; Purnell P. An overview of chemical additives present in plastics: Migration, release, fate and environmental impact during their use, disposal and recycling. J. Hazard. Mater. 2018, 344, 179–199. 10.1016/j.jhazmat.2017.10.014. [DOI] [PubMed] [Google Scholar]
- Carr S. H.; Keller A.; Baer E. Relationship between self-seeded and epitaxial crystallization from polymer solutions: A potentially new method for molecular weight separation and a new decoration method for alkali halides. J. Polym. Sci., Part A-2 1970, 8, 1467–1490. 10.1002/pol.1970.160080905. [DOI] [Google Scholar]
- Kurosu H.; Takahashi K.; Inoue D.; Ando I. Structural characterization of 13C-labeled n-tetracosane adsorbed on the surface of silica gel by high-resolution solid-state 13C NMR spectroscopy. J. Mol. Struct. 2000, 516, 177–184. 10.1016/S0022-2860(99)00196-9. [DOI] [Google Scholar]
- Inoue D.; Kurosu H.; Chen Q.; Ando I. Structural and dynamical studies of 13C-labeled polyethylene adsorbed on the surface of silica gel by high-resolution solid-state 13C NMR spectroscopy. Acta Polym. 1995, 46, 420–423. 10.1002/actp.1995.010460603. [DOI] [Google Scholar]
- Kresse G.; Furthmüller J. Efficient iterative schemes for ab initio total-energy calculations using a plane-wave basis set. Phys. Rev. B: Condens. Matter Mater. Phys. 1996, 54, 11169–11186. 10.1103/PhysRevB.54.11169. [DOI] [PubMed] [Google Scholar]
- Kresse G.; Furthmüller J. Efficiency of ab-initio total energy calculations for metals and semiconductors using a plane-wave basis set. Comput. Mater. Sci. 1996, 6, 15–50. 10.1016/0927-0256(96)00008-0. [DOI] [PubMed] [Google Scholar]
- Kresse G.; Hafner J. Ab initio molecular-dynamics simulation of the liquid-metal-amorphous-semiconductor transition in germanium. Phys. Rev. B: Condens. Matter Mater. Phys. 1994, 49, 14251–14269. 10.1103/PhysRevB.49.14251. [DOI] [PubMed] [Google Scholar]
- Kresse G.; Hafner J. Ab initio molecular dynamics for liquid metals. Phys. Rev. B: Condens. Matter Mater. Phys. 1993, 47, 558–561. 10.1103/PhysRevB.47.558. [DOI] [PubMed] [Google Scholar]
- Kienzle D. M.; Becerra-Toledo A. E.; Marks L. D. Vacant-site octahedral tilings on SrTiO3 (001), the (√13 x √13)R33.7° surface, and related structures. Phys. Rev. Lett. 2011, 106, 176102. 10.1103/PhysRevLett.106.176102. [DOI] [PubMed] [Google Scholar]
- Erdman N.; Warschkow O.; Asta M.; Poeppelmeier K. R.; Ellis D. E.; Marks L. D. Surface Structures of SrTiO3 (001): A TiO2-rich Reconstruction with a c(4 × 2) Unit Cell. J. Am. Chem. Soc. 2003, 125, 10050–10056. 10.1021/ja034933h. [DOI] [PubMed] [Google Scholar]
- Manner W. L.; Bishop A. R.; Girolami G. S.; Nuzzo R. G. Melting of rodlike molecules on Pt(111). Infrared spectroscopic studies of isotopically labeled n-Alkanes. J. Phys. Chem. B 1998, 102, 8816–8824. 10.1021/jp982230u. [DOI] [Google Scholar]
- Chesters M. A.; Gardner P.; McCash E. M. The reflection-absorption infrared spectra of n-alkanes adsorbed on Pt(111). Surf. Sci. 1989, 209, 89–99. 10.1016/0039-6028(89)90060-5. [DOI] [Google Scholar]
- Yang M.; Somorjai G. A. Adsorption and reactions of C6 hydrocarbons at high pressures on Pt(111) single-crystal surfaces studied by sum frequency generation vibrational spectroscopy: Mechanisms of isomerization and dehydrocyclization of n-hexane. J. Am. Chem. Soc. 2004, 126, 7698–7708. 10.1021/ja0361446. [DOI] [PubMed] [Google Scholar]
- Che M.; Bennett C. O.. The Influence of Particle Size on the Catalytic Properties of Supported Metals. In Adv. Catal.; Eley D. D.; Pines H.; Weisz P. B., Eds.; Academic Press, 1989; Vol. 36, pp 55–172. [Google Scholar]
- Enterkin J. A.; Kennedy R. M.; Lu J.; Elam J. W.; Cook R. E.; Marks L. D.; Stair P. C.; Marshall C. L.; Poeppelmeier K. R. Epitaxial stabilization of face selective catalysts. Top. Catal. 2013, 56, 1829–1834. 10.1007/s11244-013-0118-y. [DOI] [Google Scholar]
- Kennedy R. M.; Crosby L. A.; Ding K.; Canlas C. P.; Gulec A.; Marks L. D.; Elam J. W.; Marshall C. L.; Poeppelmeier K. R.; Stair P. C. Replication of SMSI via ALD: TiO2 overcoats increase Pt-catalyzed acrolein hydrogenation selectivity. Catal. Lett. 2018, 148, 2223–2232. 10.1007/s10562-018-2458-5. [DOI] [Google Scholar]
- Engelhardt C. M.; Kennedy R. M.; Enterkin J. A.; Poeppelmeier K. R.; Ellis D. E.; Marshall C. L.; Stair P. C. Structure Sensitivity of Acrolein Hydrogenation by Platinum Nanoparticles on BaxSr1–xTiO3 Nanocuboids. ChemCatChem 2018, 10, 632–641. 10.1002/cctc.201701505. [DOI] [Google Scholar]
Associated Data
This section collects any data citations, data availability statements, or supplementary materials included in this article.