

Abstract
Lactoferrin (LTF) is an iron-binding protein canonically known for its innate and adaptive immune functions. LTF may also act as a tumor suppressor with antiproliferative action. LTF is inactivated genetically or epigenetically in various cancers, and a CpG island spanning the transcriptional start site of LTF is hypermethylated in prostate cancer cell lines. We, therefore, hypothesized that LTF expression is silenced via CpG island hypermethylation in the early stages of prostate tumorigenesis carcinogenesis. Targeted methylation analysis was performed using a combination of methylated-DNA precipitation and methylation-sensitive restriction enzymes, and laser-capture microdissection followed by bisulfite sequencing on DNA isolated from prostate tissue samples, including both primary and metastatic disease. LTF mRNA in situ hybridization and LTF protein immunohistochemistry were also performed. We report that the LTF CpG island is frequently and densely methylated in high-grade prostatic intraepithelial neoplasia, primary prostate carcinoma, and metastases. We further report a decoupling of lactoferrin mRNA and protein expression, including in lesions where LTF mRNA has presumably been silenced via CpG island methylation. We conclude that LTF mRNA expression is silenced in prostate tumorigenesis via hypermethylation, supporting a role for LTF as a prostate cancer tumor suppressor gene. Likewise, the frequency at which the LTF CpG island is methylated across samples suggests it is an important and conserved step in prostate cancer initiation.
Inflammation has been implicated in prostate cancer initiation and progression.1, 2, 3 Although the causative factors driving prostatic inflammation are largely uncertain, chronic inflammation and, to a lesser extent, acute inflammation are common findings in the peripheral and transition zones of the prostate. Of interest, these two zones that have the most inflammation are also the zones most likely to develop disease. The transition zone is the zone most likely to develop benign prostatic hyperplasia (BPH), and the peripheral zone is the zone most likely to develop prostate cancer. Corpora amylacea are small stone-like structures that are frequently found in prostatectomy samples, often in areas of inflammation. It has previously been demonstrated that corpora amylacea are composed of proteins involved in acute inflammatory responses and, in particular, proteins contained in neutrophil granules.4 The most abundant of these proteins was the innate immune protein lactoferrin (LTF). LTF is an iron-binding protein in the transferrin family found in secreted fluids, such as breast milk, tears, sweat, and prostatic fluid.5, 6, 7 LTF has been shown to reduce inflammation and oxidative stress via its iron-binding abilities.8 LTF protein has antimicrobial properties, can initiate an immune response, and protects against the harmful effects of inflammation.8, 9, 10, 11 LTF protein has also been absent or weakly expressed in benign prostate tissue in the peripheral zone, with a marked increase in areas with inflammation and/or atrophy; and LTF protein is low or absent in prostate cancer.4, 12
Proliferative inflammatory atrophy, in which atrophic epithelial cells are highly proliferative (apparently in response to cellular damage) and surrounded by inflammatory cells, is a type of atrophy that can be prevalent in the prostates of some men.13 These atrophic glands share, at a low frequency, some of the somatic genomic alterations found in prostate cancer and its putative precursor lesion, prostatic intraepithelial neoplasia (PIN). Proliferative inflammatory atrophy lesions also show early evidence of epigenetic changes that are common in prostate cancer. For instance, CpG hypermethylation of the promoter region of glutathione S-transferase-π gene (GSTP1) can be found in proliferative inflammatory atrophy and PIN and is present in >90% of invasive carcinomas.3, 14 Interestingly, other stress response genes, such as PTGS2 (which encodes for cyclooxygenase 2), show a similar pattern of epigenetic silencing during prostate cancer initiation and progression.15 Along these lines, reports suggest that LTF also undergoes epigenetic silencing by CpG hypermethylation in several types of cancer and in prostate cancer cell lines.16, 17, 18, 19 Prior reports indirectly suggest that hypermethylation of this CpG island results in silencing of the LTF gene by demonstrating that LTF expression is restored by treatment with the demethylating agent 5-aza-2′-deoxycytidine in lung and prostate cancer cell lines.19, 20 Furthermore, the observed LTF down-regulation or loss due to genetic mutation, allelic loss, or epigenetic silencing indicates that LTF may play an important role in many forms of cancer and may serve as a potential chemopreventative agent.19, 21, 22, 23 Exogenously restoring LTF expression resulted in inhibition of proliferation and tumor growth in the human breast carcinoma cell line MDA-MB-231.24 In addition, treatment of four different human and neck cancer cell lines with LTF resulted in growth inhibition.25 In vivo, administration of bovine LTF inhibited the growth of intestinal polyps in mice and, in rats, reduced colon carcinogenesis after initiation.26, 27, 28
As prior reports of lactoferrin CpG island methylation in prostate cancer have been limited to analyses in LNCaP and LAPC4 cells,19 and given the role of LTF as an immune modulator and potentially as a tumor suppressor, we comprehensively studied LTF expression and its pattern of epigenetic silencing in primary and metastatic prostate cancer. On the basis of our previous studies examining protein expression of LTF in radical prostatectomy specimens,4 we hypothesized that LTF would be unmethylated but not expressed in normal benign prostate epithelial tissue and methylated and silenced in cancer. We further hypothesized that methylation of the CpG sites would begin in PIN and spread further throughout the CpG island of the LTF gene in cancer. To test these hypotheses, we determined the status of methylation of the LTF CpG island in normal benign prostate epithelial cells, BPH, high-grade PIN, cancer, and local and distant metastases. In addition, we evaluated the status and cellular localization of LTF protein and mRNA expression in normal-appearing prostate, prostatic atrophy, PIN, cancer, and distant metastases.
Materials and Methods
Tissue Sections
Hematoxylin and eosin–stained slides from recent formalin-fixed, paraffin-embedded radical prostatectomy specimens (<2 years old) were reviewed by an experienced pathologist (I.K., J.A.B.-D.V., or A.M.D.M.); and two tissue blocks were selected from each case: one with invasive adenocarcinoma (herein referred to as tumor), high-grade PIN near (<3 mm away) tumor, and benign; and one with high-grade PIN, benign, and no tumor on the block or on immediately adjacent blocks. From each block, five (7 μm thick) sections were cut onto 4-μm PEN membrane slides (Leica Biosystems, Buffalo Grove, IL; catalog number 11600288) for laser-capture microdissection (LCM) and stored at room temperature until used for LCM. A sixth section was used for a hematoxylin and eosin stain for reference, and additional adjacent sections were cut onto glass slides and then stored at −20°C until use for immunohistochemistry (IHC) or chromogenic RNA in situ hybridization (RISH).
LCM and DNA Extraction
Before LCM, the unstained sections on membrane slides were deparaffinized in xylenes for 10 minutes twice, then rehydrated through 100% then 70% molecular biology grade ethanol in molecular biology grade water. The slides were then counterstained in 1:4.5 Dako Mayer's Hematoxylin Lillie's modification (Agilent, Santa Clara, CA; catalog number S330930-2) in molecular biology grade water. Slides were then rinsed in molecular biology water and dehydrated through an ethanol series and xylenes, then air dried in a sterile hood. Hematoxylin and eosin stains of whole slides were scanned and annotated to identify regions of tumor, high-grade PIN, and benign normal-appearing epithelium. These areas were then isolated using a Leica LMD7000 system (Leica Microsystems, Buffalo Grove, IL) in the Sidney Kimmel Comprehensive Cancer Center Cell Imaging Core Facility. DNA from three of the cases was extracted, as previously described for LCM specimens.14 The remaining three cases were extracted using the QIAmp DNA FFPE Tissue Kit (Qiagen, Germantown, MD; catalog number 56404). DNA was quantified by β-globin real-time quantitative PCR using iQ SYBR Supermix (Bio-Rad Laboratories, Hercules, CA; catalog number 1708880) with a known quantity of commercial white blood cell DNA (BioChain, Newark, CA; catalog number D1234148) as the standard curve. Primers used were as follows: forward, 5′-GTGCACCTGACTCCTGAGGAGA-3′; and reverse, 5′-CCTTGATACCAACCTGCCCAG-3′. Cycling conditions were as follows: 95°C for 3 minutes; and 40 cycles of 95°C for 30 seconds, 64°C for 30 seconds, and 72°C for 45 seconds.
Bisulfite Conversion and PCR
A diagram of all assays used in our LTF studies is shown in Supplemental Figure S1. Bisulfite conversion was done using the EZ DNA Methylation Gold Kit (Zymo Research, Irvine, CA; catalog number D5005), and converted DNA was amplified using either AmpliTaq Gold (ThermoFisher, Waltham, MA; catalog number N808241) PCR reagents or Hot MolTaq (Molzym, Bremen, Germany; catalog number P-080-0100). Primers used were bisLTF (+) on the sense strand: forward, 5′-TTTTTTATGTGGGAAAGAGATTG-3′; and reverse, 5′-CAAACATAAAACTTATCTTCCTC-3′; and bisLTF (−) on the antisense strand: forward, 5′-GGGGTAAAGTTTTGAATAAAGGGG-3′; and reverse, 5′-AAAACCCAACTCCTATTCCTCCCCAT-3′. Cycling conditions were as follows: 95°C for 2 minutes; 95°C for 30 seconds, 55°C for 30 seconds, and 72°C for 30 seconds for 45 cycles; and 72°C for 2 minutes. PCR products were separated onto a 1% agarose gel, and bands were extracted using a QIAquick Gel Extraction Kit (Qiagen; catalog number 28706). Extracted PCR products were cloned using a TopoTA cloning kit for sequencing with chemically competent Escherichia coli (ThermoFisher; catalog number K4575J10). DNA from clones was extracted using Chelex 100 Chelating Resin (Bio-Rad Laboratories, Hercules, CA; catalog number 1432832). This DNA was then amplified using AmpliTaq Gold and M13 primers: forward, 5′-GTAAAACGACGGCCAG-3′; and reverse, 5′-CAGGAAACAGCTATGACC-3′. Cycling conditions were as follows: 94°C for 2 minutes; 94°C for 30 seconds, 49°C for 30 seconds, and 72°C for 1 minute for 35 cycles; and 72°C for 10 minutes. PCR products were then purified using a QIAquick PCR Purification kit (Qiagen; catalog number 28106) and submitted for Sanger sequencing at the Johns Hopkins Genetic Resources Core Facility. Sequences were trimmed and aligned in Sequencher version 5.1 (Gene Codes Corporation, Ann Arbor, MI), and consensus sequences were then input to DNA Methyl Map version 2.4 [custom software developed by Kumar Balasubramanian (Panasys Inc.) and S.Y.] to map methylated/unmethylated CpGs.29 The number of sequences mapped from each case and area were as follows: Case 1, 9 benign, 8 PIN away, and 10 PIN near; Case 2, 2 benign, 4 PIN away, 7 PIN near, and 2 tumor; Case 3, 7 benign, 7 PIN away, 7 PIN near, and 6 tumor; Case 4, 3 benign, 6 PIN away, 5 PIN near, and 6 tumor; and Case 5, 2 tumor.
Combination of Methylated-DNA Precipitation and Methylation-Sensitive Restriction Enzymes (COMPARE-MS)
Locus-specific DNA methylation analyses were performed, as previously described, with minor modifications.30, 31 Patient samples used in this study were described previously.15, 29 In brief, DNA sample concentrations were determined by spectrophotometer and validated by quantitative real-time PCR. DNA samples were digested with AluI and HhaI (New England Biolabs, Ipswich, MA). Enrichment reactions containing 20 μL of magnetic Tylon beads (Clontech, Mountain View, CA), 10 μg of recombinant methyl-CpG binding domain protein 2 (MBD2; Clontech), and 200 ng of unmethylated self-ligated pCR2.1 vector (Invitrogen, Carlsbad, CA) were assembled in enrichment buffer [4% glycerol, 1 mmol/L MgCl2, 0.5 mmol/L EDTA, 0.5 mmol/L dithiothreitol, 120 mmol/L NaCl, 10 mmol/L Tris–HCl (pH 7.4), 0.2% Tween-20, and protease inhibitors] and incubated for 1 hour at room temperature. After immobilization of magnetic beads, the supernatants containing unbound MBD2 polypeptides were discarded; and digested DNA samples were diluted in 100 μL of enrichment buffer and incubated with MBD2-coated beads for 12 hours at room temperature under gentle shaking. Beads and associated DNA complexes were then immobilized by magnetization and washed three times with enrichment buffer. Precipitated DNA containing methylated DNA fragments was eluted in water by heating to 95°C for 15 minutes. Eluted DNA was then subjected to quantitative real-time PCR using the IQ SYBR Green Supermix (Bio-Rad Laboratories, Hercules, CA; catalog number 1708880) using primers LTF_COMPARE_F (5′-AGTGGCAGAGCCTTCGTTT-3′) and LTF_COMPARE_R (5′-ACCGGACACAGGGACCAA-3′) (Supplemental Figure S1). Male white blood cell genomic DNA was in vitro treated with M.SssI (New England Biolabs; catalog number M0226S) to obtain a fully methylated control. Untreated male white blood cell DNA served as a negative control. For quantitative assessment of locus-specific methylation levels, Ct values of the samples of interest were normalized to Ct values of the positive control (SssI) and calculated methylation indexes (ranging from 0.0 to 1.0) were used to derive methylation heatmaps.
TMA Data
Two tissue microarray (TMA) sets were used for LTF IHC and RISH. The first was a 120 Case High Grade Race Disparity TMA from the Department of Defense Prostate Cancer Research Program (http://prostatebiorepository.org) that was enriched for higher-grade (Gleason grade group 3 to 5) cases. This TMA set included 60 cases each from African American and European American men matched on age (±3 years), grade, and stage. From each case, four cores tumor and four cores matched benign were selected for inclusion in the TMA. The second TMA included metastases from distant sites collected at autopsy from six patients on the patient's death from prostate cancer. Three cores were selected from each metastatic site across multiple metastatic sites for each case.
IHC Data
LTF IHC was performed using anti-lactoferrin antibody EPR4338 (Abcam, Cambridge, UK; lot GRG65110-7) at 1:600 concentration, diluted in Antibody Dilution Buffer (Roche, Indianapolis, IN; catalog number ADB250) for 45 minutes at room temperature. Antigen retrieval was done in a steamer for 25 minutes using citrate unmasking buffer (Vector Laboratories, Peterborough, UK; catalog number H-3300). Powervision + Rabbit from Leica Biosystems (Buffalo Grove, IL; catalog number PV6119) was applied for 30 minutes at room temperature. SIGMAFAST 3,3′-diaminobenzidine (Sigma-Aldrich, St. Louis, MO; catalog number D4293) was applied for 20 minutes at room temperature. Hematoxylin counterstaining was then performed. There are two main forms of LTF: a full-length secreted form and a form arising from transcription beginning at an alternative promoter site in the first intron, ΔLTF. Positive and negative controls for the LTF IHC assay were performed with the PC3 prostate cancer cell line transfected with expression vectors for a full-length secreted form of LTF or ΔLTF (Origene, Rockville, MD) (Supplemental Figure S2). It was also confirmed via Western blot analysis that the antibody does not cross-react with transferrin (Supplemental Figure S2). Intelectin-1/2 (ITLN1/2) IHC was performed on a Roche Discovery Ultra machine using an intelectin 1/2 antibody (Abcam; catalog number EPR 20311) at dilution 1:400 for 40 minutes. Antigen retrieval CC1 was applied for 48 minutes. Discovery Anti-Rabbit HQ HRP with AMP kit (Roche Diagnostics, Basel, Switzerland) was used for chromogenic detection. Positive and negative controls for the intelectin 1/2 IHC assay are shown in Supplemental Figure S3.
RISH Data
RISH was performed on adjacent cuts (Tissue Sections) from the cohort using a human LTF probe (ACD, Newark, CA; catalog number 425101). RNA quality in all tissues was assessed using peptidylprolyl isomerase B mRNA probe (positive control; ACD; catalog number 313911). The ACD RNAscope 2.0 Sample Preparation for FFPE Tissue Kit (ACD; catalog number 320046) was used, with the following adjustments: slides were treated with Pretreat 2 for 15 minutes, then dipped twice in 1% Tween in deionized water before applying Pretreat 3 for 15 minutes at 40°C. For detection, the RNAscope 2.0 HD Detection Kit (Brown) (ACD; catalog number 310035) was used. Positive and negative controls for the LTF RISH assay were performed with the PC3 prostate cancer cell line transfected with expression vectors for a full-length secreted form of LTF or ΔLTF (Origene) (Supplemental Figure S2).
Image Analysis
Whole tissue slides were scanned at 20× objective with an Aperio ScanScope CS linear-array scanner (Aperio, Vista, CA), and image analysis was performed using Aperio Image Scope focused on areas that were annotated for LCM. For TMAs, slides were scanned at 20× objective; and image analysis was performed on each TMA spot using TMAJ and FRIDA (http://tmaj.pathology.jhmi.edu, last accessed July 16, 2019). Hue, saturation, value (HSV) color space segmentation was used to define the brown (positive IHC/RISH) and blue (hematoxylin) masks; metamasks were generated to combine the color and Lasso Masks for image analysis. Stroma, staining artifacts, and glands that did not correspond with the annotation diagnoses were excluded.
Statistical Analysis
Unless otherwise indicated, data were compared among groups by two-tailed U-test using GraphPad Prism Software version 7.01 (GraphPad Software, Inc., San Diego, CA). Values were considered statistically significant at P < 0.05.
Results
Lactoferrin Methylation in Both Primary and Metastatic Prostate Cancer
The methylation status of LTF was determined in a series of organ donor prostate specimens, BPH specimens, benign and matched tumor specimens from radical prostatectomy, local lymph node metastases collected at radical prostatectomy, and distant metastases collected at rapid autopsy using COMPARE-MS, which has been previously extensively validated.30 Organ donor prostates that were entirely submitted for histology, and showed no evidence of benign or neoplastic prostatic disease on histologic examination, exhibited low to absent LTF CpG island methylation (Figure 1A). A series of benign tissues that were matched to primary tumor samples likewise had low levels of methylation. There were two exceptions of benign tissues that had high levels of methylation (Cases 21 and 23) (Figure 1A). On further examination of these benign tissues with a PIN4 stain (high-molecular-weight cytokeratin, p63, and racemase; data not shown), the area harvested from Case 21 was an area of BPH with regions suggestive of high-grade PIN and/or early infiltrating cancer and the area harvested from Case 23 contained regions suggestive of low- and high-grade PIN with regions of atypia and/or early infiltrating carcinoma. The methylation levels in BPH tissues were low to moderate, with two of five samples containing methylation higher than that of benign and organ donor samples (Figure 1A). In contrast, primary tumor samples showed high levels of methylation, with 19 of 21 primary carcinoma samples exhibiting methylation above that of the benign tissues (Figure 1A). The matched tumor samples generally showed much higher levels of methylation than their benign counterparts, with the exception of Cases 21 and 23, as noted (Figure 1A). Lymph node metastases samples also showed a range of methylation levels, with all samples having some level of methylation. Distant metastases recovered at autopsy from men who died from metastatic prostate cancer also showed high levels of methylation, with 24 of 28 samples exhibiting methylation above that of benign tissues. These results demonstrate that a CpG island involving the LTF gene is frequently methylated in primary and metastatic prostate cancer. Analyses of prostate cancer The Cancer Genome Atlas data,32 obtained using cBioPortal,33 demonstrated an inverse correlation between LTF methylation and mRNA expression (Figure 1B) and provided support for frequent methylation of the LTF CpG island in prostate cancer. These results for LTF are in line with similar in silico analyses of known methylated genes in prostate cancer, such as GSTP1, PTGS2, and CD38.31
Figure 1.

Combination of methylated-DNA precipitation and methylation-sensitive restriction enzymes (COMPARE-MS) demonstrates hypermethylation in primary and metastatic prostate cancer. A: Heat maps of COMPARE-MS results. White indicates no methylation, and dark red indicates 100% methylation. COMPARE-MS results demonstrate that organ donor and benign areas of prostates, obtained at radical prostatectomy, have low levels of methylation, whereas primary and metastatic prostate cancer has higher levels of methylation. Benign prostatic hyperplasia (BPH) has an intermediate level of methylation. B:In silico analysis of lactoferrin methylation versus mRNA expression using The Cancer Genome Atlas data from cBioPortal. LTF, lactoferrin; RSEM, RNA-seq by expectation maximization.
LCM and Bisulfite Sequencing Confirm Progressive Hypermethylation of the Lactoferrin CpG Island in PIN and Prostate Cancer
Bisulfite sequencing was performed on areas of benign normal-appearing (not atrophic, noninflamed, not low-grade PIN), high-grade PIN, and prostate cancer isolated using LCM to determine the extent of LTF methylation in these histomorphologically defined lesions. Cancer, high-grade PIN, and benign epithelial cells were carefully microdissected to enrich for luminal epithelium without stromal components (Supplemental Figure S4). Because intra-acinar spreading of carcinoma can appear similar to PIN,34 PIN near tumor (<3 mm from tumor) was analyzed separately from PIN away from tumor (no tumor on block or adjacent blocks). Benign tissues showed variable, but little to no, methylation in most of the 21 CpG sites examined, with the first 4 CpG sites being the most likely to be methylated (Figure 2). PIN both near and away from tumor had methylation across all 21 CpG sites in each case, with some cases having a high degree of methylation across all sites and others having low to moderate methylation at some CpG sites. Tumor was highly methylated across most of the CpG sites in all cases examined.
Figure 2.

Lactoferrin CpG island is hypermethylated in prostatic intraepithelial neoplasia (PIN) and prostate cancer. Clones obtained from bisulfite sequencing were analyzed with a bisulfite read mapper tool, Methyl Map. Each circle indicates average methylation across sequences from a case for each CpG site. White indicates unmethylated in all sequences, and red indicates methylated in all sequences. Benign samples generally had low methylation; however, PIN both near and away from cancer and cancer showed higher levels of methylation across all CpG sites.
A Comparison of LTF mRNA and Protein Levels in Relation to Methylation
IHC staining for LTF protein and RISH for LTF mRNA were performed on adjacent sections of the slides used for LCM, shown in Figure 2, to determine the correlation between methylation and levels of mRNA and protein expression in the same lesions. Annotations were carefully drawn so as to perform image analysis only on the specific glands that were also captured by LCM (Supplemental Figure S5). Positively stained (3,3′-diaminobenzidine; brown) pixels in the annotated regions were calculated as a percentage of the total positive pixels per annotated area. Percentage positive pixels was plotted against the average percentage methylation across the 21 targeted CpGs in the selected regions (Figure 2). As expected, benign noninflamed prostate tissue had little LTF mRNA expression, despite lack of methylation (Figure 3A), as our previous study had demonstrated that LTF protein expression in benign regions is restricted to atrophy and inflamed epithelium.4 Likewise, high-grade PIN lesions both near and away from tumor and tumor samples were highly methylated and, therefore, expectedly negative for mRNA expression. Of interest, LTF protein expression was present in many of the samples, despite methylation status and a lack of mRNA expression (Figure 3, A–C). It was confirmed for all cases that lack of mRNA expression was not simply due to RNA degradation with a positive control stain for peptidylprolyl isomerase B (data not shown). The protein staining by LTF IHC is not attributed as false-positive staining or a cross-reaction to another peptide/antigen because the IHC assay was validated with positive and negative controls whose expression was independently determined, and Western blot analysis of prostate tissue lysates produced only a single band at the correct size (Supplemental Figure S2). Furthermore, IHC staining with a separate LTF antibody (clone L3262; Sigma-Aldrich) showed an identical staining pattern to the Abcam antibody in areas that were negative for LTF by RISH (Supplemental Figure S6).
Figure 3.

Lactoferrin (LTF) protein and mRNA do not correlate with each other or with methylation. A: Percentage positive pixels for immunohistochemistry (IHC) and RNA in situ hybridization (RISH) plotted against percentage methylation in sequences reveals no correlation between methylation and protein expression. B: LTF protein expression assessed via IHC shows abundant LTF protein. Adjacent section to image in C. C: LTF mRNA expression assessed via RISH shows little to no expression in areas with abundant protein in B. Original magnification, ×40 (B and C). PIN, prostatic intraepithelial neoplasia.
TMA Analysis Confirms Decoupling of Protein and mRNA Expression in PIN and Cancer
LTF IHC and RISH were performed on an additional 120 cases of matched benign and primary prostate cancer as well as six cases of metastatic samples from rapid autopsy using TMAs, and the results were quantified. For this analysis, the sum of intensities of all positive pixels for each TMA spot, where each spot was given a tissue diagnosis of benign (normal appearing), atrophy, PIN, or cancer, was calculated and the results were compared between tissue types for both IHC and RISH. The results of this analysis confirmed that, other than atrophy lesions, in which high levels of both mRNA and protein were present in the same regions, all of the other tissue types examined often demonstrated protein expression but no detectable mRNA expression (Figure 4, and Supplemental Figure S7). Interestingly, mRNA, but not protein, expression in normal prostate tissue was also significantly higher than cancer or distant metastases.
Figure 4.

Lactoferrin (LTF) protein and mRNA expression do not correlate, as assessed with tissue microarrays. A: LTF protein is often present when there is no LTF mRNA expression. B and C: Log2 of total positive intensity shows that atrophy is the only cell type with protein at comparable levels (B) to mRNA (C). Atrophy was also the highest expressing lesion type for both protein and mRNA. C: For mRNA, normal prostate shows greater expression compared with primary or metastatic prostate cancer. *P < 0.05, **P < 0.005, ***P < 0.0005, and ****P < 0.0001. Original magnification, ×200 (A). IHC, immunohistochemistry; PIN, prostatic intraepithelial neoplasia; PPIB, peptidylprolyl isomerase B; RISH, RNA in situ hybridization.
When the samples were assessed in relation to tumor grade, both normal and PIN from prostates with higher-grade tumors (Gleason score ≥ 4 + 3 = 7; Gleason grade group 3 to 5) had significantly higher protein expression than those with lower-grade tumors (Gleason score 6 and 3 + 4 = 7; Gleason grade group 1 to 2) (Supplemental Figure S8A). This trend was not observed for LTF mRNA expression. There were no differences in LTF mRNA and protein expression when the tissue types were assessed by race, with the exception that LTF protein expression was significantly higher in atrophy from African American men versus European American men (Supplemental Figure S8B).
Although distant metastases had the lowest LTF mRNA and protein expression of all tissue types assessed (Figure 4, B and C), both mRNA and protein expression differed by metastatic site (Figure 5), with the highest protein expression in liver metastases and the highest mRNA expression in lung metastases. Unlike primary prostate cancer, metastatic cancer cells were rarely observed to express LTF protein. Rather, positive IHC and/or RISH signals were most likely from immune cells or benign cells (eg, hepatocytes) present in the metastatic niche (Supplemental Figure S9).
Figure 5.

Distant metastases have varying low levels of lactoferrin (LTF) mRNA and protein that do not correspond. A: LTF protein and mRNA vary by site and do not correspond. B and C: Log of total positive intensity shows a wide variety in protein (B) and mRNA (C) by metastatic site. *P < 0.05, **P < 0.005, ***P < 0.0005, and ****P < 0.0001. Original magnification, ×200 (A). IHC, immunohistochemistry; PPIB, peptidylprolyl isomerase B; RISH, RNA in situ hybridization.
Lactoferrin Receptor (ITLN-1) Expression Does Not Explain LTF mRNA/Protein Decoupling
Because LTF is known to be a secreted protein that is readily taken up by epithelial cells via receptor-mediated endocytosis,7, 35 we hypothesized that the protein observed via IHC, but not by RISH, was secreted elsewhere in the prostate and taken up by these cells. To explore this further, IHC was performed for ITLN-1/2, the canonical lactoferrin receptor using small intestine as a positive control (Figure 6A).35, 36 Intriguingly, in normal noninflamed benign prostate, basal epithelial cells were found to be positive for ITLN-1/2 (Figure 6B). This is in contrast to our observation that LTF-positive cells are luminal epithelial cells (Figure 4A and Figure 6C). In select regions of atrophy, and likely regions enriched with intermediate cells,37 ITLN-1/2, LTF mRNA, and LTF protein were all present in luminal epithelial cells (Figure 6C). ITLN-1/2 was not found to be present, however, in the cells with discordant expression of LTF mRNA and protein (Figure 6C).
Figure 6.

Lactoferrin (LTF) receptor [intelectin-1/2 (ITLN-1/2)] expression does not explain discordant LTF mRNA and protein expression. Immunohistochemistry (IHC) for intelectin, the canonical LTF receptor. A: Small intestine (positive control). B: ITLN-1/2 is localized to basal epithelial cells in normal, noninflamed prostate. C: Top panels: ITLN-1/2 is localized to basal epithelial cells and LTF mRNA and protein is absent in normal, noninflamed prostate. Middle panels: ITLN-1/2 staining is observed in luminal cells concurrent with LTF mRNA and protein in some regions of prostatic atrophy. Bottom panels: ITLN-1/2 is not expressed in cases where there is LTF protein expression but no mRNA. Example shown is an LTF IHC-positive region in cancer. Original magnification, ×200 (A–C). RISH, RNA in situ hybridization.
Discussion
LTF has previously been shown to act as a tumor suppressor and to have antiproliferative effects on epithelial cells.17, 38 LTF can also initiate innate immune responses, as well as protect against the harmful effects of inflammation.8, 9, 10, 39, 40, 41 This multifunctionality makes LTF a particularly interesting protein in cancers in which inflammation plays a role, such as prostate cancer. In prostate cancer, there is evidence for inflammation as a driver of tumorigenesis.1, 2, 3, 13 Silencing of LTF may allow this inflammation to propagate. A previous IHC study found LTF expression in individual cells (often many of them staining positive) or in epithelial structures referred to as lacunae (consisting of regions now referred to as benign roman bridging architecture) in the normal central zone, but not in the peripheral zone, except during inflammation.12 This low level of expression in the normal central zone may help to protect against the development of prostatic diseases, such as BPH and cancer.
The region containing the CpG island methylation of the LTF regulatory region studied herein has been previously shown to be associated with LTF transcriptional silencing.19, 20 Our results demonstrate that LTF has low to absent CpG island methylation in benign prostate tissue. Although normal prostate cells do not express LTF, this is not due to CpG island hypermethylation; therefore, LTF is presumably inducible in response to inflammatory stimuli in benign cells. In contrast, multiple lines of evidence that the LTF CpG island is hypermethylated in prostate cancer cells in clinical patient samples and is associated with the absence of LTF mRNA have now been shown. In addition, this hypermethylation is also present in the putative precursor lesion, high-grade PIN, local lymph node metastases, and distant metastases from castration-resistant prostate cancer.
One important factor to consider is the level of enrichment in the LCM versus the COMPARE-MS cohorts. LCM produces a strong enrichment for the specific epithelium of interest. However, at least some infiltrating immune cells are likely still present in these samples. Likewise, basal cells (in benign and PIN samples) as well as some stromal cells would have been collected alongside the luminal cells of interest. In the COMPARE-MS data set, these are larger areas of tissue that were selected to be enriched in the epithelium of interest (macrodissected), but there is no attempt to avoid intervening stroma such that there is much less stringent enrichment than in LCM. For example, the tumor areas generally had approximately >70% to 90% tumor nuclei. This results in significant procurement of many nonepithelial cells and some epithelial cell types other than that of interest, which, in turn, would lead to underestimation of percentage methylation in cancer. In benign/normal-appearing regions, prostates from organ donors showed even lower levels of methylation compared with benign/normal-appearing regions from prostates with prostate cancer. In the COMPARE-MS sample set, because frozen sections were used for the diagnoses, and PIN is difficult to diagnose or exclude on a frozen section, PIN would not have necessarily been excluded from some of the benign areas; and many of the regions that were matched benign from prostate cancer cases may have had PIN admixed. The prostates from organ donors are from younger men, who likely had little, if any, PIN in their prostates. Because PIN had high levels of methylation in the LCM analyses, we hypothesize that the minimal levels of methylation seen in the benign tissue from cases with prostate cancer compared with from organ donor prostates is due, in part, to contamination with PIN. In our analyses of BPH samples, BPH was less hypermethylated than cancer, but still more methylated than in benign from organ donor prostates and more methylated than most benign from prostate cancer cases. BPH is not considered to be a precursor to prostate cancer development; however, there is still a proliferative component to this disorder, and at times regions of atypical adenomatous hyperplasia/adenosis, which is thought to be a precursor to low-grade transition zone cancers, are present in BPH. The antiproliferative roles of LTF may be inhibitory to the proliferation seen in BPH, PIN, and cancer, if not silenced. The consistency of hypermethylation in cancer across cases supports the hypothesis that silencing of LTF may be essential to prostate cancer initiation. Furthermore, given the similar pattern of methylation in PIN and cancer in our study, we propose that this is further evidence that PIN and cancer share at least some highly similar somatic epigenetic alterations. This is also analogous to the methylation and silencing of the GSTP1 gene observed in prostate cancer.14, 42
A discrepancy between LTF mRNA and LTF protein expression in the prostate was also discovered. Positive staining of atrophy with the LTF RISH probe as well as positive control staining with peptidylprolyl isomerase B markedly decreases the possibility of false-negative staining with the LTF probe for LTF mRNA present in the samples or that lack of staining is due to mRNA degradation, respectively. This leads to the conclusion that there are many cells and regions that have LTF protein, but not mRNA. Although mRNA is a necessary material in making protein, there are still several possible explanations for this; and several studies have shown poor correlation between mRNA and protein quantities.43 It is possible that the mRNA has been degraded not because of tissue age or quality, but that the LTF mRNA itself is targeted for degradation, or simply has a shorter half-life in the cell than the protein. Also, LTF is a secreted protein. Cells that are positive for LTF mRNA may be producing and secreting LTF that is then taken up by cells that are negative for LTF mRNA but positive for protein. LTF is known to be present in prostatic fluid samples44 as well as secretions from multiple epithelial organs.45, 46 Although the staining for the canonical LTF receptor ITLN-1/2 did not demonstrate that ITLN-1/2 is present in the cells that were positive for LTF protein (but not mRNA), this only eliminates the possibility of ITLN-1/2–mediated endocytosis. LTF is also able to bind to receptors other than ITLN-1/2.36, 47, 48, 49 Legrand et al50 found that LTF could bind to nucleolin and be endocytosed via vesicles in the recycling/degradation pathway. Perhaps LTF is internalized via another receptor. Florian et al51 showed that inhibition of clathrin-dependent endocytosis largely, but not completely, blocked LTF uptake into cells. Therefore, LTF may be endocytosed by non–receptor-mediated means. LTF uptake by tumor cells may be due to its role as an iron transporter, as iron is required by cancer cells for proliferation.52 This requirement for extracellular uptake of LTF may be separate from the antitumor function of cellular expression and production of LTF within the cell.
Of interest, although the amount of LTF mRNA in benign normal-appearing (not atrophy, noninflamed) regions was extremely low, benign regions displayed more LTF mRNA than primary or metastatic cancer. LTF protein and mRNA expression varied widely between metastatic sites, but when sections are examined closely, positive cells are generally not cancer cells, but rather immune cells, likely from the metastatic site itself or from immune cells that have infiltrated the metastatic site via the circulation. LTF expression appears to be down-regulated in cancer areas, likely due to CpG island methylation.
In conclusion, we have herein demonstrated that LTF—a gene canonically known as an innate immune effector molecule—is likely silenced via CpG island methylation in both primary and metastatic prostate cancer. Although methylation of genes is variable between patients, genes that are methylated in multiple patients are enriched for cancer and development/differentiation-related pathways.53 The frequency at which the LTF CpG island is methylated across samples indicates that it is an important and conserved step in prostate cancer initiation. We, therefore, propose that LTF may be considered as a tumor suppressor gene in prostate cancer.
Acknowledgments
We thank Lillian Dasko-Vincent, (Cell Imaging Core Facility, Sidney Kimmel Comprehensive Cancer Center) for assistance with LCM, and Jessica Hicks for assistance with immunohistochemistry.
Footnotes
Supported by the Department of Defense Prostate Cancer Research Program (PCRP) awards W81XWH-14-1-0364 (K.S.S.), W81XWH-18-2-0013 and W81XWH-18-2-0015 (K.S.S. and A.M.D.); the Prostate Cancer Biorepository Network; and NIH/National Cancer Institute grants P30CA006973 (K.S.S., A.M.D., and S.Y.), P50CA058236 (K.S.S., A.M.D., S.Y.), and U01CA196390 (K.S.S., A.M.D., S.Y.).
Disclosures: None declared.
Current address of I.K., Department of Pathology, Koç University School of Medicine, Istanbul, Turkey; of J.A.B-D.V., Department of Pathology and Laboratory Medicine, Fundacion Santa Fe de Bogota University Hospital, Bogota, Colombia.
Supplemental material for this article can be found at http://doi.org/10.1016/j.ajpath.2019.07.016.
Supplemental Data
Supplemental Figure S1.

Location of all assays in relation to the lactoferrin (LTF) gene structure. A: Targeted location of primers, RNA in situ hybridization probes, and antibody (Ab). B: Location of primers used for combination of methylated-DNA precipitation and methylation-sensitive restriction enzymes (COMPARE-MS) and bisulfite sequencing. bPCR, bisulfite PCR; UTR, untranslated region.
Supplemental Figure S2.

Lactoferrin (LTF) antibody, immunohistochemistry (IHC) assay, and RNA in situ hybridization (RISH) assay validation with positive and negative controls. Top panel: The Abcam lactoferrin antibody produces one band at the correct size by Western blot analysis using prostate tissue lysates, whole blood cell (WBC) lysate (positive control), and recombinant LTF (positive control). The lactoferrin antibody does not cross-react with transferrin (negative control). Middle and bottom panels: Positive and negative controls for lactoferrin IHC assay using formalin-fixed, paraffin-embedded cell plugs of PC3 cells (negative for lactoferrin, negative control) transfected with both known forms of lactoferrin [soluble lactoferrin (sLTF) and ΔLTF; positive controls]. Original magnification, ×200.
Supplemental Figure S3.
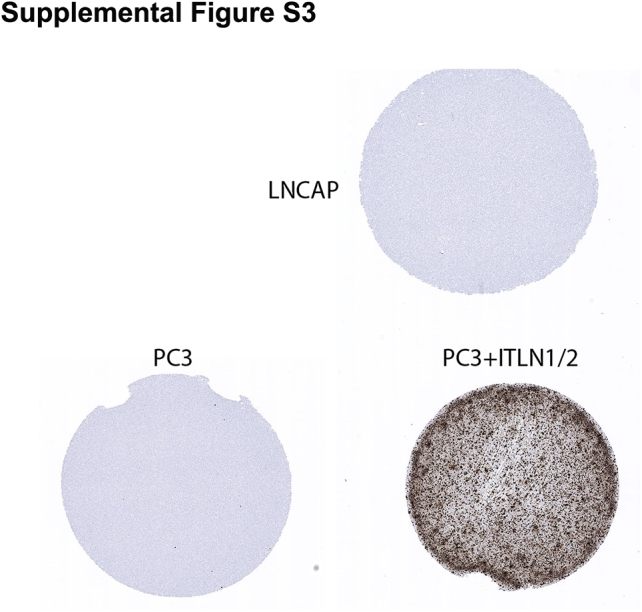
Intelectin-1/2 ITLN1/2) RNA in situ hybridization (RISH) assay validation with positive and negative controls. PC3 and LNCAP cells are negative for ITLN1/2 by RISH (negative controls). PC3 cells transfected with an ITLN1/2 expression vector (PC3 + ITLN1/2) are positive for ITLN1/2 by RISH (positive control). Original magnification, ×200.
Supplemental Figure S4.

Example of laser-capture microdissection (LCM) for prostate epithelium. Example given is of prostate glands before LCM and where epithelium has been specifically targeted and removed by LCM (after LCM). Original magnification, ×200.
Supplemental Figure S5.

Example of image analysis for lactoferrin (LTF) immunohistochemistry (IHC). Light blue lines indicate the annotated regions included in the image analysis. These were identical to the regions where laser-capture microdissection (LCM) was performed. Dark blue lines indicate regions excluded from image analysis (eg, glandular lumens). Orange, yellow, and blue pixels demonstrate a gland where image analysis has been performed and the positive regions (orange and yellow pixels) and negative regions (blue pixels) for lactoferrin have been determined. Original magnification, ×200.
Supplemental Figure S6.

Immunohistochemistry (IHC) with two separate lactoferrin (LTF) antibodies (Abcam EPR4338 and Sigma L3262) demonstrates an identical staining pattern for lactoferrin protein in areas that were negative for LTF RNA by RNA in situ hybridization (RISH) [peptidylprolyl isomerase B (PPIB) included as a positive control for RNA integrity for RISH]. Original magnification, ×200.
Supplemental Figure S7.

Positive staining, as assessed by immunohistochemistry (IHC), plotted against positive staining, as assessed by RNA in situ hybridization (RISH), in normal, atrophy, prostatic intraepithelial neoplasia, cancer, and distant metastases.
Supplemental Figure S8.

A: Assessment of lactoferrin (LTF) immunohistochemistry (IHC) and RNA in situ hybridization (RISH) in relation to tumor grade. B: Assessment of LTF IHC and RISH in relation to patient race, African American (AA) or European American (EA). *P < 0.05, **P < 0.005, and ****P < 0.0001. PIN, prostatic intraepithelial neoplasia.
Supplemental Figure S9.

Example of lactoferrin (LTF) immunohistochemistry (IHC) in a liver metastasis. Brown staining cells appear to be infiltrating immune cells positive for lactoferrin, whereas the tumor cells are negative for lactoferrin, as indicated in the figure. Original magnification, ×200.
References
- 1.Sfanos K.S., De Marzo A.M. Prostate cancer and inflammation: the evidence. Histopathology. 2012;60:199–215. doi: 10.1111/j.1365-2559.2011.04033.x. [DOI] [PMC free article] [PubMed] [Google Scholar]
- 2.De Marzo A.M., Platz E.A., Sutcliffe S., Xu J., Gronberg H., Drake C.G., Nakai Y., Isaacs W.B., Nelson W.G. Inflammation in prostate carcinogenesis. Nat Rev Cancer. 2007;7:256–269. doi: 10.1038/nrc2090. [DOI] [PMC free article] [PubMed] [Google Scholar]
- 3.Nelson W.G., De Marzo A.M., DeWeese T.L., Isaacs W.B. The role of inflammation in the pathogenesis of prostate cancer. J Urol. 2004;172:S6–S12. doi: 10.1097/01.ju.0000142058.99614.ff. [DOI] [PubMed] [Google Scholar]
- 4.Sfanos K.S., Wilson B.A., De Marzo A.M., Isaacs W.B. Acute inflammatory proteins constitute the organic matrix of prostatic corpora amylacea and calculi in men with prostate cancer. Proc Natl Acad Sci. 2009;106:3443–3448. doi: 10.1073/pnas.0810473106. [DOI] [PMC free article] [PubMed] [Google Scholar]
- 5.Brock J.H. The physiology of lactoferrin. Biochem Cell Biol. 2002;80:1–6. doi: 10.1139/o01-212. [DOI] [PubMed] [Google Scholar]
- 6.Gonzalez-Chavez S.A., Arevalo-Gallegos S., Rascon-Cruz Q. Lactoferrin: structure, function and applications. Int J Antimicrob Agents. 2009;33:301.e1–301.e8. doi: 10.1016/j.ijantimicag.2008.07.020. [DOI] [PubMed] [Google Scholar]
- 7.Legrand D., Pierce A., Elass E., Carpentier M., Mariller C., Mazurier J. Lactoferrin structure and functions. In: Bösze Z., editor. Bioactive Components of Milk. Springer New York; New York, NY: 2008. pp. 163–194. [Google Scholar]
- 8.Legrand D. Overview of lactoferrin as a natural immune modulator. J Pediatr. 2016;173(Suppl):S10–S15. doi: 10.1016/j.jpeds.2016.02.071. [DOI] [PubMed] [Google Scholar]
- 9.Kruzel M.L., Zimecki M., Actor J.K. Lactoferrin in a context of inflammation-induced pathology. Front Immunol. 2017;8:1438. doi: 10.3389/fimmu.2017.01438. [DOI] [PMC free article] [PubMed] [Google Scholar]
- 10.Legrand D. Lactoferrin, a key molecule in immune and inflammatory processes. Biochem Cell Biol. 2012;90:252–268. doi: 10.1139/o11-056. [DOI] [PubMed] [Google Scholar]
- 11.Francis N., Wong S.H., Hampson P., Wang K., Young S.P., Deigner H.P., Salmon M., Scheel-Toellner D., Lord J.M. Lactoferrin inhibits neutrophil apoptosis via blockade of proximal apoptotic signaling events. Biochim Biophys Acta. 2011;1813:1822–1826. doi: 10.1016/j.bbamcr.2011.07.004. [DOI] [PubMed] [Google Scholar]
- 12.Reese J.H., McNeal J.E., Goldenberg S.L., Redwine E.A., Sellers R.G. Distribution of lactoferrin in the normal and inflamed human prostate: an immunohistochemical study. Prostate. 1992;20:73–85. doi: 10.1002/pros.2990200109. [DOI] [PubMed] [Google Scholar]
- 13.De Marzo A.M., Marchi V.L., Epstein J.I., Nelson W.G. Proliferative inflammatory atrophy of the prostate: implications for prostatic carcinogenesis. Am J Pathol. 1999;155:1985–1992. doi: 10.1016/S0002-9440(10)65517-4. [DOI] [PMC free article] [PubMed] [Google Scholar]
- 14.Nakayama M., Bennett C.J., Hicks J.L., Epstein J.I., Platz E.A., Nelson W.G., De Marzo A.M. Hypermethylation of the human glutathione S-transferase-π gene (GSTP1) CpG island is present in a subset of proliferative inflammatory atrophy lesions but not in normal or hyperplastic epithelium of the prostate: a detailed study using laser-capture microdissection. Am J Pathol. 2003;163:923–933. doi: 10.1016/s0002-9440(10)63452-9. [DOI] [PMC free article] [PubMed] [Google Scholar]
- 15.Yegnasubramanian S., Kowalski J., Gonzalgo M.L., Zahurak M., Piantadosi S., Walsh P.C., Bova G.S., De Marzo A.M., Isaacs W.B., Nelson W.G. Hypermethylation of CpG islands in primary and metastatic human prostate cancer. Cancer Res. 2004;64:1975–1986. doi: 10.1158/0008-5472.can-03-3972. [DOI] [PubMed] [Google Scholar]
- 16.Deng M., Zhang W., Tang H., Ye Q., Liao Q., Zhou Y., Wu M., Xiong W., Zheng Y., Guo X., Qin Z., He W., Zhou M., Xiang J., Li X., Ma J., Li G. Lactotransferrin acts as a tumor suppressor in nasopharyngeal carcinoma by repressing AKT through multiple mechanisms. Oncogene. 2013;32:4273–4283. doi: 10.1038/onc.2012.434. [DOI] [PubMed] [Google Scholar]
- 17.Chea C., Miyauchi M., Inubushi T., Febriyanti Ayuningtyas N., Subarnbhesaj A., Nguyen P.T., Shrestha M., Haing S., Ohta K., Takata T. Molecular mechanism of inhibitory effects of bovine lactoferrin on the growth of oral squamous cell carcinoma. PLoS One. 2018;13:e0191683. doi: 10.1371/journal.pone.0191683. [DOI] [PMC free article] [PubMed] [Google Scholar]
- 18.Teng C., Gladwell W., Raphiou I., Liu E. Methylation and expression of the lactoferrin gene in human tissues and cancer cells. Biometals. 2004;17:317–323. doi: 10.1023/b:biom.0000027711.13818.8a. [DOI] [PubMed] [Google Scholar]
- 19.Shaheduzzaman S., Vishwanath A., Furusato B., Cullen J., Chen Y., Bañez L., Nau M., Ravindranath L., Kim K.H., Mohammed A., Chen Y., Ehrich M., Srikantan V., Sesterhenn I.A., McLeod D., Vahey M., Petrovics G., Dobi A., Srivastava S. Silencing of lactotransferrin expression by methylation in prostate cancer progression. Cancer Biol Ther. 2007;6:1088–1095. doi: 10.4161/cbt.6.7.4327. [DOI] [PubMed] [Google Scholar]
- 20.Iijima H., Tomizawa Y., Iwasaki Y., Sato K., Sunaga N., Dobashi K., Saito R., Nakajima T., Minna J.D., Mori M. Genetic and epigenetic inactivation of LTF gene at 3p21.3 in lung cancers. Int J Cancer. 2006;118:797–801. doi: 10.1002/ijc.21462. [DOI] [PubMed] [Google Scholar]
- 21.Yi H.M., Li Y.C., Zhong R.H. [Expression, genetic and epigenetic alterations of LTF gene in nasopharyngeal carcinoma cell lines] Zhonghua Zhong Liu Za Zhi. 2010;32:729–733. [PubMed] [Google Scholar]
- 22.Liu L.H., Gladwell W., Teng C.T. Detection of exon polymorphisms in the human lactoferrin gene. Biochem Cell Biol. 2002;80:17–22. doi: 10.1139/o01-207. [DOI] [PubMed] [Google Scholar]
- 23.Penco S., Caligo M.A., Cipollini G., Bevilacqua G., Garré C. Lactoferrin expression in human breast cancer. Cancer Biochem Biophys. 1999;17:163–178. [PubMed] [Google Scholar]
- 24.Damiens E., El Yazidi I., Mazurier J., Duthille I., Spik G., Boilly-Marer Y. Lactoferrin inhibits G1 cyclin-dependent kinases during growth arrest of human breast carcinoma cells. J Cell Biochem. 1999;74:486–498. [PubMed] [Google Scholar]
- 25.Xiao Y., Monitto C.L., Minhas K.M., Sidransky D. Lactoferrin down-regulates G1 cyclin-dependent kinases during growth arrest of head and neck cancer cells. Clin Cancer Res. 2004;10:8683–8686. doi: 10.1158/1078-0432.CCR-04-0988. [DOI] [PubMed] [Google Scholar]
- 26.Tsuda H., Sekine K., Ushida Y., Kuhara T., Takasuka N., Iigo M., Han B.S., Moore M.A. Milk and dairy products in cancer prevention: focus on bovine lactoferrin. Mutat Res. 2000;462:227–233. doi: 10.1016/s1383-5742(00)00040-5. [DOI] [PubMed] [Google Scholar]
- 27.Tsuda H., Sekine K., Takasuka N., Toriyama-Baba H., Iigo M. Prevention of colon carcinogenesis and carcinoma metastasis by orally administered bovine lactoferrin in animals. Biofactors. 2000;12:83–88. doi: 10.1002/biof.5520120113. [DOI] [PubMed] [Google Scholar]
- 28.Ushida Y., Sekine K., Kuhara T., Takasuka N., Iigo M., Tsuda H. Inhibitory effects of bovine lactoferrin on intestinal polyposis in the Apc(Min) mouse. Cancer Lett. 1998;134:141–145. doi: 10.1016/s0304-3835(98)00249-3. [DOI] [PubMed] [Google Scholar]
- 29.Yegnasubramanian S., Wu Z., Haffner M.C., Esopi D., Aryee M.J., Badrinath R., He T.L., Morgan J.D., Carvalho B., Zheng Q., De Marzo A.M., Irizarry R.A., Nelson W.G. Chromosome-wide mapping of DNA methylation patterns in normal and malignant prostate cells reveals pervasive methylation of gene-associated and conserved intergenic sequences. BMC Genomics. 2011;12:313. doi: 10.1186/1471-2164-12-313. [DOI] [PMC free article] [PubMed] [Google Scholar]
- 30.Yegnasubramanian S., Lin X., Haffner M.C., DeMarzo A.M., Nelson W.G. Combination of methylated-DNA precipitation and methylation-sensitive restriction enzymes (COMPARE-MS) for the rapid, sensitive and quantitative detection of DNA methylation. Nucleic Acids Res. 2006;34:e19. doi: 10.1093/nar/gnj022. [DOI] [PMC free article] [PubMed] [Google Scholar]
- 31.Mottahedeh J., Haffner M.C., Grogan T.R., Hashimoto T., Crowell P.D., Beltran H., Sboner A., Bareja R., Esopi D., Isaacs W.B., Yegnasubramanian S., Rettig M.B., Elashoff D.A., Platz E.A., De Marzo A.M., Teitell M.A., Goldstein A.S. CD38 is methylated in prostate cancer and regulates extracellular NAD. Cancer Metab. 2018;6:13. doi: 10.1186/s40170-018-0186-3. [DOI] [PMC free article] [PubMed] [Google Scholar]
- 32.Cancer Genome Atlas Research Network The molecular taxonomy of primary prostate cancer. Cell. 2015;163:1011–1025. doi: 10.1016/j.cell.2015.10.025. [DOI] [PMC free article] [PubMed] [Google Scholar]
- 33.Gao J., Aksoy B.A., Dogrusoz U., Dresdner G., Gross B., Sumer S.O., Sun Y., Jacobsen A., Sinha R., Larsson E., Cerami E., Sander C., Schultz N. Integrative analysis of complex cancer genomics and clinical profiles using the cBioPortal. Sci Signal. 2013;6:pl1. doi: 10.1126/scisignal.2004088. [DOI] [PMC free article] [PubMed] [Google Scholar]
- 34.De Marzo A.M., Haffner M.C., Lotan T.L., Yegnasubramanian S., Nelson W.G. Premalignancy in prostate cancer: rethinking what we know. Cancer Prev Res. 2016;9:648–656. doi: 10.1158/1940-6207.CAPR-15-0431. [DOI] [PubMed] [Google Scholar]
- 35.Akiyama Y., Oshima K., Kuhara T., Shin K., Abe F., Iwatsuki K., Nadano D., Matsuda T. A lactoferrin-receptor, intelectin 1, affects uptake, sub-cellular localization and release of immunochemically detectable lactoferrin by intestinal epithelial Caco-2 cells. J Biochem. 2013;154:437–448. doi: 10.1093/jb/mvt073. [DOI] [PubMed] [Google Scholar]
- 36.Suzuki Y.A., Lopez V., Lonnerdal B. Mammalian lactoferrin receptors: structure and function. Cell Mol Life Sci. 2005;62:2560–2575. doi: 10.1007/s00018-005-5371-1. [DOI] [PMC free article] [PubMed] [Google Scholar]
- 37.van Leenders G.J., Gage W.R., Hicks J.L., van Balken B., Aalders T.W., Schalken J.A., De Marzo A.M. Intermediate cells in human prostate epithelium are enriched in proliferative inflammatory atrophy. Am J Pathol. 2003;162:1529–1537. doi: 10.1016/S0002-9440(10)64286-1. [DOI] [PMC free article] [PubMed] [Google Scholar]
- 38.Iigo M., Alexander D.B., Long N., Xu J., Fukamachi K., Futakuchi M., Takase M., Tsuda H. Anticarcinogenesis pathways activated by bovine lactoferrin in the murine small intestine. Biochimie. 2009;91:86–101. doi: 10.1016/j.biochi.2008.06.012. [DOI] [PubMed] [Google Scholar]
- 39.Zimecki M., Mazurier J., Spik G., Kapp J.A. Lactoferrin inhibits proliferative response and cytokine production of TH1 but not TH2 cell lines. Arch Immunol Ther Exp (Warsz) 1996;44:51–56. [PubMed] [Google Scholar]
- 40.Ye Q., Zheng Y., Fan S., Qin Z., Li N., Tang A., Ai F., Zhang X., Bian Y., Dang W., Huang J., Zhou M., Zhou Y., Xiong W., Yan Q., Ma J., Li G. Lactoferrin deficiency promotes colitis-associated colorectal dysplasia in mice. PLoS One. 2014;9:e103298. doi: 10.1371/journal.pone.0103298. [DOI] [PMC free article] [PubMed] [Google Scholar]
- 41.Berlutti F., Schippa S., Morea C., Sarli S., Perfetto B., Donnarumma G., Valenti P. Lactoferrin downregulates pro-inflammatory cytokines upexpressed in intestinal epithelial cells infected with invasive or noninvasive Escherichia coli strains. Biochem Cell Biol. 2006;84:351–357. doi: 10.1139/o06-039. [DOI] [PubMed] [Google Scholar]
- 42.Brooks J.D., Weinstein M., Lin X., Sun Y., Pin S.S., Bova G.S., Epstein J.I., Isaacs W.B., Nelson W.G. CG island methylation changes near the GSTP1 gene in prostatic intraepithelial neoplasia. Cancer Epidemiol Biomarkers Prev. 1998;7:531–536. [PubMed] [Google Scholar]
- 43.Maier T., Güell M., Serrano L. Correlation of mRNA and protein in complex biological samples. FEBS Lett. 2009;583:3966–3973. doi: 10.1016/j.febslet.2009.10.036. [DOI] [PubMed] [Google Scholar]
- 44.Manning M.L., Williams S.A., Jelinek C.A., Kostova M.B., Denmeade S.R. Proteolysis of complement factors iC3b and C5 by the serine protease prostate-specific antigen in prostatic fluid and seminal plasma. J Immunol. 2013;190:2567–2574. doi: 10.4049/jimmunol.1200856. [DOI] [PMC free article] [PubMed] [Google Scholar]
- 45.Mason D.Y., Taylor C.R. Distribution of transferrin, ferritin, and lactoferrin in human tissues. J Clin Pathol. 1978;31:316–327. doi: 10.1136/jcp.31.4.316. [DOI] [PMC free article] [PubMed] [Google Scholar]
- 46.Masson P.L., Heremans J.F., Schonne E. Lactoferrin, an iron-binding protein in neutrophilic leukocytes. J Exp Med. 1969;130:643–658. doi: 10.1084/jem.130.3.643. [DOI] [PMC free article] [PubMed] [Google Scholar]
- 47.Takayama Y., Takahashi H., Mizumachi K., Takezawa T. Low density lipoprotein receptor-related protein (LRP) is required for lactoferrin-enhanced collagen gel contractile activity of human fibroblasts. J Biol Chem. 2003;278:22112–22118. doi: 10.1074/jbc.M300894200. [DOI] [PubMed] [Google Scholar]
- 48.Rawat P., Kumar S., Sheokand N., Raje C.I., Raje M. The multifunctional glycolytic protein glyceraldehyde-3-phosphate dehydrogenase (GAPDH) is a novel macrophage lactoferrin receptor. Biochem Cell Biol. 2012;90:329–338. doi: 10.1139/o11-058. [DOI] [PubMed] [Google Scholar]
- 49.Qiu Z., Strickland D.K., Hyman B.T., Rebeck G.W. α2-Macroglobulin enhances the clearance of endogenous soluble β-amyloid peptide via low-density lipoprotein receptor-related protein in cortical neuron. J Neurochem. 2002;73:1393–1398. doi: 10.1046/j.1471-4159.1999.0731393.x. [DOI] [PubMed] [Google Scholar]
- 50.Legrand D., Vigié K., Said E.A., Elass E., Masson M., Slomianny M.-C., Carpentier M., Briand J.-P., Mazurier J., Hovanessian A.G. Surface nucleolin participates in both the binding and endocytosis of lactoferrin in target cells. Eur J Biochem. 2003;271:303–317. doi: 10.1046/j.1432-1033.2003.03929.x. [DOI] [PubMed] [Google Scholar]
- 51.Florian P., Macovei A., Sima L., Nichita N., Mattsby-Baltzer I., Roseanu A. Endocytosis and trafficking of human lactoferrin in macrophage-like human THP-1 cells. Biochem Cell Biol. 2012;90:449–455. doi: 10.1139/o11-090. [DOI] [PubMed] [Google Scholar]
- 52.Pfeifhofer-Obermair C., Tymoszuk P., Petzer V., Weiss G., Nairz M. Iron in the tumor microenvironment—connecting the dots. Front Oncol. 2018;8:549. doi: 10.3389/fonc.2018.00549. [DOI] [PMC free article] [PubMed] [Google Scholar]
- 53.Aryee M.J., Liu W., Engelmann J.C., Nuhn P., Gurel M., Haffner M.C., Esopi D., Irizarry R.A., Getzenberg R.H., Nelson W.G., Luo J., Xu J., Isaacs W.B., Bova G.S., Yegnasubramanian S. DNA methylation alterations exhibit intraindividual stability and interindividual heterogeneity in prostate cancer metastases. Sci Transl Med. 2013;5:169ra10. doi: 10.1126/scitranslmed.3005211. [DOI] [PMC free article] [PubMed] [Google Scholar]