

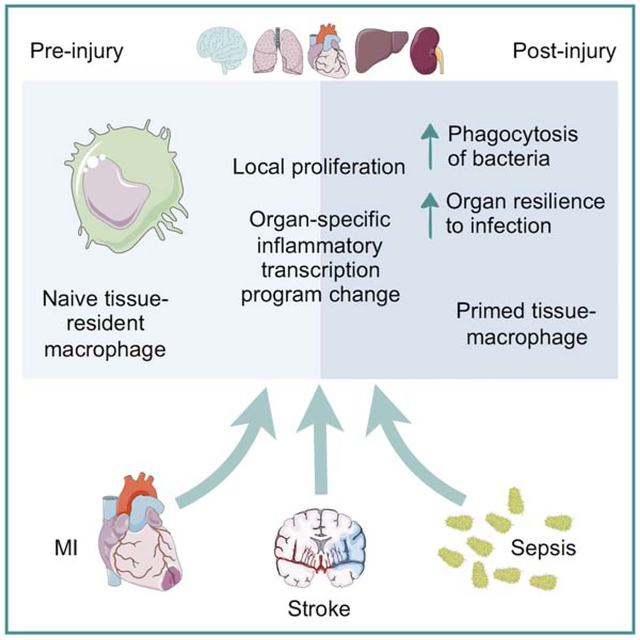
SUMMARY
Myocardial infarction, stroke and sepsis trigger systemic inflammation and organism-wide complications that are difficult to manage. Here we examined the contribution of macrophages residing in vital organs to the systemic response after these injuries. We generated a comprehensive catalog of changes in macrophage number, origin and gene expression in the heart, brain, liver, kidney and lung of mice with myocardial infarction, stroke or sepsis. Predominantly fueled by heightened local proliferation, tissue macrophage numbers increased systemically. Macrophages in the same organ responded similarly to different injuries by altering expression of tissue-specific gene sets. Preceding myocardial infarction improved survival of subsequent pneumonia due to enhanced bacterial clearance, which was caused by IFNɣ priming of alveolar macrophages. Conversely, EGF receptor signaling in macrophages exacerbated inflammatory lung injury. Our data suggest that local injury activates macrophages in remote organs, and that targeting macrophages could improve resilience against systemic complications following myocardial infarction, stroke and sepsis.
ETOC blurb
Hoyer, Maxerova et al. generate a comprehensive catalog of changes in macrophage number, origin and gene expression in the heart, brain, liver, kidney and lung of mice with myocardial infarction, stroke or sepsis. They find that local injury activates macrophages in remote organs and that these adaptations were damaging or protective in different settings.
Graphical Abstract
INTRODUCTION
Systemic, organism-wide inflammation can be a consequence of various severe illnesses. Sepsis is a prototypical example of a dysbalanced systemic inflammatory state and affects multiple organ systems. Commonly triggered by bacterial infection, a cytokine storm results from Toll-like receptor activation, overstimulates innate immune cells and is followed by immune paralysis (Rittirsch et al., 2008). The overzealous immune response may damage vital organs with serious sequelae. For instance, compromised liver function promotes bleeding due to insufficient production of coagulation factors, and low cardiac output contributes to septic shock. Patients with multi-organ failure have a grave prognosis (Yasumoto et al., 1994), and treatment options are limited to antibiotics and supportive intensive care.
Analogously to sepsis, myocardial infarction (MI) and stroke trigger systemic inflammation that could be involved in secondary complications. Both ischemic injuries are consequences of atherosclerosis, during which hyperlipidemia and inflammation of the vascular wall compromise the endothelial layer, activating the clotting system within the arterial lumen. Plaque rupture or erosion in a coronary artery arrests myocardial blood flow and triggers necrosis of heart muscle. Patients may develop heart failure, which associates with renal failure, electrolyte imbalances, lung edema and nosocomial pneumonia (Truffa et al., 2012). Atherosclerosis in the carotid artery may give rise to thrombotic emboli that disrupt perfusion of brain tissue, leading to ischemic necrosis in the central nervous system and various neurological deficits. Stroke-induced immunosuppression (Dirnagl et al., 2007) and immobility give rise to pneumonia, a typical complication of stroke (Langhorne et al., 2000).
Survival and long-term outcomes in patients with MI and stroke have improved in recent years, mainly due to reperfusion therapy in the first hours after onset of ischemia (Nabel and Braunwald, 2012). However, clinical management of systemic complications that accompany ischemia remains a critical challenge (McNamara et al., 2016). In this regard, systemic consequences of local ischemic damage can be compared to the effects of a truly systemic injury like sepsis (Alp et al., 2004; Case et al., 2013). It is therefore of significant clinical interest to examine tissue defenses and vulnerabilities in these conditions, and identify biological pathways that affect organs after ischemia or during sepsis. Therapeutic tools to manage a dysregulated immune system in the wake of these disorders could emerge from such efforts.
Increasingly, we understand how MI and stroke elicit global inflammation, with emerging parallels to sepsis. Not only sepsis, but also MI and stroke broadly impact the immune system and hematopoiesis. All three conditions trigger emergency hematopoiesis leading to accelerated innate immune cell production and profound changes in the differential blood count (Takizawa et al., 2012; Swirski and Nahrendorf, 2018). After bacterial infection, Toll-like receptor ligands activate hematopoietic stem and progenitor cells, lymphocytes and myeloid cells (Takizawa et al., 2012). After MI and stroke, heightened myelopoiesis increases numbers of neutrophils and inflammatory monocytes (Dutta et al., 2012). In all three conditions, systemically circulating danger-associated molecular patterns, inflammatory cytokines and growth factors activate innate immune cells (Takizawa et al., 2012; Swirski and Nahrendorf, 2018). The global inflammatory events and the systemic pathways that affect circulating immune cells after sepsis, MI or stroke likely also influence tissue-resident immune cells systems-wide, either bolstering or compromising the resilience of vital organs via local interactions.
Now recognized as residents of all major organs (Davies et al., 2013), macrophages are among the first responders to local damage. Their involvement in modulating organ response to remote damage is less well understood. However, they likely play important roles, as they are the most abundant immune cell in many tissues and are responsible for regulating organ-level immunity in the steady state (Davies et al., 2013). Macrophages sense circulating danger signals, including ligands of pattern recognition receptors such as DNA, RNA or bacterial lipopolysaccharide (Medzhitov, 2001), hormones, neurotransmitters, and cytokines that prime or activate them such as IFNɣ or IL-4 (Glass and Natoli, 2016), information transfer systems that are active in sepsis (Rittirsch et al., 2008) and after ischemic injury (Swirski and Nahrendorf, 2018). Depending on their phenotype, macrophages may be protective or harmful. For instance, during lung infection, alveolar macrophages have an important beneficial function by removing invading pathogens (Hussell and Bell, 2014). A counterexample is atherosclerosis, where monocyte-derived plaque macrophages inflict tissue damage in the vascular wall, leading to MI (Swirski and Nahrendorf, 2018). Of note, an observation recently termed “trained immunity” indicates that a variety of stimuli may lead to epigenetic reprogramming of macrophages, resulting in either enhanced or muted inflammatory cytokine production after a secondary challenge (Netea et al., 2016). If maladaptive, this process can cause hyperinflammation or immune paralysis (Netea et al., 2016). First described in monocyte-derived macrophages, this concept is currently expanding to hematopoietic progenitors (Netea et al., 2016). Whether it also applies to tissue-resident macrophages is not known, but global inflammatory events may shape the phenotype of macrophages and their subsequent function in maintaining organ homeostasis through similar mechanisms.
Tissue-resident macrophages that multiply independently of definite hematopoiesis are generally less inflammatory than monocyte-derived cells originating in the bone marrow (Lavin et al., 2015). Macrophage population growth, which propels tissue inflammation, may rely on both, monocyte recruitment and local proliferation (Swirski and Nahrendorf, 2018). In steady state, resident macrophage phenotypes are dictated by their tissue environment (Lavin et al., 2015). It is currently unknown whether systemic inflammation triggered by sepsis, MI and stroke can change the molecular profiles of tissue-resident macrophages. Some resident macrophages pursue critical organ-specific functions and participate in iron recycling (Haldar et al., 2014), metabolism (Odegaard et al., 2007), synaptic information transfer (Paolicelli et al., 2011) or cardiac conduction (Hulsmans et al., 2017), tasks subject to compromise if the cells change their phenotype or are replaced by inflammatory monocyte-derived macrophages.
We hypothesized that local ischemia causes remote tissue responses relayed by macrophages and comprehensively profiled macrophages in mice with MI, stroke or sepsis induced by cecal ligation and puncture (CLP). The resulting data enabled systematic comparison of changes in macrophage numbers, origins and whole transcriptome expression profiles across 5 organs and 3 injuries. Our data document a macrophage response in most tissues, even if the injury is at a distance from the organ the cells inhabit. Macrophages in the heart, lung, liver and kidney increased in number and altered their molecular phenotypes after MI, stroke and CLP, adaptations that influenced organ homeostasis and consequently host survival.
RESULTS
Macrophage abundance in tissues changes after remote injury or infection
We first investigated the abundance of macrophages after CLP in all organs, and during stroke and MI in uninjured distant organs. We then compared these data to the steady state in each organ, using flow cytometry gating described previously (Gautier et al., 2012). Initial gates included all subsets irrespective of origin to assay net changes arising from all macrophage types (Figure S1 and Table S1). Macrophage numbers increased significantly after all injuries and in most sites examined. The amplitude and direction of the change varied depending on the injury type, tissue context and time (Figure 1).
Figure 1. Macrophage numbers fluctuate in distant sites after MI, stroke and CLP.

(A) Alveolar macrophages, control n=19–34, MI n=4–16, stroke n=8–13, CLP n=5–10. (B) Lung macrophages at baseline and d4 after MI. Scale bar, 50 μm. (C) Heart macrophages after stroke and CLP. Control n=18–20, stroke n=8–13, CLP n=5–6. (D) Histology of heart macrophages at baseline and d4 after CLP. (E) Liver macrophages after CLP (KC, Kupffer cells), MI and stroke. Control n=16–32, MI n=4–12, stroke n=5–13, CLP n=5–6. (F) Liver macrophages around central veins (CV) at baseline and day 4 after MI. (G) Renal macrophages. Control n=16–34, MI n=4–16, stroke n=4–13, CLP n=5–9. (H) Renal macrophages at baseline and after MI. (I) Microglia after MI and CLP, control n=8–14, MI n=8, CLP n=8–10. (J) Summary genetic fate mapping, original data are in Figure S2. Lung refers to alveolar macrophages. Data are mean ± s.e.m. *P<0.05, **P<0.01, ***P<0.001, ****P<0.0001. Ordinary one-way ANOVA with Dunnett’s multiple comparison test was used for normally distributed data. See also Figure S1,2 and Table S1.
SIGLEC-Fhigh CD11chigh alveolar macrophages maintain and defend the organism’s interface with the environment by killing bacteria (Hashimoto et al., 2013). Alveolar macrophages were more numerous after MI and stroke (Figure 1A), while SIGLEC-Flow CD11clow interstitial macrophages (Hussell and Bell, 2014) increased after MI and CLP (Figure S2A). Histologic examination of lungs corroborated the increase in macrophage numbers (Figure 1B). Since the source of macrophages influences their phenotypes, we determined whether macrophage numbers rose through recruitment or local proliferation with genetic and parabiosis fate mapping. For genetic fate mapping, we used Cx3cr1CreER/+R26tdTomato/+ mice (Yona et al., 2013). Since alveolar macrophages do not express Cx3cr1 (Yona et al., 2013), YFP+ cells derive from monocytes. We detected no YFP+ alveolar macrophages in steady state, after MI or CLP, indicating that these cells do not rely on recruitment (Figure S2B–C). We then used parabiosis — attachment of the skin and bones of two mice to establish a joint circulation — to examine recruitment with an orthogonal method. As parabionts, we used mice that constitutively express the distinguishable cell surface markers CD45.1 or CD45.2, thus allowing us to determine whether macrophages were recruited from the joint circulation. After the CD45.2 parabiont underwent MI, we found no CD45.1 alveolar macrophages in the CD45.2 mouse, indicating that no circulating cells contribute (Figure S2D). BrdU pulse and BrdU pulse-chase experiments revealed that after MI, alveolar macrophages increased local proliferation (Figure S2E). Flow cytometry of alveolar lavage confirmed that interstitial macrophages did not enter the bronchoalveolar space on day 4 after MI (Figure S2F), while the lung recruited monocytes and neutrophils to its interstitial spaces after any injury (Figure S2G).
Cardiac macrophage numbers did not change after stroke but decreased one day post CLP and increased thereafter to supra-normal levels for 28 days (Figure 1C–D). Genetic fate mapping in Cx3cr1CreER/+R26tdTomato/+ mice indicated that the 2.5% recruitment contributing to steady state macrophages expanded after CLP to 6.2% recruitment (Figure S2H). Parabiosis experiments confirmed this increase (Figure S2I), and recruited myeloid cells were detected in the myocardium after stroke and CLP during the first week after injury (Figure S2J). Cell cycle analysis showed that CLP increased cardiac macrophage proliferation (Figure S2K). Taken together, and in contradistinction to direct ischemic cardiac injury which causes a switch to 100% recruitment (Heidt et al., 2014), CLP did not change the dominance of local proliferation for cardiac macrophage supply, as 93.8% macrophages remained locally sourced.
In the liver, Kupffer cell numbers fluctuated after MI and CLP, while no significant changes occurred after stroke (Figure 1E–F and S2L). Liver macrophages increased after MI but declined after CLP (Figure 1E). After CLP and MI, the organ recruited 9-fold and 4.2-fold more circulating monocytes, respectively (Figure S2M), and CD11bhigh transitional macrophages expanded (Figure S2N). Genetic fate mapping indicated that most macrophages arose in local tissue (Figure S2O).
Renal macrophage numbers increased after MI, stroke and CLP (Figure 1G–H). The increase occurred in both the renal medulla and the cortex (Figure 1H and S2P). Renal macrophages showed a biphasic response with a decrease shortly after CLP followed by an increase to supra-normal levels for more than 2 months (Figure 1G). Cell cycle analysis and fate mapping experiments indicated that higher macrophage presence resulted from both, increased macrophage proliferation and recruitment (Figure S2Q–V).
The number of microglia did not change after CLP or MI (Figure 1I). CD45high brain macrophages, which are distinct from microglia (Greter et al., 2015), became more numerous after CLP (Figure S2W). The brain accumulated neutrophils and monocytes after MI and CLP (Figure S2X). Genetic fate mapping indicated that microglia relied exclusively on local sources after MI or CLP (Figure S2Y). Viewed together (Figure 1J), organs increased recruitment by an average of 3.6% after MI and CLP; however, the majority of macrophages were locally derived.
Macrophage gene expression changes after remote ischemia and CLP
Considering that many complications occur in the first week after patients suffer a stroke, MI or sepsis, we next flow-sorted macrophages from organs in the steady state and on day four after injury. The cells isolated for gene expression profiling included bone-marrow derived macrophages in organs that expanded recruitment after injury. In all organs, macrophage gene expression changed in response to all injuries (Figure 2A). On average, 79 genes were differentially expressed after injury versus tissue-matched steady state control (false discovery rate [FDR] <0.1). The magnitude of the injury echo varied among organs and injuries, ranging from one (kidney macrophages after MI) to 383 genes (liver macrophages after CLP, Figure 2A and Table S2). Liver and kidney displayed the highest number of differentially expressed genes after CLP, which may reflect the extent of direct injury by circulating bacteria and the highest monocyte recruitment detected by fate mapping (Figure 1J). Analysis of functional gene sets showed that injury altered hundreds of pathways, with significant expression shifts occurring even in conditions that had few individually differentially expressed genes (Table S2). Kidney macrophages after MI, for example, exhibited significant differential expression of dozens of functional gene sets, even though the number of individual transcripts with a FDR <0.1 was small.
Figure 2. Transcriptome profiling shows a systemic macrophage response to injury.

(A) Number of differentially expressed genes (FDR<10%) in macrophages after MI, stroke or CLP. (B) Principal component analysis of all samples. (C) Log2 fold changes of the most increased probe sets (by p-value) after injury. For each injury, the top 50 probe sets were included. (D) Gene set enrichment analysis of the gene set “NEMETH_INFLAMMATORY_RESPONSE_LPS_UP” in brain microglia vs. all other organs. (E) Expression (RMA log2 signal) of IL1-β. (F) Heatmap showing log2-fold changes for the top differentially expressed unique genes (FDR<0.01 in at least one condition, n=297). The log2-fold change between every injury sample and the average across at least three tissue-matched controls is shown. (G) Odds ratios of the overlap between genes with fold change>2 after injury. All pairwise comparisons are shown. (H) as in (G) for genes with fold change < −2. See also Figure S3 and Table S2, S3.
In spite of their magnitude, injury-induced changes were relatively small in comparison with preexisting gene expression differences between macrophages residing in different organs (Gautier et al., 2012; Lavin et al., 2014). Principal component analysis of the whole data set showed that post-injury samples clustered near their organ-matched steady state controls (Figure 2B). Kidney and heart macrophages had similar gene expression profiles — which is interesting to note given their similar reaction to injury as revealed by flow cytometry (Figure 1C–G) — while microglia, liver and lung macrophages had distinctly diverging transcriptomes. Microglia had the lowest average number of differentially expressed genes after injury (Table S2), and when we examined the fold changes of the most increased probe sets after injury in all organs, we found that microglia had the lowest median (Figure 2C). These results agree with the observation that microglia numbers do not change after CLP and MI (Figure 1I). To investigate the molecular underpinnings of the relative resistance of microglia to injury-induced changes, we used gene set enrichment analysis (GSEA) to define the pathways whose expression was specifically increased or decreased in steady state microglia versus all other steady state macrophages. Out of 3670 tested gene sets in the curated C2 gene set collection of the Molecular Signatures Database, the two gene sets that were most significantly decreased in microglia were an antigen presentation and a lipopolysaccharide (LPS) response signature. In a direct comparison of steady state microglia to steady state lung, heart, kidney or liver macrophages, the LPS response signature was decreased in microglia (Figure 2D). We observed the same result for other inflammation-related signatures (Figure S3A–B). These data indicate that of all investigated tissue-resident macrophages, microglia had the lowest baseline inflammatory phenotype. One gene that illustrated this notion is Il-1β, which rose after injury in many organs (including the brain), but displayed a lower baseline expression in microglia (Figure 2E).
To better understand the most significantly injury-regulated transcripts and their functions across organs, we selected genes with a FDR <0.01 in at least one condition and plotted their log2-fold changes between post-injury samples and their tissue-matched controls across the entire data set (Figure 2F). Clustering genes by their behavior across tissues, we defined 8 gene sets that showed correlated expression (Table S3). A large group (clusters F, G and H) rose substantially in many tissues after injury. These genes participate in the acute inflammatory response such as regulation of Il-12 and Tnf production and leukocyte chemotaxis. This gene cluster also included serum amyloid A (Saa) 1, 2, and 3, acute phase reactants whose blood levels rise in response to injury (Urieli-Shoval et al., 2000). Other notable groups included genes implicated in fibrinolysis, coagulation and wound healing (cluster E), antigen processing (cluster D) and leukocyte differentiation (cluster A). Genes involved in lipid metabolism (clusters B and C) were also differentially expressed, perhaps reflecting how macrophages rewire their metabolism (Ip et al., 2017) while responding to inflammation or sensing an altered metabolic environment that may occur after severe injury in the liver and kidney.
Gene expression changes after remote injury or CLP are partially tissue-specific
We noticed that some genes appeared coordinately altered in one organ after multiple injuries (Figure 2F). To test whether genes that were differentially expressed after injury showed larger overlap within one organ than between organs, we conducted pairwise comparisons between genes that were either increased or decreased with a fold-change >2 after injury and plotted the odds ratios of the overlap. In both cases (Figure 2G–H), the odds ratios were consistently highest for within-organ comparisons, indicating that macrophages in each organ exercise similar responses to injuries as diverse as MI, stroke and CLP.
To explore this observation further, we extended the analysis shown in Figure 2F to all genes. We created “response profiles” by calculating the fold change between post-injury samples and their organ-matched steady state controls across all measured transcripts. Hierarchical clustering confirmed that response profiles separated by organ background (Figure 3A). We conclude that overall, a macrophage’s organ location is more important in determining its response to injury than the specific nature of the insult.
Figure 3. Tissue microenvironment determines the transcriptional response of macrophages to injury.

(A) Unsupervised hierarchical transcriptome-wide clustering of gene expression changes in macrophages after injury, normalized to tissue-matched steady state controls. All probe sets were used in this analysis (n=33,793). (B) Venn diagrams showing the overlap between genes with fold change > 2 after injury in each organ. Genes that are increased after all injuries are listed in full. (C) Expression (RMA log2 signal) of Ccl8. (D) Gene Ontology (GO) enrichment analysis of genes that are expressed with a fold change >2 after at least two injuries. Gene ratio is the fraction of genes in the tested set that belongs to a given GO category.
To understand the organ-specific response in more detail, we next examined, for each organ, the genes that rose (fold change >2) after all injuries (Figure 3B). Different cytokines played dominant roles in the injury response in different organs: Cxcl2 increased after all three injuries in the liver, Tnfsf9 in the kidney, Ccl8 in the heart and Ccl12 in the brain (Figure 3B and Figure S3C–E). In the lung, no genes were expressed at higher levels in all three injury conditions, mostly because of minimal overlap between the MI and CLP response. Ccl8 in cardiac macrophages is one example of organ specificity, as both its baseline and increased expression after injury were largely heart-specific, with only the kidney showing a similar trend (Figure 3C). To determine whether genes that were commonly expressed at higher levels after injury in different organs fell into different functional categories, we performed Gene Ontology (GO) enrichment analysis on all genes that had a fold change >2 after at least two injuries (corresponding to any overlapping portions of the Venn diagrams in Figure 3B). Some GO terms like “inflammatory response” and “cell chemotaxis” enriched in several organs, as expected. Microglia were the only macrophages that showed no enrichment for the “inflammatory response” gene set, potentially relating to their indolent phenotype discussed above, or alternatively the absent recruitment we observed in the brain (Figure 1I). Acute phase response gene expression rose in the liver, but also in the kidney. In lung macrophages, several members of the solute carrier family functioning in transmembrane transport were expressed at higher levels. Together, these data suggest organ-resident macrophages alter the expression of distinct sets of pro-inflammatory agents after remote injury and CLP.
After considering the organ-specific response, we next conducted GSEA to evaluate systematically which pathways and functional gene categories change most pervasively after injury across all organs. Consistent with our analyses of differentially expressed gene clusters (Figure 2F and 3D), the most commonly increased functional categories across all organs and injuries were related to the inflammatory response: TNFα and IL6 signaling and leukocyte migration (Figure 4A–B). These prototypical categories define macrophages as a cell class. Regardless of the organ they inhabit, and regardless of the insult perturbing that organ’s homeostasis, the uniting feature of macrophages’ response is activation of innate immunity and release of factors that recruit other immune cells.
Figure 4. Characterization of ubiquitous and organ- and injury-specific macrophages responses.

(A) Molecular Signatures Database Hallmark gene sets that were most frequently enriched (FDR<25%) in genes with increased expression after different injuries. (B) As in A, with gene sets from the Gene Ontology/Biological Process collection. (C) Heatmap of normalized enrichment scores (NES). The two-top scoring Gene Ontology (Biological Process) categories of each experimental condition were selected, and their NES across all data sets are displayed. Positive NES (red) indicates enrichment of a GO category in genes expressed at higher levels after injury, negative NES indicates enrichment in genes expressed at lower levels. (D) NES for the gene set GO DNA REPLICATION across all organs and injuries. (E) StringDB protein-protein association network for the top 100 genes (by p-value) that are differentially expressed in lung after MI. Colors reflect the fold change (red, increased; blue, decreased). (F) as in (E) for lung after stroke.
Proliferation-related genes increase in lung macrophages after MI.
To uncover alterations that occurred only in specific organs after specific injuries, we plotted normalized enrichment scores (a measure of enrichment significance) for the two most increased and decreased GO biological process gene sets for each organ and condition across the entire data set (Figure 4C). After stroke, a gene set for heart rate regulation enriched in cardiac macrophages, potentially pointing to a role of macrophages in rhythm disorders, given that acute stroke in patients frequently associates with cardiac arrhythmias (Kallmunzer et al., 2012), and the participation of macrophages in cardiac conduction (Hulsmans et al., 2017). A “negative regulation of IL1 production” gene set enriched in cardiac macrophages after CLP, suggesting that although macrophages acquire an inflammatory phenotype, they also activate compensatory controls to limit local inflammation, a reaction that may protect the myocardium from unbridled inflammation.
Proliferation signatures varied significantly on day 4 after injury, with some macrophage populations enhancing, and others reducing the expression of proliferation-related genes (Figure 4D). Lung macrophages after MI displayed a particularly strong proliferation signature. This was not only evident in the gene set enrichment analysis (Figure 4D). When we used StringDB to construct a protein-protein association network of the top 100 differentially expressed probe sets in the lung after MI, we found that ~40% of these genes belonged to a network of DNA replication and cell cycle genes (Figure 4E). In contrast, the same approach for lung macrophages after stroke yielded a different network which highlighted reduced expression of MHC class II members (Figure 4F), perhaps indicating that macrophages suppress adaptive immune responses after stroke. This observation may relate to pneumonia in stroke patients (Langhorne et al., 2000). Notably, lung macrophages after CLP decreased proliferation-related genes (Figure 4D), in direct contrast to the MI response. This divergent behavior of the same cell type after MI and CLP may explain why we detected almost no jointly upregulated genes after MI and CLP (Figure 3B), and indicates that in spite of a general unifying theme (increased inflammation), macrophages may exert organ- and injury-specific functions. Given the vigorous proliferative response of alveolar macrophages to MI, we decided to investigate this condition in more detail.
Preceding MI primes alveolar macrophages and protects the lung against infection
To determine whether the changes observed in alveolar macrophages after MI have functional consequences, we employed tracheal lung infection with bioluminescent Streptococcus pneumoniae as a second hit strategy. These experiments have clinical relevance because pneumonia is a frequent and lethal clinical complication in patients with MI, stroke and sepsis (Alp et al., 2004). Bioluminescence imaging reported a lower bacterial burden in the lungs of mice with prior MI (Figure 5A and 5B). This protection only occurred after MI and not after stroke, CLP (Figure 5C) or sham thoracotomy (Figure S4A). The reduced bacterial burden persisted in Ccr2−/− mice, which were unable to raise interstitial lung macrophage numbers via monocyte recruitment after MI (Figure S4B–D). This result indicates that monocyte-derived interstitial lung macrophages do not account for the post-MI protection against bacteria. We then employed local macrophage depletion, using tracheal clodronate liposome instillation, to examine the role of post-MI alveolar macrophage priming in the protection against lung infection (Figure S4E–F). We chose to deplete macrophages prior to infection to focus on MI-induced changes in alveolar macrophages. Depleting after infection may affect other cells that are recruited to the lung to fight bacteria. Of note, this depletion did not reduce interstitial lung macrophages (Figure S4G). Depleting alveolar macrophages increased the bacterial burden in the lung after MI (Figure 5D and Figure S4H). While mice with prior MI more likely survived pneumonia, this advantage declined when we depleted alveolar macrophages (Figure 5E). We hypothesized that macrophages display increased phagocytic activity after MI. Indeed, only after MI but not after CLP, a phagocytosis related gene set enriched in alveolar macrophages (Figure 5F). We therefore pursued an in vivo phagocytosis assay, which reported a higher uptake of fluorescent bacterial particles into alveolar macrophages after MI when these particles were instilled into the trachea (Figure 5G). We conclude that after MI, alveolar macrophages undergo adaptions that provide a survival benefit against lung infection by removing bacteria more efficiently than in mice without prior MI. These data indicate that macrophages, even when distant from the site of injury, sense remote events and enhance their ability to resist secondary infections.
Figure 5. Lung macrophages’ response to injury regulates organ susceptibility to subsequent infection.

(A) Experimental design and bioluminescence images. (B) Bacterial bioluminescent signal. Each data point represents one mouse. (C) Bioluminescent lung signal after MI, stroke and CLP. Control n=31–49, MI n=18–25, stroke n=3–10, CLP n=8–10. (D) Bioluminescence imaging after depletion of alveolar macrophages (clod) on day 4 after MI, 4 hrs prior to infection. (E) Survival after lung infection in naive mice (Con), clodronate liposome in controls (Con+clod), MI followed by lung infection (MI), MI, macrophage depletion and lung infection (MI+clod). Con vs. Con+clod, P=0.006; Con+clod vs. MI+clod, P=0.48. (F) Gene set enrichment (REACTOME_ER_PHAGOSOME_PATHWAY) in alveolar macrophages in naive control versus MI or CLP. FDR values here reflect single hypothesis testing. (G) Phagocytosis assay after intratracheal fluorescent E.coli in naive controls versus MI. (H) EGFR gene set enrichment (KOBAYASHI_EGFR_SIGNALING_24HR_DN) in alveolar macrophages after MI. (I) ELISA in naive controls and after MI. Control n=9–13, MI day 1 n=6–8, day 2 n=5 biological replicates. (J) Survival of LysM Egfr+/+ and LysM Egfr−/− mice after MI and lung infection. (K) Cytokine mRNA in lung 6 days after MI, 2 days after infection. Control n=4, LysM Egfr+/+ n=5, LysM Egfr−/− n=6. (L) Gene expression in alveolar macrophages sorted from mice with MI and after intratracheal instillation of EGF. (M) Neutrophils and (M) alveolar macrophages in lung. Control n=8, LysM Egfr+/+ n=6, LysM Egfr−/− n=8. (O) FMT/CT of lung protease activity in LysM Egfr+/+ and LysM Egfr−/− mice after MI followed by pneumonia. LysM Egfr+/+ n=5, LysM Egfr−/− n=3. (P) Bioluminescence imaging of bacteria in parabionts 5 days after MI, 1 day after lung infection. Control n=4, MI n=3. (Q) Gene set enrichment (HALLMARK_INTERFERON_GAMMA_RESPONSE) in alveolar macrophages from naive control versus MI. (R) IFNɣ protein in the lung after MI. Control n=5, MI n=5. (S) Bioluminescence in mice treated with IFNɣ or vehicle. Control n=9, IFNɣ n=5. (T) Bioluminescence in RAG1−/− control mice n=5 vs. RAG1−/− with MI n=4. (U) Violin plots of Ifnɣ expressing cells in each cluster compared to marker genes for NK cells (Klrb1c), macrophages (Cd68, Adgre1) and neutrophils (Cxcr2). (V) Expression of Ifnɣ in single cells from blood and heart. (W-Y) Tsne plots of Ifnɣ-expressing cells compared to NK marker genes (Klrg1, Klrb1c). Inserts expand NK and T cell cluster. Data are mean ± s.e.m. *P<0.05, **P<0.01, ***P<0.001, ****P<0.0001. Unpaired t-test or ordinary one-way ANOVA with Dunnett’s multiple comparison test for normally distributed data. For non-parametric data Mann-Whitney test or Kruskal-Wallis test with Dunn’s multiple comparison test were used. Survival was analyzed by log-rank test and Bonferroni correction for multiple comparison. See also Figure S4, S5.
Egfr signaling in alveolar macrophages causes tissue damage
Epidermal growth factor receptor (Egfr) signaling scored among the top gene sets enriched in alveolar macrophages after MI (Figure 5H). Egfr regulates cellular phenotypes and mediates tissue inflammation (Hardbower et al., 2016). After MI, the Egfr ligands epidermal growth factor (Egf), amphiregulin and transforming growth factor α increased significantly in lung tissue (Figure 5I). MI and pneumonia increased Egfr expression in alveolar macrophages but decreased Egfr expression in interstitial macrophages and plasmacytoid dendritic cells (Figure S4I). We exposed LysM Egfr−/− mice, which lack the receptor in myeloid cells, to MI, followed by pneumonia four days later. The choice of promoter, which is also expressed by neutrophils, was supported by Immgen data indicating that neutrophils express Egfr at low levels in steady state and during inflammation (Gautier et al., 2012). LysM Egfr−/− mice survived pneumonia as a complication of MI better than wild type mice (Figure 5J), indicating that pathways activated by Egfr signaling are harmful in this setting. Inflammatory gene expression declined in lung tissue harvested from LysM Egfr−/− when compared to wild type controls with double injury (Figure 5K). Such differences between Egfr−/− and wild type mice were only observed after MI and not in sham thoracotomy controls (Figure S4J–K). The increased expression of inducible nitric oxide synthase (Nos2), which gives rise to nitric oxide and mediates cytotoxicity (Wei et al., 1995), and chemokine (CC-motif) ligand 3 (Ccl3), a cytokine that recruits neutrophils, was reduced in alveolar macrophages of LysM Egfr−/− mice after MI and pneumonia (Figure S5A–B). Egfr−/− deletion did not produce such effects in interstitial macrophages, plasmacytoid dendritic cells and neutrophils (Figure S5C–E), or in alveolar macrophages after sham thoracotomy (Figure S5F). Egf administration into the trachea of mice with MI increased Nos2 and Ccl3 expression (Figure 5L). Accordingly, LysM Egfr−/− mice recruited fewer neutrophils to their lungs (Figure 5M), while alveolar macrophages, which declined after pneumonia induction, remained more numerous (Figure 5N). Molecular tomography of the lung detected lower protease activity in LysM Egfr−/− mice (Figure 5O).
IFNɣ primes alveolar macrophages after MI
To gain insight into the mechanism underlying the protective priming of alveolar macrophages after MI, we employed parabiosis surgery. After a shared circulation was established, one parabiont underwent coronary ligation. Four days later, the other parabiont received bacteria into the trachea. Bioluminescence imaging indicated that mice sharing circulation with an infarcted parabiont had lower bacterial loads in their lungs (Figure 5P). These data suggest that post-MI protection may be promoted by blood-derived components. We examined our whole genome expression data in alveolar macrophages to explore which blood borne factors could be causal. The hallmark gene set “interferon gamma response” enriched in alveolar macrophages after MI (Figure 5Q) but not after stroke or CLP (FDR=1). This intrigued us since interferon-ɣ (IFNɣ) is a prototypical macrophage activator (Schroder et al., 2004). Sensitization of myeloid cells occurs after small IFNɣ doses whereas higher concentrations provoke ligand-induced feedback inhibition and desensitization (Hu et al., 2002). Indeed, IFNɣ increased in the lung of mice on day 1 after MI (Figure 5R), and intratracheal instillation of 10 ng recombinant IFNɣ reduced bacterial burden in the lung (Figure 5S) while 10 μg did not (Figure S5G).
Lymphocytes are an obvious source for IFNɣ; however, RAG1 deficient mice which lack lymphocytes were still protected against pneumonia, suggesting that these cells may not convey protection post MI (Figure 5T). Using single cell RNA sequencing (sc-RNAseq) of heart and blood cells after MI, we found that IFNɣ was almost exclusively expressed by NK cells defined by expression of Klrg1 and Klrb1c (Figure 5U–Y). IFNɣ-expressing cells were found in both the infarcted heart and circulating blood (Figure 5V).
We further explored IFNɣ signaling post-MI using flow cytometry analysis of the heart, blood and lung of B6.129S4-Ifngtm3.1Lky/J mice which express YFP in cells that have turned on IFNɣ production. In agreement with the sc-RNAseq data, we detected YFP primarily in Klrb1c+ NK cells in the infarct, blood and lung (Figure S6A–B). T, dendritic and myeloid cells did not exhibit YFP fluorescence after MI (Figure S6C). Klrb1c+ NK cells expanded in the heart, blood and lung after MI (Figure S6D–I), suggesting that these cells may prime alveolar macrophages. Finally, we investigated in Cd11cCre/+ Ifngr1flox/flox mice whether lack of IFNɣ signaling reduces bacterial clearance in the lung after MI. These mice lack the IFNɣ receptor in cells that express CD11c. Of note, alveolar macrophages, among other leukocytes, express CD11c (Hussell and Bell, 2014). Deletion of the IFNɣ receptor in CD11c+ cells increased the bacterial burden in the lung 24 hours after infection (Figure S6J–K). These data suggest that after MI, IFNɣ primes CD11c+ cells in the lung, a process which protects the organ against incipient pneumonia. When viewed together with the data identifying the key role of alveolar macrophages, these results led us to conclude that after MI, alveolar macrophage activation depends at least in part on IFNɣ and enables more efficient bacterial clearance.
Cardiac macrophages protect myocytes in sepsis
After determining the relevance of lung macrophage adaptions to MI, a remote ischemic injury, we compared these findings to cardiac macrophages’ role after CLP, a systemic infectious injury. In contrast to ischemic stroke, cardiac resident macrophage numbers decreased precipitously one day post CLP (Figure 1C). We hypothesized that this disappearance could result from circulating bacteria as CLP gives rise to bacteremia and uptake of bacteria may lead to macrophage death (Hilbi et al., 1997). Indeed, we detected fluorescently labeled bacteria in cardiac macrophages after intravenous injection (Figure 6A). As a consequence of CLP, the percentage of dying PI+ cells increased among cardiac macrophages (Figure 6B). This observation indicates that cardiac macrophages scavenge pathogens in the setting of bacteremia and perish in the process. To examine whether cardiac macrophages are protective, we performed CLP in the Csf1−/− mouse, which had reduced cardiac resident macrophages (Figure 6C–D). Indeed, cardiac troponin, a biomarker released by injured cardiomyocytes, rose in blood after CLP in Csf1−/− mice when compared to wild type mice (Figure 6E), indicating accentuated myocyte injury in the absence of macrophages.
Figure 6. Macrophages protect the heart in sepsis.

(A) pHrodo E.coli in cardiac macrophages. (B) Propidium Iodide (PI) in heart macrophages after CLP. Control n=12, CLP n=4 per time point. (C) Flow plots and (D) number of cardiac macrophages in Csf1+/+ and Csf−/− mice. (E) Serum troponin levels in naive and CLP Csf1+/+ and Csf−/− mice. Naive Csf1+/+ n=6, Csf1−/− n=3, CLP Csf1+/+ n=6, Csf1−/− n=9. (F) Top regulated genes after CLP in heart macrophages. (G) Protein-protein association network for the top 100 genes by p-value that are differentially expressed in cardiac macrophages after CLP. (H) Serum troponin levels in Cx3cr1 Il10+/+ and Cx3cr1 Il10−/− mice after CLP. Naive Cx3cr1 Il10+/+ n=6, Cx3cr1 Il10−/− n=4, CLP Cx3cr1 Il10+/+ n=6, Cx3cr1 Il10−/− n=4. (I) Apoptotic cardiomyocytes by TUNEL staining. n=3 mice per group. (J) TUNEL+ myocyte. Dashed line marks cell border. (K) Outline for L and M. (L) MHCII expression in cardiac macrophages. Naive Cx3cr1 Il10+/+ n=6, Cx3cr1 Il10+/+ CLP n=6, Cx3cr1 Il10−/− CLP n=7 biological replicates. (M) qPCR in sorted cardiac macrophages. Naive Cx3cr1 Il10+/+ n=2–5, Cx3cr1 Il10+/+ CLP n=8, Cx3cr1 Il10−/− CLP n=5–6 biological replicates. (N) Gene expression in local versus recruited cardiac macrophages isolated from Cx3cr1CreER/+R26tdTomato/+ mice, n=4 biological replicates for control local, n=5 control recruited, n=10 CLP d4 local, n=8 CLP d4 recruited. Data are mean ± s.e.m. *P<0.05, **P<0.01, ***P<0.001, ****P<0.0001. Unpaired t-test or ordinary one-way ANOVA with Dunnett’s multiple comparison test was used for statistical analysis. See also Figure S6.
To determine by which mechanisms macrophages protect the heart, we scrutinized our gene expression data for pathways that are activated in cardiac macrophages after CLP. Anti-inflammatory interleukin Il10 was among the most increased genes in cardiac macrophages after CLP (Figure 6F). Furthermore, protein-protein association network analysis revealed a central position for Il10 among genes differentially expressed in cardiac macrophages after CLP (Figure 6G). When Il10 was deleted from macrophages in Cx3cr1 Il10−/− mice subjected to CLP, we detected increased blood troponin levels (Figure 6H), indicating leakage of cardiomyocyte protein into the blood, and increased numbers of TUNEL+ cardiomyocytes undergoing apoptosis (Figure 6I–J). We then examined cardiac macrophages from Cx3cr1 Il10−/− mice and wild type littermates that were exposed to CLP. We found that Il10 deletion reduced the MHCIIhigh macrophage subpopulation (Epelman et al., 2014), as recently observed in heart failure (Hulsmans et al., 2018) (Figure 6K–L). After Il10 deletion, macrophages expressed less Saa3 and Fpr1 (Figure 6M), which featured prominently in the Il10 interaction network (Figure 6G) and were among the most increased genes after CLP (Figure 6F), indicating that they are subject to regulation by Il10. Saa3 is an opsonin for Gram negative bacteria (Shah et al., 2006). Saa3 deletion leads to increased inflammatory innate immune cell phenotypes (Ather and Poynter, 2018), while the cell surface receptor Fpr1 supports bacterial clearance.
Since our fate mapping data showed that recruited macrophages increase by 3.8% after CLP in the heart (Figure 1J), we determined their relative contribution to the increase of Il10, Saa3, Fpr1 and other transcripts that increased in our bulk gene expression data (Figure 6F). We separately isolated recruited and locally sourced cardiac macrophages in naive controls and on day 4 after CLP, using Cx3cr1CreER/+R26tdTomato/+ mice, and measured expression of Il10, Saa3, Fpr1, Ccl8 and Cxcl13 by qRT-PCR. Increased expression after CLP (in comparison with steady state) was confirmed in all cases. For three genes (Il10, Fpr1 and Cxcl13), we found no difference (paired t-test >0.05) between local and recruited macrophages after CLP. In two cases (Saa3 and Ccl8), recruited macrophages had higher transcript levels after CLP, but both genes were also expressed at higher levels in local macrophages (Figure 6N). These data indicate that local and recruited heart macrophages react to CLP in a similar manner.
These data imply that macrophages protect cardiomyocytes during sepsis via Il-10 signaling which also regulates macrophage functions related to bacterial clearance. Since macrophage-specific gene deletion is not restricted to an organ, we cannot exclude that the observed cardiac protection also depends on Cx3cr1+ cells elsewhere. Taken together, our observations indicate that phenotypic adaptions of macrophages after MI or CLP protect organs such as the lung and the heart.
DISCUSSION
Taking an organism-wide perspective, we describe that macrophages react to infectious or distant ischemic stimuli. A priori, we expected variation in how different tissue-resident macrophages respond to disparate injuries. Gene expression profiles of macrophages in different tissue vary at baseline already (Lavin et al., 2014), affecting cellular reaction to systemic cytokines. In addition, immune and stromal cell content varies across organs which may influence the response of macrophages through reciprocal interaction of these cell types. Organs may also be differentially affected by certain injuries. For instance, the lung may be disproportionally influenced after MI because it drains blood directly from the ischemic myocardium. Indeed, we found differences in the response magnitude between organs to the same injury, but similar genes were altered after different injuries in the same organ, indicating that macrophage phenotype modulation was constrained by the microenvironment. The macrophage response depended more on the organ of residence than on the type of injury, and there were parallels in how macrophages adapt gene expression after infection and remote ischemia.
Our exploration of the post-MI lung documents the complexity of macrophages’ roles after injury. Alveolar macrophage depletion demonstrated a protective net benefit of post-MI priming for pathogen elimination during subsequent lung infection. The improved pneumonia survival post MI was not observed after stroke or CLP, perhaps due to the absence of MI-specific factors that act in concert with INFɣ to efficiently prime alveolar macrophages. Alternatively, pathways that cause lymphopenia after stroke (Dirnagl et al., 2007) and immune exhaustion during sepsis (Hotchkiss et al., 2013) neutralized the benefit of macrophage priming. Prior MI also led to inflammatory tissue damage during subsequent pneumonia, which was decreased by deleting Egfr in myeloid cells. Given the clinical use of EGFR inhibitors, future studies should explore if these drugs reduce inflammatory tissue damage.
The duration of injury-induced macrophage alterations remains unclear. Systemic danger may create a memory that lasts for weeks, the typical life span of a tissue-resident macrophage. Our observation of a CLP-induced month-long macrophage expansion in several organs supports that tissue homeostasis changes for prolonged periods. As we only studied acute injuries, it is necessary to investigate how chronic inflammatory processes influence tissue-resident macrophages. The question of risk storage in macrophages arises, i.e. is a tissue inhabited by macrophages that experienced a prior systemic or remote stressor more or less likely to develop subsequent disease? The emerging data on tissue-specific macrophage functions (Haldar et al., 2014; Hulsmans et al., 2017; Odegaard et al., 2007; Paolicelli et al., 2011) raise manifold implications, as it is currently unclear to which degree such functions are subverted by global inflammation. Macrophages likely influence organ homeostasis via crosstalk to both parenchymal and stromal cells (Chakarov et al., 2019), perhaps altering the vasculature, extracellular matrix and, consequently, long-term organ resilience against infectious complications or recurrent injury.
Another open question is how macrophages sense remote injuries. Here we describe that after MI, IFNɣ primes alveolar macrophages, a finding that lends support to development of adjunct treatment for pneumonia. The precise contribution of the cytokine’s cellular sources and effectors to reduced bacterial burden remains to be established in the specific setting. Additional, unrelated mechanisms of priming may be active. Toll-like receptor signaling, well-known for macrophage danger sensing (Medzhitov, 2001), is a likely candidate; yet, it is currently unclear which receptor-ligand pairs participate in alerting tissue-resident macrophages.
The gene expression atlas of macrophage response to injury strengthens the case for macrophages as therapeutic targets. Myeloid cells already hold interest in many disease and tissue settings; examples include tumor-associated macrophages (Mantovani et al., 2017) and atherosclerotic plaques (Li and Glass, 2002). The ongoing effort to shape macrophage activity with biologicals, RNAi, small molecule inhibitors and nanoparticle drug delivery may be broadened to consider macrophages organism-wide. Multiple organ failure commonly complicates the hospital course of patients with sepsis, stroke or cardiogenic shock following acute MI. Enhancing macrophages’ salutatory functions and dampening their deleterious inflammatory actions could mitigate complications and hasten recovery in such patients.
STAR METHODS
Lead Contact and Material Availability
Further information and requests for resources and reagents should be directed to and will be fulfilled by the Lead Contact, Matthias Nahrendorf (mnahrendorf@mgh.harvard.edu).
Experimental Models and Subject Details
Mice
C57BL/6J (000664), Ccr2−/− (B6.129S4-Ccr2tm1Ifc/J, 004999), LysMCre (B6.129P2-Lyz2tm1(cre)Ifo/J, 004781), Cx3cr1GFP/+ (B6.129P-Cx3cr1tm1Litt/J, 005582), Csf1−/− (B6;C3Fe a/a-Csf1op/J, 000231), tdTomatofloxed (B6.Cg-Gt(ROSA)26Sortm9(CAG-tdTomato)Hze/J, 007909), RAG1−/− (B6.129S7-Rag1tm1Mom/J, 002216), GREAT (B6.129S4-Ifngtm3.1Lky/J, 017581), CD11cCre (C57BL/6J-Tg(Itgaxcre,-EGFP)4097Ach/J, 007567), IFNɣRfloxed (C57BL/6N-Ifngr1tm1.1Rds/J, 025394), and CD45.1 (B6.SJL-Ptprca Pepcb/BoyJ, 002014) mice were purchased from The Jackson Laboratory. Cryo-derived Egfrfloxed mice (B6.129S6-Egfrtm1Dwt/Mmnc, identification number 031765-UNC) were obtained from the Mutant Mouse Resource and Research Centers, a NIH-funded strain repository, and were donated to the MMRRC by David Threadgill, Ph.D., North Carolina State University. IL-10floxed mice were developed by Axel Roers et al. (Roers et al., 2004) and imported into our animal facility. Recombination in Cx3cr1CreER−/+ Il10flox/flox and Cx3cr1CreER/+R26tdTomato/+ mice was induced via intra-peritoneal injection of tamoxifen (75mg/kg body weight) once every 24h for 5 consecutive days. There was a 7 day waiting period after the last injection. Additional injections were performed every 5th day to maintain recombination if required for a longer experimental duration. All mice were housed under specific pathogen-free conditions at the Center for Comparative Medicine at Massachusetts General Hospital. Male and female mice were used for this study, unless stated otherwise. Mice were 8–14 weeks old at the start of each experiment. Mice were randomly assigned to the experimental groups. All experiments were approved by Massachusetts General Hospital’s Institutional Animal Care and Use Committee.
Bacteria
Bioluminescent streptococcus pneumoniae Xen10 strain A66.1 (Caliper, LifeSciences) was used for this study. Bacteria were cultured on tryptic soy agar plates containing 5% sheep blood or in BHI broth containing 5% sheep blood and 200 μg/ml kanamycin without shaking at 37°C.
Methods Details
Myocardial infarction surgery
Coronary ligation to induce myocardial infarction was performed after mice were anesthetized with 2% isoflurane, intubated and ventilated. The chest fur was removed and the skin was disinfected with Betadine®. Left thoracotomy was done at the fourth intercostal space, and the left anterior descending coronary artery was permanently ligated with a monofilament nylon 8.0 suture. The thoracic cage was closed with a 5.0 monofilament suture. The skin wound was closed with absorbable sutures, and the wound was monitored daily.
Cecal ligation and puncture surgery
Cecal ligation and puncture was performed in mice anesthetized with 2% isoflurane. An abdominal midline incision was made, and the linea alba of the abdominal musculature was dissected. For sublethal peritonitis, the cecal tip was exteriorized, and the ligation was performed with a monofilament 5.0 nylon suture. The cecum was punctured with a 25-gauge needle, and a small amount of feces was extruded through the perforation. Lethal peritonitis was induced by a more proximal ligation (~1.5 cm from the tip) and puncture using a 19 gauge needle. Next, the cecum was returned into the peritoneal cavity, and the abdominal musculature was closed with a 5.0 monofilament suture. Mice were treated i.p. with 0.5 ml sterile saline. The skin incision was closed with 7 mm staples using a Reflex Skin Closure System from Harvard Apparatus.
Stroke surgery
Stroke was induced by transient middle cerebral artery occlusion (tMCAO) Anesthesia was induced with 2% isoflurane. A midline cervical incision was made, and the neck was dissected to expose the right carotid bifurcation. The external carotid artery (ECA) was identified and permanently sutured. Temporary sutures were placed on the common and internal carotid arteries (ICA) in order to allow an arteriotomy on the ECA. A silicon-coated filament was inserted (Doccol) and carefully moved towards the ICA until the operator perceived a “stop” feeling. The filament was left in place for 45 minutes. Afterwards, the filament was gently pulled out in order to reinstate perfusion. The temporary sutures were removed, and the skin was sutured using a 5.0 nylon monofilament.
Parabiosis
A parabiosis set-up was chosen to assess recruitment’s contribution to the leukocyte pool in peripheral organs. Female CD45.1 mice were surgically attached to age- and weight-matched CD45.2 mice. Anesthesia (2% isoflurane) was administered by nose cones. The corresponding lateral body parts were shaved and disinfected with Betadine®. A skin incision was made from the olecranon to the knee joint, and the subcutaneous fascia was mobilized. The olecranal and knee joints, respectively, were sutured together using 5.0 monofilament nylon sutures. The skin incision was closed with continuous 5.0 monofilament sutures. Mice were placed into a clean cage and allowed to recover for 3 weeks. Surgical procedures were performed in the CD45.2 parabiont. Blood and organ chimerism were assessed by flow cytometry. Leukocyte recruitment into the organ was normalized to blood chimerism levels.
Fate mapping
Cx3cr1CreER/+R26tdTomato/+ mice were used for fate mapping studies. These mice constitutively express YFP under the Cx3cr1 promoter. Treatment with tamoxifen induces the expression of tdTomato in Cx3cr1 expressing cells. For fate mapping experiments, mice received tamoxifen injections for five consecutive days (Figure S2B). Flow cytometry confirmed that blood monocytes, which express Cx3cr1, where positive for YFP and tdTomato on the first day after the last injection. As short lived monocytes are constantly replenished through proliferation of bone marrow progenitors, they lose tdTomato expression within weeks. In contrast, Cx3cr1 macrophages (renal macrophages, cardiac macrophages, and microglia) remain tdTomato positive. Thus, this system was used to distinguish between resident cells which express both, YFP and tdTomato, and recruited, monocyte-derived macrophages, which only express YFP, after injury. Some tissue macrophages (alveolar macrophages and Kupffer cells) do not express Cx3cr1. In this case, monocyte-derived macrophages were identified by YFP expression alone. The injury was induced on day 25 after the last tamoxifen injection and FACS was performed on day 4 after injury.
Cell isolation and flow cytometry
Mice were terminally anesthetized and perfused with 20 ml of phosphate buffered saline (PBS) via cardiac injection. The right lung, right liver lobe, left kidney, brain and heart were carefully excised. Tissues were thoroughly minced in a digestive suspension containing 450 U/ml collagenase I (Sigma, C0130–5G), 125 U/ml collagenase XI (Sigma, C7657–1G), 60 U/ml hyaluronidase I-S (Sigma, H3506–5G), 60 U/ml DNase I (Sigma, D5319–2MG), HEPES buffer (Mediatech Inc.) and PBS (Lonza). Cells were digested at 37°C on a shaker at 750 rpm. Afterwards, samples were filtered with staining buffer (PBS with 0.5% BSA) through a 40 μm nylon cell strainer (Falcon, Corning) to obtain a single cell suspension, which was then centrifuged at 340 g at 4°C for 7 min. Cerebral leu kocytes were additionally purified by Percoll gradient centrifugation at 4°C for 30 min. Cells we re stained with antibodies listed below in a dilution of 1:600 at 4°C for 30 min, washed with 1 ml of staining buffer and centrifuged at 340 g at 4°C for 7 min. The cell pellet was dissolved in 300 μl of staining buffer and kept at 4°C. In some cases, cells were further processed for intracellular staining. To this end, cells were fixed and permeabilized in accordance with manufacturers’ instructions. Specifically, a BrdU-kit (BD Biosciences, 552598) was used to fix, permeabilize and stain for BrdU incorporation, and a Foxp3/Transcription Factor Staining Buffer Set (eBioscience, 00-5523-00) was used to prepare the cells for Ki-67 proliferation staining. Data were acquired using a BD LSR2 Flow Cytometer and analyzed using FlowJo X 10.0 (Tree Star Inc.). Cell numbers were obtained with a hematocytometer and expressed per mg tissue. Tissue macrophages were identified in accordance with ImmGen guidelines (Gautier et al., 2012; Hussell and Bell, 2014; Lavin et al., 2014). The gating strategies for the different populations are outlined in Figure S1 and Table S1. A cocktail of antibodies against CD45R/B220 (RA3–6B2), TER-119 (TER-119), CD49b (DX5), CD90.2 (53–2.1) and NK1.1 (PK136) was combined as lineage markers. Renal macrophages were identified as CD45high lineagelow Ly6Glow CD64high F4/80high CD11bhigh. Cardiac macrophages were identified as lineagelow Ly6Glow CD11bhigh CD64high F4/80high Ly6Clow. Alveolar macrophages were identified as CD11chigh SSC-Ahigh MHCIIlow CD64high Siglec-Fhigh CD11blow. To allow comparison to other tissues that were digested, alveolar macrophages were also enumerated and isolated from digested lung. The observed kinetics were similar when cell numbers were expressed per organ (Figure S7A) or when macrophages were quantified in broncho-alveolar lavage (Figure S7B–D). Kupffer cells were identified as CD45high lineagelow Ly6Glow CD64high F4/80high CD11blow. After CLP, hepatic macrophages are CD11bhigh. Microglia were identified as CD45intermediate CD11bhigh lineagelow Ly6Glow Ly6Clow CD64high F4/80intermediate. Neutrophils were identified as CD45high lineagelow CD11bhigh Ly6Clow Ly6Ghigh in all tissues. Monocytes were identified as CD45high lineagelow CD11bhigh Ly6Glow and Ly6Chigh. In some organs, tissue-resident macrophages can be distinguished from recruited macrophages based on surface markers, which we relied on wherever possible. For instance, lung alveolar macrophages are CD11blow CD11chigh Siglec-Fhigh tissue-resident macrophages which expand exclusively through proliferation while lung interstitial macrophages are CD11bhigh CD11clow Siglec-Flow and are at least partly dependent on monocyte recruitment (Byrne et al., 2016; Hussell and Bell, 2014). Natural killer cells were identified as CD45high CD4low CD8low and KLRB1Chigh. The number of biological replicates for each experiment is provided in the figure legend.
Immunofluorescence imaging
Kidney:
12 week old heterozygous Cx3cr1-GFP mice were used to image renal macrophages on day 4 after either MI or CLP. Mice were perfused through the left ventricle with PBS for 2 min followed by 4% paraformaldehyde (Electron Microscopy Sciences) for 8 min. The kidneys were excised, cut and immersion fixed at 4°C overnight. 25 μm thick sections (Leica cryostat cm3050 s) were embedded in Tissue-Tek compound (Sakura Finetek). Tissue sections were rehydrated in PBS for 15 min, permeabilized in 0.3% Triton X-100 for 1h and blocked in 1% BSA for 30 min. WGA (Thermofisher Scientific) was applied at room temperature for 10 min. Diamond Antifade Mountant (Thermofisher Scientific) was used as cover medium. Images were recorded with a Nikon A1R confocal microscope.
Liver:
Using 12 week old C57/B6 mice, liver sections (25 μm) were processed as described above for the kidney (15 min rehydrated TBS, permeabilized with 0.2% Triton X-100 for 45 min, blocked in 1% BSA for 40 min). Antibodies against F4/80 and CD31 (Abcam) were applied overnight. Secondary antibodies were used in Alexa Fluor 488 and Alexa Fluor 568 (Jackson Immunoresearch Laboratories).
Lung:
12 week old C57/B6 mice were used to image lung macrophages. Mice were tracheally intubated with a 22G plastic catheter (Excel Safelet Cath) that was connected to a perfusion tube. Perfusion with PBS was initiated through the right ventricle followed by tracheal perfusion to conserve the alveolar structure. Perfusion was started with PBS for 2 min followed by paraformaldehyde for 8 min. The right lung was excised and processed as described above. F4/80 antibody was used to stain macrophages; podoplanin antibody to stain alveolar epithelial cells (Abcam). Secondary antibodies were used in Alexa Fluor 488 and Cy3 (Jackson Immunoresearch Laboratories).
Heart:
Cardiac macrophages were imaged in 12 week old heterozygous Cx3cr1-GFP mice. 30 minutes before sacrifice, 100 μg of anti-CD31 (MEC13.3) Alexa Fluor 647 antibody were injected into the retro-orbital plexus to stain for endothelial cells. Mice were perfused with 20 ml of phosphate buffered saline, followed by 20 ml of 4% paraformaldehyde (Electron Microscopy Sciences). The heart was carefully excised, mounted on a glass bottom petri-dish (FluoroDish, World Precision instruments) and imaged using a Nikon A1R confocal microscope.
RNA extraction, cDNA, qPCR
PicoPure RNA isolation Kit (Thermofisher Scientific, KIT 0204) was used to isolate RNA. A high capacity RNA-to-cDNA kit was used to generate cDNA (cat:4387406, Applied Biosystems). Taqman Fast Universal PCR Mastermix was used for qPCR (cat:4352042 Applied Biosystems). All Primers were TaqMan® Primer and were also purchased from Applied Biosystems.
EGFR ligand measurement and recombinant EGF
EGFR ligands were measured in lung tissue of 12 week old C57/B6 mice after myocardial infarction. To this end, the entire lung was carefully excised, mechanically homogenized in 1 ml of PBS, and centrifuged at 5.000 RCF for 5 min. EGFR ligands were measured in supernatant in accordance to manufacturer’s instructions. Mouse EGF ELISA kit was purchased from R&D Systems (cat: MEG00), Amphiregulin ELISA kit from Abcam (cat: ab100668), and TGFα ELISA kit from Lifespan Biosciences Inc. (cat: LS-F5435–1). Recombinant EGF was used as indicated and obtained from PeProtech (cat: 315–09).
Bioluminescence Imaging
To induce pneumonia, mice were anesthetized with 2% isoflurane and tracheally intubated with a 22G plastic catheter in an upright position. Bioluminescent streptococcus bacteria were placed directly into the trachea to ensure equal bacterial loading. Doses of 1 to 2.5 ×10⁵ CFU were used for experiments. Mice were imaged using a bioluminescence/X-ray scanner (AmiX, spectral instruments imaging) with medium binning and exposure times between 20 seconds and 8 minutes depending on camera saturation along with an X-ray scan. Bioluminescent images were quantified with AMIView software by drawing ROI in the lungs and an additional ROI for image background subtraction.
Fluorescence Molecular Tomography/Computed Tomography (FMT/CT)
FMT/CT was carried out to determine tissue injury and inflammation after pneumonia following myocardial infarction. LysM Egfr−/− and LysM Egfr+/+ mice were used for this experiment and subjected to MI and pneumonia. MMPSense 750 FAST (NEV10168, Perkin Elmer) is optically silent after injection but shows fluorescence after cleavage by various MMPs. MMPSense 750 (5 nmol/animal) was intravenously injected on day 1 after pneumonia induction. Imaging was performed 16 hours later. After being anesthetized with 2% isoflurane, mice were shaved, and a chemical depilatory (Nair, Church and Dwight) was applied to the torso immediately before imaging. Mice were positioned in an imaging cartridge that contains fiducial markers to allow image registration from multiple modalities. High resolution CT (Inveon PET-CT, Siemens) with 80 kVp 500 μA over 360 projections was acquired to obtain detailed anatomical information about the murine thorax, including the lungs. Next, the imaging cartridge was placed into the FMT 2500 (Perkin Elmer) and scanned using the 750 nm channel with 50 to 75 laser points. ROI’s were drawn using the TrueQuant software for quantification. In addition, the FMT/CT images were coregistered using Osirix software (Pixmeo SARL). 3D renderings were obtained in Amira software environment (FEI Hillsboro).
Lung injury assays
To determine whether a remote inflammatory event modulates susceptibility to pneumonia, mice were subjected to MI, stroke or CLP. Pneumonia was induced on day 4 after the first injury. Mice were subjected to bioluminescence/X-ray imaging on the following days. In some cases, alveolar macrophages were depleted before pneumonia induction. To this end, 25 μl clodronate liposomes were placed directly in the trachea (ClodronateLiposomes.org, Haarlem). Depletion efficacy was confirmed by flow cytometry. Tissue inflammation was assessed by FMT/CT as described above. IFNɣ protein levels were measured in lung supernatant on day 1 after MI using a commercially available ELISA kit (Mouse IFNɣ Quantikine ELISA kit, R&D Systems, cat: MIF00). Recombinant IFNɣ was obtained from PeProtech (cat: 315–05). IFNɣ was given directly into the trachea (10ng or 10μg per mouse).
Phagocytic activity of alveolar macrophages was assessed by means of pHrodo E.coli bio-particles (ThermoFisher Scientific, cat: P35366) on day 4 after MI. In brief, mice were anesthetized with 2% isoflurane and tracheally intubated with a 22G plastic catheter in an upright position. 10 μg (dissolved in PBS) were directly given into the trachea and uptake was measured via flow cytometry 2h later.
Heart injury assays
Csf−/− mice, which lack cardiac macrophages, and Csf+/+ mice were subjected to CLP. To determine the role of macrophage-derived Il10 in the setting of peritonitis, lethal CLP was also induced in Cx3cr1 Il10−/− mice. Blood was drawn via eye bleeding on day 1 after CLP and centrifuged at 1200 RCF at 4°C for 10 min to obtain serum. Cardiac myocyte injury was determined by assessing serum troponin I levels with an ultra-sensitive ELISA kit (cTnI serum/plasma CTNI-1-US, Life Diagnostics). Apoptosis of cardiomyocytes in Cx3cr1 Il10−/− mice after CLP was assessed by TUNEL staining (in situ cell death detection kit TMR red, Sigma Aldrich).
Microarrays
We chose to perform transcriptome profiling on the entire macrophage population because the net effect of all macrophages present in a tissue has functional importance in health and disease, regardless of the origin of these cells. We collected cells from at least three independent animals for each of the three diseases and from naive controls, and performed transcriptome-wide gene expression profiling for a total of 56 samples. Male 12 week old C57/B6 mice were used for all experiments. Tissue harvest for microarray studies was performed in accordance with current guidelines from the Immunological Genome Project (www.ImmGen.org). 5000 cells were sorted (FACSAriaII) from each organ, using FACS gating outlined in Figure S1. Tissue was obtained on day 4 after stroke, MI or CLP, or from naive controls. Pilot experiments indicated that macrophage numbers are comparable in naive controls and after sham thoracotomy (Figure S7E). RNA was isolated with the PicoPure RNA extraction kit (Thermofisher Scientific, KIT 0204), with an elution volume of 11 μl. Gene expression profiling was performed by the Partners HealthCare Personalized Medicine Translational Genomics Core. RNA integrity was assessed with a Bioanalyzer (Agilent). The average RNA intregrity number (RIN) was 9.1±0.1 (mean±s.e.m.). Amplified cDNA was prepared using the Ovation Pico WTA System V2 (NuGEN) and hybridized to GeneChip Mouse Gene 2.0 ST arrays (Affymetrix).
Single cell RNA-sequencing
Single cell transcriptomic profiling was performed using in Drop or 10X Genomics single cell barcoding. After demultiplexing and mapping to the murine reference genome (mm10), we bioinformatically removed riboprotein and mitochondrial transcripts and harmonized gene lists between platforms. Unbiased clustering was performed using Seurat 3.0 (https://satijalab.org/seurat/) and cell types were identified based on marker genes with cross-validation with the ImmGen database and previously published cardiac single cell data sets.
Quantification and Statistical Analysis
Microarray data
Raw microarray data are available from Gene Expression Omnibus, Accession number GSE104342. We analyzed data using Bioconductor’s Oligo package (Ritchie et al., 2015). Data were normalized using the robust multi-array average (Irizarry et al., 2003), and probes that do not belong to the main array content were filtered out.
Differential expression analysis
To calculate differentially expressed genes, we used Bioconductor’s Limma package (Ritchie et al., 2015). We fit the linear model to the entire data set and extracted group comparisons as individual contrasts, using trend=TRUE in the eBayes step. For the overview in Figure 2 and Table S2, differentially expressed transcripts (q < 0.1) were collapsed to unique gene symbols, and transcripts that did not map to a gene with an official name were not counted.
Functional annotation of clusters
To generate the heatmap in Figure 2F, we selected all transcript clusters with a q-value < 0.01 in at least one condition. We removed probe sets that did not map to a gene with an official name and averaged the expression values of transcripts mapping to the same gene, such that the expression matrix had rows consisting of unique gene symbols. To functionally annotate clusters, we used Bioconductor’s topGO package (https://bioconductor.org/packages/release/bioc/html/topGO.html). Figure 3D was generated with Bioconductor’s clusterProfiler package (http://bioconductor.org/packages/release/bioc/html/clusterProfiler.html).
Gene set enrichment analysis
RMA-normalized data were converted to GCT-file format and analyzed with the javaGSEA Desktop Application (available from http://software.broadinstitute.org/gsea). We used gene set permutation, Signal2Noise as a ranking metric and the weighted scoring scheme. All other parameters were default.
Protein-protein association networks
Gene names of differentially expressed were submitted to StringDB (https://string-db.org/). We used all interaction sources with a minimum interaction score of 0.4 (default setting). We removed all nodes with fewer than four connections from the network and visualized the results in Cytoscape (http://www.cytoscape.org/).
Statistics
Data were analyzed using GraphPad Prism® software. Normal distribution was assessed with DÀgostino-Pearson omnibus test and Shapiro-Wilk normality test. Unpaired, two-tailed t-test or ordinary one-way ANOVA with Dunnett’s multiple comparison test was used for parametric data. Mann-Whitney U test or Kruskal-Wallis test with Dunn’s multiple comparison test was used for non-parametric distribution. Survival was analyzed by log-rank test and Bonferroni correction for multiple comparison. N-values represent biological replicates and statistical parameters are provided in the figure legends.
Data and Code Availability
Raw microarray data are available from Gene Expression Omnibus, Accession number GSE104342.
Supplementary Material
Key Resources Table
| REAGENT or RESOURCE | SOURCE | IDENTIFIER |
|---|---|---|
| Antibodies | ||
| Anti-mouse Ly6C FITC Clone AL-21 | BD Biosciences | Cat# 553104; RRID: AB_394628 |
| Anti-mouse CD45R/B220 PE Clone RA3–6B2 | BioLegend | Cat# 103208; RRID: AB_312993 |
| Anti-mouse TER-119 PE Clone TER-119 | BD Pharmingen | Cat# 553673; RRID: AB_394986 |
| Anti-mouse CD49b (pan-NK cells) PE Clone DX5 | BioLegend | Cat# 108908; RRID: AB_313415 |
| Anti-mouse CD11b PE Clone M1/70 | BioLegend | Cat# 101208; RRID: AB_312791 |
| Anti-mouse CD90.2 (Thy1.2) PE Clone 53–2.1 | BioLegend | Cat# 140308; RRID: AB_1061145 |
| Anti-mouse Ly6G PE Clone 1A8 | BD Biosciences | Cat# 551461; RRID: AB_394208 |
| Anti-mouse NK1.1 PE Clone PK136 | BioLegend | Cat# 108708; RRID: AB_313395 |
| Anti-mouse CD45.2 PerCP/Cy5.5 Clone 104 | BioLegend | Cat# 109828; RRID: AB_893350 |
| Anti-mouse CD115 (c-fms) PerCP-eFluor 710 Clone AFS98 | eBioscience | Cat#46-1152-82; RRID: AB_10597740 |
| Anti-mouse F4/80 PE/Cy7 Clone BM8 | BioLegend | Cat# 123113; RRID: AB_893490 |
| Anti-mouse Siglec-F BV412 Clone E50–2440 | BD Biosciences | Cat# 562681; RRID: AB_2722581 |
| Anti-mouse CD64 BV421 Clone X54–5/7.1 | BioLegend | Cat# 139309; RRID: AB_2562694 |
| Anti-mouse CD8a BV421 Clone 53–6.7 | BioLegend | Cat# 100737; RRID: AB_10897101 |
| Anti-mouse CD11c BV510 Clone N418 | BioLegend | Cat# 117338; RRID: AB_2562016 |
| Anti-mouse CD4 BV510 Clone RM4–5 | BioLegend | Cat# 100553; RRID: AB_2561388 |
| Anti-mouse I-A/I-E BV605 Clone M5/144.15.2 | BioLegend | Cat# 107639; RRID: AB_2565894 |
| Anti-mouse CD24 BV605 Clone M1/69 | BioLegend | Cat# 101827; RRID: AB_2563464 |
| Anti-mouse Ki-67 BV605 Clone 16A8 | BioLegend | Cat# 652413; RRID: AB_2562664 |
| Anti-mouse IgG2a, k BV605 Clone RTK2758 | BioLegend | Cat# 400539; RRID: AB_11126979 |
| Anti-mouse CD8a BV711 Clone 53–6.7 | BioLegend | Cat#100747; RRID: AB_11219594 |
| Anti-mouse CD45 BV711 Clone 30-F11 | BioLegend | Cat# 103147; RRID: AB_2564383 |
| Anti-mouse CD45 BV711 Clone 30-F11 | BD Biosciences | Cat# 563709; RRID: AB_2687455 |
| Anti-mouse CD103 BV711 Clone M290 | BD Biosciences | Cat# 564320; RRID: AB_2738743 |
| Anti-mouse CD103 BUV395 Clone M290 | BD Biosciences | Cat# 740238; RRID: AB_2739985 |
| Anti-mouse CD64a&b Alexa Fluor 647 Clone X54–5/7.1 | BD Biosciences | Cat# 558539; RRID: AB_647120 |
| Anti-mouse CD31 Alexa Fluor 647 Clone MEC13.3 | BioLegend | Cat# 102516; RRID: AB_2161029 |
| Donkey anti-goat IgG Alexa Fluor 647 (H+L) | Invitrogen | Cat# A-21447; RRID: AB_141844 |
| Anti-mouse CD11b APC/Cy7 Clone M1/70 | BioLegend | Cat# 101226; RRID: AB_830642 |
| Anti-mouse CD45.1 Alexa 700 Clone A20 | BioLegend | Cat# 110724; RRID: AB_493733 |
| Anti-mouse I-A/I-E Alexa Fluor 700 Clone M5/114.15.2 | BioLegend | Cat# 107622; RRID: AB_493727 |
| Anti-mouse MHC II (I-A/I-E) Alexa Fluor 700 Clone M5/114.15.2 | eBioscience | Cat# 56-5321-82; RRID: AB_494009 |
| CLEC4F/CLECSF13 (goat anti-mouse) | R&D Systems | Cat# AF2784; RRID: AB_2081339 |
| Bacterial and Virus Strains | ||
| Bioluminescent Streptococcus Pneumoniae Xen10 | Caliper, LifeSciences | Strain A66.1 |
| Chemicals, Peptides, and Recombinant Proteins | ||
| Clodronate liposomes | ClodronateLiposomes.org, Haarlem | NA |
| DAPI | Thermo Fisher Scientific | Cat# F10347 |
| MMPSense FAST | Perkin Elmer | Cat# NEV10168 |
| pHrodo Green E.coli BioParticles | ThermoFisher Scientific | Cat# P35366 |
| Recombinant EGF | PeProtech | Cat# 315–09 |
| Recombinant IFNɣ | PeProtech | Cat# 315–05 |
| Tamoxifen | Sigma-Aldrich | Cat# T5648 |
| WGA Alexa Fluor 647 | Thermo Fisher Scientific | Cat# W32466 |
| Critical Commercial Assays | ||
| Amphiregulin ELISA Kit | Abcam | Cat# ab100668 |
| Anti-PE microbeads | Miltenyi Biotec | Cat# 130-048-801 |
| BrdU Kit | BD Biosciences | Cat# 552598 |
| CD11b microbeads | Miltenyi Biotec | Cat# 130-049-601 |
| CTNI Serum/Plasma ELISA Kit | CTNI-1-US | Cat# Life Diagnostics |
| Foxp3/Transcription Factor Staining Buffer Set | eBioscience | Cat# 00-5523-00 |
| High-Capacity RNA-to-cDNA kit | Thermo Fisher Scientific | Cat# 4387406 |
| In Situ Cell Death Detection Kit, TMR red | Sigma Aldrich | Cat# 12156792910 |
| Mouse EGF ELISA Kit | R&D Systems | Cat# MEG00 |
| Mouse IFN-gamma Quantikine ELISA kit | R&D Systems | Cat# MIF00 |
| RNeasy Micro kit | Qiagen | Cat# 74004 |
| TaqMan Fast Universal PCR Master Mix | Thermo Fisher Scientific | Cat# 4352042 |
| TNFα Quantikine ELISA Kit | Lifespan Biosciences Inc. | Cat# LS-F5435–1 |
| PicoPure RNA Isolation Kit | Thermo Fisher Scientific | Cat# KIT0204 |
| Deposited Data | ||
| Tissue macrophages after remote injury | GEO datasets http://www.ncbi.nlm.nih.gov/geo/ | GEO: GSE104342 |
| Experimental Models: Organisms/Strains | ||
| B6.129P-Cx3cr1tm1Litt/J | The Jackson Laboratory | JAX: 005582 |
| B6.129P2(Cg)-Cx3cr1tm2.1(cre/ERT)Litt/WganJ | The Jackson Laboratory | JAX: 021160 |
| B6;C3Fe a/a-Csf1op/J | The Jackson Laboratory | JAX: 000231 |
| B6.129S6-Egfrtm1Dwt/Mmnc | MMRRC | 031765-UNC |
| B6.Cg-Gt(ROSA)26Sortm9(CAG-tdTomato)Hze/J | The Jackson Laboratory | JAX: 007909 |
| B6.129S7-Rag1tm1Mom/J | The Jackson Laboratory | JAX: 002216 |
| B6.129S4-Ifngtm3.1Lky/J | The Jackson Laboratory | JAX: 017581 |
| C57BL/6 | The Jackson Laboratory | JAX: 000664 |
| C57BL/6J-Tg(Itgax-cre,-EGFP)4097Ach/J | The Jackson Laboratory | JAX: 007567 |
| C57BL/6N-Ifngr1tm1.1Rds/J | The Jackson Laboratory | JAX: 025394 |
| Ccr2−/− B6.129S4-Ccr2tm1Ifc/J | The Jackson Laboratory | JAX: 004999 |
| CD45.1 B6.SJL-Ptprca Pepcb/BoyJ | The Jackson Laboratory | JAX: 002014 |
| IL10-flox | Axel Roers et al. | NA |
| LysMCre B6.129P2-Lyz2tm1(cre)Ifo/J | The Jackson Laboratory | JAX: 004781 |
| Software and Algorithms | ||
| Amira 3D | FEI Software | http://www.fei.com/software/amira-3d-for-life-sciences/ |
| Bioconductor’s Oligo package | Bioconductor | https://www.bioconductor.org/ |
| Bioconductor’s topGO package | Bioconductor | https://www.bioconductor.org/ |
| Bioconductor’s clusterProfiler package | Bioconductor | https://www.bioconductor.org/ |
| javaGSEA Desktop Application | Broad Institute | http://software.broadinstitute.org/gsea) |
| StringDB | STRING | https://string-db.org/ |
| Cytoscape | Cytoscape | http://www.cytoscape.org/ |
| FlowJo v10 | FlowJo | https://www.flowjo.com/ |
| GraphPad Prism v7.0a | GraphPad Software | http://www.graphpad.com/ |
| ImageJ v1.48 | NIH | http://imagej.net/ |
| iVision v4.5.2 | BioVision Technologies | http://www.biovis.com/ivision.html |
Highlights.
Gene expression profiling mapped systemic macrophage responses to sepsis, MI and stroke.
The tissue microenvironment determined phenotypic adaptions following remote injury.
Local proliferation dominated over recruitment in expanding tissue macrophage numbers.
Alveolar macrophage priming post MI increased resilience against subsequent pneumonia.
ACKNOWLEDGMENTS
This work was funded by the National Institutes of Health (HL139598, HL125428, NS084863, HL128264, HL129168, DP2AR075321, UL1TR001442, CA225655, GM53522, GM083016, GM119197, T32HL076136, DK57521, DK43351); AHA 17IRG33410543; from the European Union’s Horizon 2020 programme 667837; the MGH Research Scholar Program and the Cure Alzheimer’s Fund. F.F.H. was supported by the German Research Foundation HO5279/1-2, German Heart Foundation and the Jung Foundation for Science and Research. D.R. was supported by the German Research Foundation RO5071/1-1.
Footnotes
DECLARATION OF INTERESTS
M.N. has been a paid a consultant fee or received research support from Alnylam, GSK, IFM Therapeutics, Medtronic, Molecular Imaging, Novartis, Sigilon and Verseaux.
Publisher's Disclaimer: This is a PDF file of an unedited manuscript that has been accepted for publication. As a service to our customers we are providing this early version of the manuscript. The manuscript will undergo copyediting, typesetting, and review of the resulting proof before it is published in its final form. Please note that during the production process errors may be discovered which could affect the content, and all legal disclaimers that apply to the journal pertain.
REFERENCES
- Alp E, Guven M, Yildiz O, Aygen B, Voss A, and Doganay M (2004). Incidence, risk factors and mortality of nosocomial pneumonia in intensive care units: a prospective study. Ann Clin Microbiol Antimicrob 3, 17. [DOI] [PMC free article] [PubMed] [Google Scholar]
- Ather JL, and Poynter ME (2018). Serum amyloid A3 is required for normal weight and immunometabolic function in mice. PLoS One 13, e0192352. [DOI] [PMC free article] [PubMed] [Google Scholar]
- Case J, Khan S, Khalid R, and Khan A (2013). Epidemiology of acute kidney injury in the intensive care unit. Crit Care Res Pract 2013, 479730. [DOI] [PMC free article] [PubMed] [Google Scholar]
- Chakarov S, Lim HY, Tan L, Lim SY, See P, Lum J, Zhang XM, Foo S, Nakamizo S, Duan K, Kong WT, Gentek R, Balachander A, Carbajo D, Bleriot C, Malleret B, Tam JKC, Baig S, Shabeer M, Toh SES, Schlitzer A, Larbi A, Marichal T, Malissen B, Chen J, Poidinger M, Kabashima K, Bajenoff M, Ng LG, Angeli V, and Ginhoux F (2019). Two distinct interstitial macrophage populations coexist across tissues in specific subtissular niches. Science 363, [DOI] [PubMed] [Google Scholar]
- Davies LC, Jenkins SJ, Allen JE, and Taylor PR (2013). Tissue-resident macrophages. Nat Immunol 14, 986–995. [DOI] [PMC free article] [PubMed] [Google Scholar]
- Dirnagl U, Klehmet J, Braun JS, Harms H, Meisel C, Ziemssen T, Prass K, and Meisel A (2007). Stroke-induced immunodepression: experimental evidence and clinical relevance. Stroke 38, 770–773. [DOI] [PubMed] [Google Scholar]
- Dutta P, Courties G, Wei Y, Leuschner F, Gorbatov R, Robbins CS, Iwamoto Y, Thompson B, Carlson AL, Heidt T, Majmudar MD, Lasitschka F, Etzrodt M, Waterman P, Waring MT, Chicoine AT, van der Laan AM, Niessen HW, Piek JJ, Rubin BB, Butany J, Stone JR, Katus HA, Murphy SA, Morrow DA, Sabatine MS, Vinegoni C, Moskowitz MA, Pittet MJ, Libby P, Lin CP, Swirski FK, Weissleder R, and Nahrendorf M (2012). Myocardial infarction accelerates atherosclerosis. Nature 487, 325–329. [DOI] [PMC free article] [PubMed] [Google Scholar]
- Epelman S, Lavine KJ, Beaudin AE, Sojka DK, Carrero JA, Calderon B, Brija T, Gautier EL, Ivanov S, Satpathy AT, Schilling JD, Schwendener R, Sergin I, Razani B, Forsberg EC, Yokoyama WM, Unanue ER, Colonna M, Randolph GJ, and Mann DL (2014). Embryonic and adult-derived resident cardiac macrophages are maintained through distinct mechanisms at steady state and during inflammation. Immunity 40, 91–104. [DOI] [PMC free article] [PubMed] [Google Scholar]
- Gautier EL, Shay T, Miller J, Greter M, Jakubzick C, Ivanov S, Helft J, Chow A, Elpek KG, Gordonov S, Mazloom AR, Ma’ayan A, Chua WJ, Hansen TH, Turley SJ, Merad M, and Randolph GJ (2012). Gene-expression profiles and transcriptional regulatory pathways that underlie the identity and diversity of mouse tissue macrophages. Nat Immunol 13, 1118–1128. [DOI] [PMC free article] [PubMed] [Google Scholar]
- Glass CK, and Natoli G (2016). Molecular control of activation and priming in macrophages. Nat Immunol 17, 26–33. [DOI] [PMC free article] [PubMed] [Google Scholar]
- Greter M, Lelios I, and Croxford AL (2015). Microglia Versus Myeloid Cell Nomenclature during Brain Inflammation. Front Immunol 6, 249. [DOI] [PMC free article] [PubMed] [Google Scholar]
- Haldar M, Kohyama M, So AY, Kc W, Wu X, Briseno CG, Satpathy AT, Kretzer NM, Arase H, Rajasekaran NS, Wang L, Egawa T, Igarashi K, Baltimore D, Murphy TL, and Murphy KM (2014). Heme-mediated SPI-C induction promotes monocyte differentiation into iron-recycling macrophages. Cell 156, 1223–1234. [DOI] [PMC free article] [PubMed] [Google Scholar]
- Hardbower DM, Singh K, Asim M, Verriere TG, Olivares-Villagomez D, Barry DP, Allaman MM, Washington MK, Peek RMJ, Piazuelo MB, and Wilson KT (2016). EGFR regulates macrophage activation and function in bacterial infection. J Clin Invest 126, 3296–3312. [DOI] [PMC free article] [PubMed] [Google Scholar]
- Hashimoto D, Chow A, Noizat C, Teo P, Beasley MB, Leboeuf M, Becker CD, See P, Price J, Lucas D, Greter M, Mortha A, Boyer SW, Forsberg EC, Tanaka M, van Rooijen N, Garcia-Sastre A, Stanley ER, Ginhoux F, Frenette PS, and Merad M (2013). Tissue-resident macrophages self-maintain locally throughout adult life with minimal contribution from circulating monocytes. Immunity 38, 792–804. [DOI] [PMC free article] [PubMed] [Google Scholar]
- Heidt T, Courties G, Dutta P, Sager HB, Sebas M, Iwamoto Y, Sun Y, Da Silva N, Panizzi P, van der Laan AM, Swirski FK, Weissleder R, and Nahrendorf M (2014). Differential contribution of monocytes to heart macrophages in steady-state and after myocardial infarction. Circ Res 115, 284–295. [DOI] [PMC free article] [PubMed] [Google Scholar]
- Hilbi H, Zychlinsky A, and Sansonetti PJ (1997). Macrophage apoptosis in microbial infections. Parasitology 115 Suppl, S79–87. [DOI] [PubMed] [Google Scholar]
- Hotchkiss RS, Monneret G, and Payen D (2013). Sepsis-induced immunosuppression: from cellular dysfunctions to immunotherapy. Nat Rev Immunol 13, 862–874. [DOI] [PMC free article] [PubMed] [Google Scholar]
- Hu X, Herrero C, Li WP, Antoniv TT, Falck-Pedersen E, Koch AE, Woods JM, Haines GK, and Ivashkiv LB (2002). Sensitization of IFN-gamma Jak-STAT signaling during macrophage activation. Nat Immunol 3, 859–866. [DOI] [PubMed] [Google Scholar]
- Hulsmans M, Clauss S, Xiao L, Aguirre AD, King KR, Hanley A, Hucker WJ, Wulfers EM, Seemann G, Courties G, Iwamoto Y, Sun Y, Savol AJ, Sager HB, Lavine KJ, Fishbein GA, Capen DE, Da Silva N, Miquerol L, Wakimoto H, Seidman CE, Seidman JG, Sadreyev RI, Naxerova K, Mitchell RN, Brown D, Libby P, Weissleder R, Swirski FK, Kohl P, Vinegoni C, Milan DJ, Ellinor PT, and Nahrendorf M (2017). Macrophages Facilitate Electrical Conduction in the Heart. Cell 169, 510–522.e20. [DOI] [PMC free article] [PubMed] [Google Scholar]
- Hulsmans M, Sager HB, Roh JD, Valero-Munoz M, Houstis NE, Iwamoto Y, Sun Y, Wilson RM, Wojtkiewicz G, Tricot B, Osborne MT, Hung J, Vinegoni C, Naxerova K, Sosnovik DE, Zile MR, Bradshaw AD, Liao R, Tawakol A, Weissleder R, Rosenzweig A, Swirski FK, Sam F, and Nahrendorf M (2018). Cardiac macrophages promote diastolic dysfunction. J Exp Med 215, 423–440. [DOI] [PMC free article] [PubMed] [Google Scholar]
- Hussell T, and Bell TJ (2014). Alveolar macrophages: plasticity in a tissue-specific context. Nat Rev Immunol 14, 81–93. [DOI] [PubMed] [Google Scholar]
- Ip WKE, Hoshi N, Shouval DS, Snapper S, and Medzhitov R (2017). Anti-inflammatory effect of IL-10 mediated by metabolic reprogramming of macrophages. Science 356, 513–519. [DOI] [PMC free article] [PubMed] [Google Scholar]
- Kallmunzer B, Breuer L, Kahl N, Bobinger T, Raaz-Schrauder D, Huttner HB, Schwab S, and Kohrmann M (2012). Serious cardiac arrhythmias after stroke: incidence, time course, and predictors--a systematic, prospective analysis. Stroke 43, 2892–2897. [DOI] [PubMed] [Google Scholar]
- Langhorne P, Stott DJ, Robertson L, MacDonald J, Jones L, McAlpine C, Dick F, Taylor GS, and Murray G (2000). Medical complications after stroke: a multicenter study. Stroke 31, 1223–1229. [DOI] [PubMed] [Google Scholar]
- Lavin Y, Mortha A, Rahman A, and Merad M (2015). Regulation of macrophage development and function in peripheral tissues. Nat Rev Immunol 15, 731–744. [DOI] [PMC free article] [PubMed] [Google Scholar]
- Lavin Y, Winter D, Blecher-Gonen R, David E, Keren-Shaul H, Merad M, Jung S, and Amit I (2014). Tissue-resident macrophage enhancer landscapes are shaped by the local microenvironment. Cell 159, 1312–1326. [DOI] [PMC free article] [PubMed] [Google Scholar]
- Li AC, and Glass CK (2002). The macrophage foam cell as a target for therapeutic intervention. Nat Med 8, 1235–1242. [DOI] [PubMed] [Google Scholar]
- Mantovani A, Marchesi F, Malesci A, Laghi L, and Allavena P (2017). Tumour-associated macrophages as treatment targets in oncology. Nat Rev Clin Oncol 14, 399–416. [DOI] [PMC free article] [PubMed] [Google Scholar]
- McNamara RL, Kennedy KF, Cohen DJ, Diercks DB, Moscucci M, Ramee S, Wang TY, Connolly T, and Spertus JA (2016). Predicting In-Hospital Mortality in Patients With Acute Myocardial Infarction. J Am Coll Cardiol 68, 626–635. [DOI] [PubMed] [Google Scholar]
- Medzhitov R (2001). Toll-like receptors and innate immunity. Nat Rev Immunol 1, 135–145. [DOI] [PubMed] [Google Scholar]
- Nabel EG, and Braunwald E (2012). A tale of coronary artery disease and myocardial infarction. N Engl J Med 366, 54–63. [DOI] [PubMed] [Google Scholar]
- Netea MG, Joosten LA, Latz E, Mills KH, Natoli G, Stunnenberg HG, O’Neill LA, and Xavier RJ (2016). Trained immunity: A program of innate immune memory in health and disease. Science 352, aaf1098. [DOI] [PMC free article] [PubMed] [Google Scholar]
- Odegaard JI, Ricardo-Gonzalez RR, Goforth MH, Morel CR, Subramanian V, Mukundan L, Red Eagle A, Vats D, Brombacher F, Ferrante AW, and Chawla A (2007). Macrophage-specific PPARgamma controls alternative activation and improves insulin resistance. Nature 447, 1116–1120. [DOI] [PMC free article] [PubMed] [Google Scholar]
- Paolicelli RC, Bolasco G, Pagani F, Maggi L, Scianni M, Panzanelli P, Giustetto M, Ferreira TA, Guiducci E, Dumas L, Ragozzino D, and Gross CT (2011). Synaptic pruning by microglia is necessary for normal brain development. Science 333, 1456–1458. [DOI] [PubMed] [Google Scholar]
- Ritchie ME, Phipson B, Wu D, Hu Y, Law CW, Shi W, and Smyth GK (2015). limma powers differential expression analyses for RNA-sequencing and microarray studies. Nucleic Acids Res 43, e47. [DOI] [PMC free article] [PubMed] [Google Scholar]
- Rittirsch D, Flierl MA, and Ward PA (2008). Harmful molecular mechanisms in sepsis. Nat Rev Immunol 8, 776–787. [DOI] [PMC free article] [PubMed] [Google Scholar]
- Roers A, Siewe L, Strittmatter E, Deckert M, Schluter D, Stenzel W, Gruber AD, Krieg T, Rajewsky K, and Muller W (2004). T cell-specific inactivation of the interleukin 10 gene in mice results in enhanced T cell responses but normal innate responses to lipopolysaccharide or skin irritation. J Exp Med 200, 1289–1297. [DOI] [PMC free article] [PubMed] [Google Scholar]
- Schroder K, Hertzog PJ, Ravasi T, and Hume DA (2004). Interferon-gamma: an overview of signals, mechanisms and functions. J Leukoc Biol 75, 163–189. [DOI] [PubMed] [Google Scholar]
- Shah C, Hari-Dass R, and Raynes JG (2006). Serum amyloid A is an innate immune opsonin for Gram-negative bacteria. Blood 108, 1751–1757. [DOI] [PubMed] [Google Scholar]
- Swirski FK, and Nahrendorf M (2018). Cardioimmunology: the immune system in cardiac homeostasis and disease. Nat Rev Immunol 18, 733–744. [DOI] [PubMed] [Google Scholar]
- Takizawa H, Boettcher S, and Manz MG (2012). Demand-adapted regulation of early hematopoiesis in infection and inflammation. Blood 119, 2991–3002. [DOI] [PubMed] [Google Scholar]
- Truffa AA, Granger CB, White KR, Newby LK, Mehta RH, Hochman JS, Patel MR, Pieper KS, Al-Khalidi HR, Armstrong PW, and Lopes RD (2012). Serious infection after acute myocardial infarction: incidence, clinical features, and outcomes. JACC Cardiovasc Interv 5, 769–776. [DOI] [PMC free article] [PubMed] [Google Scholar]
- Urieli-Shoval S, Linke RP, and Matzner Y (2000). Expression and function of serum amyloid A, a major acute-phase protein, in normal and disease states. Curr Opin Hematol 7, 64–69. [DOI] [PubMed] [Google Scholar]
- Wei XQ, Charles IG, Smith A, Ure J, Feng GJ, Huang FP, Xu D, Muller W, Moncada S, and Liew FY (1995). Altered immune responses in mice lacking inducible nitric oxide synthase. Nature 375, 408–411. [DOI] [PubMed] [Google Scholar]
- Yasumoto M, Okamoto K, Sato T, Kurose M, Kukita I, and Morioka T (1994). Prognosis of critically ill patients with multiple organ failure. J Anesth 8, 269–273. [DOI] [PubMed] [Google Scholar]
- Yona S, Kim KW, Wolf Y, Mildner A, Varol D, Breker M, Strauss-Ayali D, Viukov S, Guilliams M, Misharin A, Hume DA, Perlman H, Malissen B, Zelzer E, and Jung S (2013). Fate mapping reveals origins and dynamics of monocytes and tissue macrophages under homeostasis. Immunity 38, 79–91. [DOI] [PMC free article] [PubMed] [Google Scholar]
Associated Data
This section collects any data citations, data availability statements, or supplementary materials included in this article.
Supplementary Materials
Data Availability Statement
Raw microarray data are available from Gene Expression Omnibus, Accession number GSE104342.