

Long thought to be invariant, proteome-wide amino acid exchangeabilities in evolution actually vary widely among species.
Abstract
Different amino acid pairs have drastically different relative exchangeabilities (REs), and accounting for this variation is an important and common practice in inferring phylogenies, testing selection, and predicting mutational effects, among other analyses. In all such endeavors, REs have been generally considered invariant among species; this assumption, however, has not been scrutinized. Using maximum likelihood to analyze 180 genome sequences, we estimated REs from 90 clades representing all three domains of life, and found numerous instances of substantial between-clade differences in REs. REs show more differences between orthologous proteins of different clades than unrelated proteins of the same clade, suggesting that REs are genome-wide, clade-specific features, probably a result of proteome-wide evolutionary changes in the physicochemical environments of amino acid residues. The discovery of among-clade RE variations cautions against assuming constant REs in various analyses and demonstrates a higher-than-expected complexity in mechanisms of proteome evolution.
INTRODUCTION
The 20 amino acids that make up all proteins differ to various degrees in physicochemical properties such as volume, charge, and hydrophobicity. Because of these chemical differences the evolutionary acceptability of amino acid changes varies depending on the amino acids involved. Let the relative exchangeability (RE) between a pair of amino acids be the fixation probability of mutations converting between these amino acids, relative to the average fixation probability of all amino acid–altering (i.e., nonsynonymous) mutations. Note that the RE values do not equal the elements but instead are important components of the commonly known amino acid transition matrices. More precisely, the relative mutation rate from one amino acid to another, multiplied by their RE, is the corresponding relative amino acid substitution rate in evolution, which is what transition matrices such as the 20 × 20 Dayhoff matrix (1) describe. In other words, transition matrices are determined jointly by mutation and selection, while REs specifically reflect selection. REs, along with the Dayhoff matrix or its modern versions (2–5), are widely used in identifying homologous proteins, aligning protein sequences, estimating genetic distances, reconstructing molecular phylogenies, choosing substitution models, detecting positive Darwinian selection, testing protein sequence convergence, and predicting mutational effects, among other things (6–11). Therefore, estimating and understanding REs are important both theoretically and practically.
Although the transition matrix can vary among evolutionary lineages as a result of shifts of mutational patterns that are often manifested by nucleotide or amino acid compositional changes (12, 13), REs are widely believed to be invariant among species and so are typically estimated using all proteins from all species in a database (1–5). Tang and colleagues pioneered the estimation of REs using genome-scale data from individual clades of species—primates, rodents, fruitflies, and yeasts (14). They estimated the 75 fixation probabilities for the 75 amino acid pairs mutually reachable by a single nucleotide mutation. They reported that the fixation probabilities respectively estimated from the four clades aforementioned are overall highly correlated (Pearson’s r = 0.78 to 0.91) and noted that the relatively low correlations between some clades may be due to the relatively small numbers of genes used in the estimation. However, they did not test whether REs differ significantly between any pair of clades. It is also unknown whether the level of variation in REs among the four clades is representative of all clades across the tree of life. Here, we use 180 genome sequences to estimate REs from a total of 90 clades throughout the three domains of life. We report unexpectedly large and statistically significant RE variations among clades, offer a mechanistic explanation of this phenomenon, and discuss its implications.
RESULTS
Likelihood estimation of REs is reliable
We used a codon-based maximum likelihood (ML) method implemented in Phylogenetic Analysis by Maximum Likelihood (PAML) (15) to estimate REs. The codon model used (16) is as follows
| (1) |
Here, quv is the rate of substitution from codon u to v, πv is the equilibrium frequency of the resultant codon v, summarized into vector π, κ is the mutational transition/transversion rate ratio, and ωij is the fixation probability of mutations converting codon u to v when u and v respectively code for amino acid i and j ≠ i, relative to the fixation probability of synonymous mutations. In this model, ωij exists only if amino acids i and j are mutually reachable by a single nucleotide change; hence, ωij’s form a vector ω with 75 elements under the standard genetic code. The 75 REs are estimated by dividing the corresponding ωij by ω, which is the overall fixation probability of nonsynonymous mutations relative to that of synonymous mutations. The above model can also be described by substituting ωij with ωREij, where REij is the RE between amino acids i and j. Note that both the vector ω and the scalar ω are average values across all codon sites in an alignment, and the same applies to REs.
To examine whether the ML estimates of REs are reliable, we conducted a computer simulation. Specifically, we simulated the evolutionary divergence of coding sequences between a pair of taxa following the codon model in Eq. 1, using a set of realistic parameters referred to as parameter set A, including REs, ω, π, κ, the number of substitutions per codon between the two taxa (i.e., genetic distance), and the total sequence length (see Materials and Methods and data file S1). We then used PAML to estimate ωij’s, which allowed the inference of REs. We repeated the simulation and estimation 100 times, and found that the 75 REs estimated from the simulated sequences are highly correlated with the REs specified in the simulation, with Pearson’s correlation r > 0.99 in every replicate (scheme I in Fig. 1A). To examine the generality of this finding, we used another set of realistic parameters (set B) to simulate sequences. Parameters REs, ω, π, and κ differ between the two sets. For instance, the REs in the two sets are only weakly correlated (r = 0.47). Under parameter set B, REs specified in the simulation and inferred from the simulated sequences are also highly correlated, with r > 0.99 in all 100 replicates (scheme II in Fig. 1A). To investigate whether parameters other than REs and ω affect RE estimation, we simulated sequence evolution using π and κ from parameter set A but REs and ω from parameter set B. We found that the estimated REs are highly correlated with those specified in the simulation (r > 0.99 in all 100 replicates; scheme III in Fig. 1A). Similar results were obtained when we simulated sequence evolution using π and κ from parameter set B but REs and ω from parameter set A (r > 0.99 in all 100 replicates; scheme IV in Fig. 1A). These results suggest that ML estimates of REs are generally accurate and unaffected by variations of other parameters.
Fig. 1. Simulations demonstrate the accuracy of ML estimates of amino acid REs.
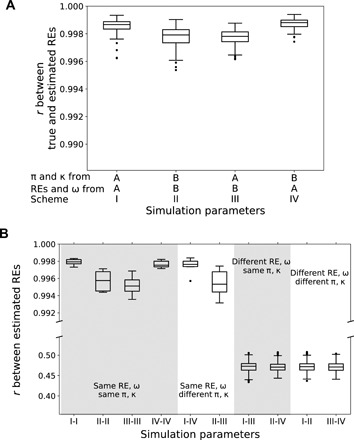
(A) Pearson’s correlation (r) between estimated REs and the true values specified in simulations. The source of simulation parameters for each column is labeled below the x axis, where A and B refer to two different parameter sets (see the main text). There are 100 simulation replicates per column, represented by a boxplot. (B) Pearson’s correlation (r) between REs respectively estimated from two simulated clades. Parameters specified in the simulation of each of the two clades, presented below the x axis, correspond to the schemes described in (A). From the 10,000 combinations of the 100 replicates of one scheme and the 100 replicates of another scheme, 1000 are randomly sampled and a boxplot of these 1000 r’s is plotted. In both panels, the lower and upper edges of a box represent the first (qu1) and third (qu3) quartiles, respectively, the horizontal line inside the box indicates the median (md), and the whiskers extend to the most extreme values inside inner fences, md ± 1.5(qu3 − qu1), and dots show outliers.
Because our objective is to test the constancy of REs across clades, we further used computer simulation to investigate the suitability of the ML method for comparing REs respectively estimated from two clades, each composed of two taxa. We found that when the same REs (and ω) are used in the simulation of the two clades, regardless of whether π and κ are the same (first four columns in Fig. 1B) or different (fifth and sixth columns in Fig. 1B) in the two clades, the two sets of estimated REs always have high correlations, with r > 0.99 in all 100 simulation replications under each parameter set. By contrast, when REs from the two parameter sets are respectively used in the simulation of the two clades, regardless of whether π and κ are the same (seventh and eighth columns in Fig. 1B) or different (last two columns in Fig. 1B), the two sets of estimated REs are only weakly correlated, with r around the true value of 0.47 in the vast majority of simulation replications. These results indicate that the ML estimator is powerful and suitable for our study. Furthermore, we found that incorporating in our simulation a gamma distribution of among-site variation in substitution rate does not alter the above conclusion (fig. S1).
REs vary substantially among clades
Now that we have verified the reliability of the ML estimator, we applied this method to 90 clades, each represented by an alignment of concatenated coding sequences of all one-to-one orthologous genes from the genomes of two relatively closely related species or strains. For example, human and macaque are used to represent the primate clade, whereas mouse and rat are used to represent the rodent clade. The 90 clades cover 15 lineages in Eukarya (including six in vertebrates, two in insects, two in fungi, three in plants, and two in protozoa), 6 lineages in Archaea, and 69 diverse lineages in Bacteria (table S1). Figure 2A shows the comparison of REs estimated respectively from the primate clade (Homo sapiens and Macaca mulatta) and fruitfly clade (Drosophila sechellia and Drosophila simulans). While these two sets of REs are significantly positively correlated (r = 0.47, P < 2 × 10⁻⁵; Spearman’s rank correlation ρ = 0.61, P < 6 × 10⁻⁹), differences in some REs are clearly visible (e.g., between amino acids H and R; Fig. 2A). In addition, in fruitflies, the amino acid pair K-R has the highest RE, while in primates, the pair with the highest RE is T-M. This type of discordance is abundantly observed across the 90 clades surveyed, as shown in Fig. 2B, where each row presents the ranks of the 75 REs from each clade. If an amino acid pair has the same RE rank in all clades, we should see only one color for the column of the amino acid pair. By contrast, we observe multiple colors in every column. For instance, the amino acid pair I-R has the second lowest RE (0.13) in the clade of two bacteria, Thermoanaerobacterium xylanolyticum and Thermoanaerobacterium thermosaccharolyticum, but the second highest RE (5.0) in the clade of Phytophthora infestans and Phytophthora parasitica. For an average amino acid pair, the highest and lowest ranks in RE across the 90 clades differ by 50, demonstrating considerable variations in REs among clades.
Fig. 2. REs estimated from different clades vary greatly.
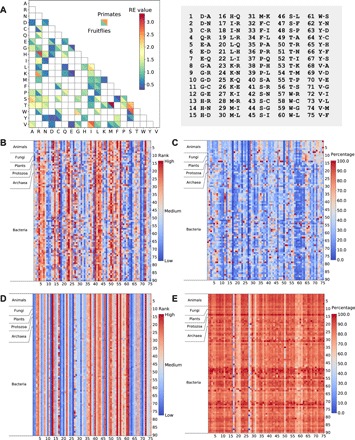
(A) Comparison between the 75 REs respectively estimated from the primate clade and fruitfly clade. Each square shows the primate RE (upper right triangle) and fruitfly RE (lower left triangle) between the amino acid indicated on the x axis and that on the y axis. On the right-hand side of the panel are indices for the 75 amino acid pairs shown on the x axis of (B) to (E). (B) Within-clade ranks of the 75 REs estimated from 90 clades across the tree of life. Each row represents a clade, while each column represents one amino acid pair. Higher ranks mean larger RE values. (C) REs as percentages of the largest RE of the amino acid pair among the 90 clades. (D) Within-clade ranks of the 75 REs estimated from data simulated using the primate REs and ω along with other clade-specific parameters for all clades. (E) REs presented as percentages of the largest RE of the amino acid pair among all clades, estimated from the data simulated using the primate REs and ω along with other clade-specific parameters for all clades.
Although the RE rank for an amino acid pair may vary among clades, this rank variation provides no information about the magnitude of the change in the RE value. To investigate the extent of among-clade variation in RE values, we identified the maximal RE for each amino acid pair among all clades and presented the RE of the amino acid pair for each clade as a percentage of this maximal value (Fig. 2C). For example, for the amino acid pair V-F, the lowest RE, in the clade of two Lactobacillus bacteria (Lactobacillus rhamnosus and Lactobacillus paracasei), is only 15.1% of the highest value, which occurs in the primate clade (H. sapiens and M. mulatta). Because each column has at least one red cell (representing the maximal RE), the observation of blue cells (<40% of the maximal RE) in most columns of Fig. 2C indicates that the numerical values of REs vary considerably among clades for most amino acid pairs.
To verify that the above variations do not simply reflect sampling errors of RE estimates owing to small sample sizes for some amino acid pairs, we simulated sequence evolution for each of the 90 clades using all parameters estimated from the respective clade concerned except for REs and ω, which were always estimated from the primate clade. We then estimated REs from the simulated sequences of each clade. This result serves as a negative control, because, although other parameters of simulation vary among clades, we do not expect to see a drastic variation in the estimated REs if the true REs used in the simulation are all the same. The results are presented in Fig. 2 (D and E), analogous in organization to Fig. 2 (B and C), respectively. For REs estimated from these simulated data, the rankings are more uniform (Fig. 2D), and the relative values are also more similar (Fig. 2E) across different clades. Furthermore, when the simulation is conducted with all clade-specific parameters (including ω) except that only REs are always from primates, the estimated REs from different simulated clades remain similar (fig. S2, A and B). As a positive control, we simulated the sequences of each of the 90 clades using all parameters estimated from the clade itself and then estimated REs from the simulated sequences. As expected, the outcomes (fig. S2, C and D) are similar to those in Fig. 2 (B and C) and are more heterogeneous than those in the negative controls (Fig. 2, D and E, and fig. S2, A and B). These controls indicate that when and only when different REs are specified in the simulation of the 90 clades do the estimated REs show substantial among-clade variations. In other words, they indicate that REs of the actual data genuinely vary greatly among clades.
Shuffling codons between clades tests the significance of RE differences
Although we have shown substantial variations of RE estimates among clades, we have not offered a formal statistical test demonstrating that this variation is significantly larger than expected by chance for any pair of clades compared; the relevance of the simulation used above depends on the assumption that the model and associated parameters used in the simulation mimic actual evolution. Here, we develop a shuffling scheme to statistically test RE differences between clades, without making the above assumption. For two pairwise alignments respectively corresponding to two clades, one species per clade is arbitrarily designated taxon 1 while the other is designated taxon 2. For each clade, a codon position is classified into 20 groups according to the amino acid encoded by the codon in taxon 1. Within each group, a codon position is further classified into the nonsynonymous, synonymous, or invariant subgroup if the two taxa have nonsynonymous difference(s), have synonymous but no nonsynonymous difference(s), or have no difference at the codon position, respectively. Codon positions in the two alignments that belong to the same group and subgroup are randomly shuffled. For example, a codon site occupied by CTT (L) in human and CCT (P) in macaque (a nonsynonymous site for leucine) may be exchanged with a codon site occupied by CTA (L) in mouse and GTA (V) in rat (also a nonsynonymous site for leucine), where human and mouse are the designated taxon 1 in the primate clade and rodent clade, respectively. This way, amino acid substitutions and associated REs are randomized between the two clades, whereas other properties such as amino acid frequencies remain largely unaltered because most codon positions are either synonymous or invariant and because shuffling occurs within the same group and subgroup. If the original REs of the two clades are the same, shuffling will not increase their similarity. If the original REs are significantly different between the two clades, we expect the two sets of REs estimated after shuffling to show a higher correlation with each other than before shuffling.
To verify the reliability of the shuffling test, we performed the test on the simulated sequence alignments analyzed in Fig. 1A. We chose 10 simulated alignments under each simulation scheme (I to IV) and performed the shuffling test for all pairs of the 40 simulated clades. The null hypothesis of equal REs should not be rejected for clade pairs simulated with the same REs but should be rejected for clade pairs simulated with different REs. For instance, comparing an alignment simulated under scheme I with that simulated under scheme IV in Fig. 1A should show no significant difference in estimated REs because they were simulated using the same set of REs. Our shuffling test found this to be the case (Fig. 3). Specifically, for each comparison, the blue color code indicates the frequency with which the RE correlation between two clades is higher after shuffling than before shuffling. The darker the blue hue, the greater the frequency. If our test is unbiased, most comparisons between clade pairs simulated using the same REs should show some bluish color, because the RE correlation before shuffling should fall within the distribution of the RE correlation after shuffling, which is the case when two clades are simulated under the same set of all parameters (I versus I, etc., triangle blocks along the diagonal line). The block comparing scheme I versus scheme IV and that comparing scheme II versus scheme III are white (Fig. 3), suggesting that our test is conservative. By contrast, our test should find REs significantly different in the comparison between alignments simulated under scheme I versus scheme III. This is indeed true in each of the 100 comparisons attempted (the upper left deep blue block in Fig. 3). Similar results were obtained in the comparison between alignments simulated under scheme II versus scheme IV, scheme I versus scheme II, and scheme III versus scheme IV (the other three deep blue blocks in Fig. 3). Hence, despite its conservativeness on negative controls, our shuffling test has power to reject erroneous null hypotheses of equal REs when they are sufficiently different such as in Fig. 2A.
Fig. 3. Performance of the shuffling test in simulated data.
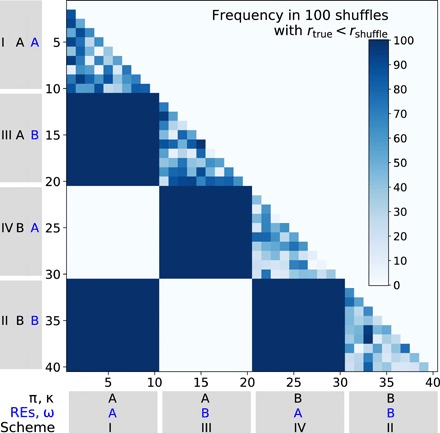
Each cell shows a shuffling test result that indicates by color the number of times that Pearson’s correlation coefficient between estimated REs of the two simulated clades compared (rtrue) is smaller than that between REs estimated from randomly shuffled alignment pairs (rshuffle) in 100 shuffles. Labels on the x and y axes refer to the simulation schemes specified in Fig. 1A. Ten simulation replicates per scheme are analyzed.
REs are significantly different between many clades
After verifying the performance of the shuffling test, we applied it to all 4005 pairs of the 90 clades and found REs to be significantly different at the nominal P value of 0.01 for 3450 clade pairs (86.1%, Fig. 4A). As expected, statistical significance is enriched among clade pairs with low RE correlations (P value < 3 × 10−179, Mann-Whitney U test between RE correlation coefficients of significant clade pairs and those of nonsignificant clade pairs; fig. S3). Because 40.05 tests are expected to be significant at this P value by chance, our observation of thousands of significant tests suggests genuine variations in REs among clades. However, because clade pairs are not independent from one another, we performed a negative control experiment to ensure that the above conclusion is valid. Specifically, we performed the shuffling test to all 4005 clade pairs when each clade is simulated with the primate REs and ω along with other clade-specific parameters, and only 19 clade pairs showed significantly different REs (Fig. 4B), equivalent to a 0.5% false-positive rate. In addition, the RE correlations are around or even below zero for many clade pairs in the real data (reflected by white or even light blue hues in the upper right half of the heatmap in Fig. 4A), whereas this is not the case in the simulated data (see the upper right half of the heatmap in Fig. 4B). These results from the negative control verify that the vast majority of significant RE variations in Fig. 4A are true.
Fig. 4. Shuffling tests of RE differences between clades.
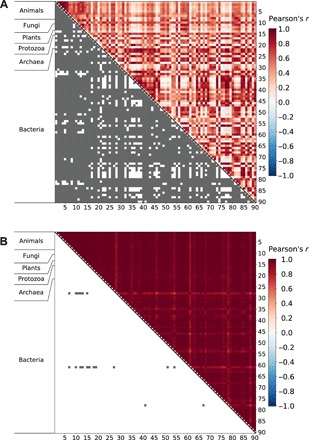
(A) Many clade pairs show significant RE differences in real data. (B) Few clade pairs show significant RE differences in negative control data simulated using the primate REs and ω along with other clade-specific parameters for all clades. In each panel, both axes indicate the 90 clades analyzed. Each cell in the upper right triangle shows Pearson’s r between the REs of the two clades compared, with the color scale for r provided on the right side of the figure. Each cell in the lower left triangle indicate a shuffling test result; tests with nominal P < 0.01 (i.e., observed RE correlation is lower than that in each of the 100 shuffled alignment pairs) are indicated by gray color.
Several types of amino acid substitutions are rare in evolution and hence may differ in frequency between two clades simply by chance. In our data, amino acid substitutions between W and C, between W and S, between W and G, and between W and R have <10 observed cases in 43, 28, 19, and 18 clades, respectively. To exclude the possibility that the significant shuffling test results are entirely due to these rare substitution types, we recalculated the RE correlations before and after shuffling upon the exclusion of these four amino acid pairs. Of the 3450 clade pairs with significantly different REs in the original analysis, the RE differences remain significant for 3429 pairs. Hence, the rare types of amino acid substitutions do not explain the prevalence of RE variations among clades.
Significant between-clade RE differences abound even for orthologs
The coding sequence alignment of each clade contains all orthologous nuclear genome-encoded proteins between the two taxa compared. However, each clade may have clade-specific proteins such that the REs of two clades may not have been estimated from the common set of proteins. To investigate whether the existence of clade-specific proteins is the cause of significant RE differences between clades, we analyzed only shared proteins between clades. Specifically, we compared the primate clade of human and macaque with 10 other mammalian clades retrieved from OrthoMaM (17) to ensure the presence of sufficiently large sets of orthologs between clades (table S2). For each pair of clades, we identified one-to-one orthologous proteins between the two clades and estimated REs from each clade using only these proteins. In all 10 comparisons, REs of different clades are significantly different (Fig. 5A), indicating that even orthologous proteins show different REs in different clades.
Fig. 5. REs are genome-wide and clade specific.
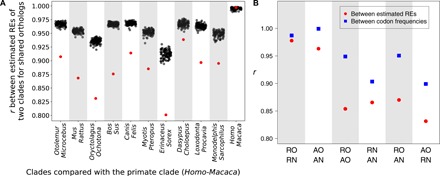
(A) Shuffling tests for equal REs between the primate clade and each of 10 other mammalian clades for orthologs shared between the two clades. Note that the scale of the y axis is from 0.8 to 1.0. Each column is a shuffling test, with the red dot indicating Pearson’s correlation coefficient (r) between the REs estimated from the two clades compared and the 100 gray dots representing r’s between the REs estimated from 100 shuffled alignment pairs. A significantly smaller r than the random expectation at the nominal P value of 0.01 is found for each column except the last, which is a negative control of the shuffling test between the primate clade and itself. Labels on the x axis indicate the two taxa in each clade compared with the primate clade (table S2). (B) Correlations of REs and codon frequencies between different genomic parts of the rodent clade and avian clade. Labels on the x-axis indicate the two genomic parts compared: orthologs and non-orthologs between the two clades compared. RO, rodent orthologs; RN, rodent non-orthologs; AO, avian orthologs; AN, avian non-orthologs.
The above results suggest that REs may be clade-specific features that apply to the proteome as a whole. To test this hypothesis, in a comparison between two clades, we separated the genes from each clade into two categories: those with orthologs (group O) and those without orthologs (group N) in the other clade. As an example, we compared the rodent clade (R) of mouse and rat with the avian clade (A) of chicken and turkey (see Materials and Methods). Hence, we have four groups of proteins forming four alignments: rodent orthologs (RO), rodent non-orthologs (RN), avian orthologs (AO), and avian non-orthologs (AN). We found that the correlation in RE between RO and RN (rRO-RN) is 0.98, while rAO-AN is 0.96 (Fig. 5B). By contrast, correlation between the orthologous genes of the two clades (rRO-AO) is only 0.85, similar to that between nonorthologous genes of the two clades (rRN-AN = 0.87; Fig. 5B). That REs are more similar between different genes in the same genome than the same genes in different genomes confirms the existence of genome-specific REs. Amino acid and codon usages are known to be genome-specific features (18–20). When a similar analysis is performed on codon frequencies of the above four groups of genes, we found that different genes in the same genome share more similar codon frequencies (rRO-RN = 0.99, rAO-AN > 0.99; Fig. 5B) than the same genes from different genomes (rRO-AO = 0.95, rRN-AN = 0.90; Fig. 5B). Thus, the genome specificity of REs is analogous to that of codon frequencies.
Between-clade differences in RE estimates are not artifacts of nonstationary evolution
To investigate the underlying mechanism of the among-clade RE variations, we first examined whether this phenomenon is an artifact of using a time-reversible codon substitution model in the ML estimation of REs when there are systematic changes in codon frequencies within a clade (i.e., disequilibrium). Specifically, for each clade, we respectively estimated codon frequencies from each of the two sequences in the alignment. We then generated a random coding sequence according to the mean codon frequencies of the two sequences. We separately evolved this sequence along two equal-length branches, under Markov models where the equilibrium codon frequencies equal the observed codon frequencies from the two extant sequences, respectively. Primate REs and ω were used in the simulation of the clade. This was done for all 90 clades, followed by estimation of REs from each simulated clade. We found that the variations in RE rank and percentage among the 90 simulated clades are minimal (fig. S4, A and B), resembling those in the negative control mentioned (Fig. 2, D and E). Shuffling tests were conducted on the simulated data for all 4005 clade pairs, but only 11 tests (0.3%) were significant, demonstrating that codon frequency disequilibria within clades cannot explain significant between-clade differences in the estimated REs.
Proteome-wide changes in physicochemical environments of amino acid residues?
Although codon and amino acid frequencies vary among genomes (and clades), these variations per se cannot explain RE variations. This is because any amino acid or codon frequency variation, be it caused by mutation or selection, is taken care of by the equilibrium frequencies πv in our model specified by Eq. 1. For example, 5′-C-phosphate-G-3′ (CpG) hypermutability may drive amino acid composition evolution (21). To investigate whether this factor explains the observed RE variation among clades, we separated the 75 categories of amino acid changes into two groups: the “CpG group” where an amino acid change can be caused by CpG changes and the “non-CpG group” including all remaining categories. We calculated the mean RE ranks of each category in 12 clades that have putative CpG hypermutability (21) and found that the mean RE ranks of the CpG group are not significantly higher than those of the non-CpG group (P = 0.3, Mann-Whitney U test). Furthermore, clade pairs with significant RE differences do not preferentially contain one clade with CpG hypermutability and one without (P = 0.15, Fisher’s exact test). Thus, we confirmed empirically that CpG hypermutability in certain clades cannot explain our observed RE differences between clades.
Mutational bias is likely more complex than what Eq. 1 describes. Although the altered equilibrium codon frequencies caused by any mutational bias are dealt with by Eq. 1, the mutational bias itself may not be. To examine whether mutational biases that are not modeled by Eq. 1 could explain our observation, we simulated the 90 clades using primate REs and ω along with other clade-specific parameters while setting the mutation rate between C and T twice that between A and G. In other words, the two types of transitional mutations now have different rates. We then estimated REs from the 90 clades using Eq. 1 but found only 11 of 4005 clade pairs (0.3%) to have significantly different REs. Other mutation biases are in principle similar to the one above examined. Thus, mutational biases unmodeled by Eq. 1 are unlikely to be responsible for the observed pervasive among-clade RE variations. This is probably because the main impact of any mutational bias is on equilibrium codon frequencies, which are already taken care of in RE estimation.
The RE variation among clades must be caused by an evolutionary change in a property of amino acid pairs rather than that of individual amino acids. One possibility is that, changes in amino acid frequencies or other proteomic characteristics lead to a proteome-wide alteration in the physicochemical environment of amino acid residues such that two amino acids that are sensed by natural selection to be similar enough in one clade become too different to be exchangeable in another clade. For instance, proteins may be generally more compact in one clade than in another. As a result, amino acid pairs having relatively large size differences are more likely to show lower REs in the first clade than in the second clade, when compared with amino acid pairs having relatively small size differences. However, because we generally do not know overall protein compactness (or other properties) in each species, we could only test whether groups of amino acid pairs, each with relatively large physicochemical differences, show more consistent RE differences (in terms of sign) between two clades than groups with relatively small physicochemical differences. To this end, we define for a group of n amino acid pairs the RE bias between clade A and clade B by , where I is the indicator function, which is equal to 1 when the condition in the parentheses is met and 0 otherwise. A large RE bias indicates that the focal group of amino acid pairs have consistently lower RE values in one clade than the other. For instance, we categorized the 75 amino acid pairs into two groups: The “changed” group includes pairs with different amino acid volumes, while the “unchanged” group includes the rest. Across the 4005 clade pairs examined, the changed group of amino acid pairs generally shows a higher RE bias than the unchanged group (Fig. 6, A and B). A similar trend is observed when we categorize amino acid pairs by a change in amino acid polarity (Fig. 6, A and C), but the trend becomes less clear when we categorize amino acid pairs by a change in amino acid charge (Fig. 6, A and D). Because the dominating physicochemical factor influencing amino acid substitutions may vary among clades, for each specific property considered, the RE bias for the changed group is not expected to be larger than that for the unchanged group in every clade, as is observed (Fig. 6, B to D). These results support our hypothesis that amino acid substitutions involving large physicochemical changes are sensitive to the ambient environment such that proteome-wide changes in physicochemical environments can contribute to the observed RE variations.
Fig. 6. RE bias between clades is greater for amino acid pairs that involve physicochemical property changes than those that do not involve such changes.
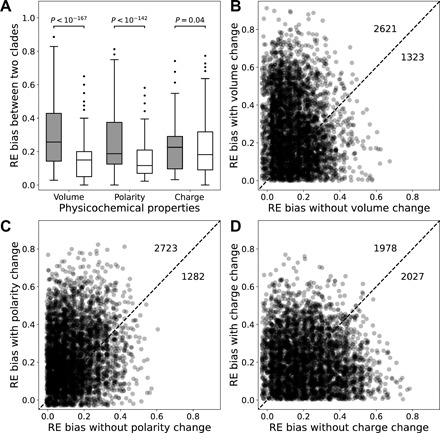
(A) Boxplots of RE bias (see the main text for definition) of the group of amino acid pairs with (gray) and without (white) changes in the amino acid property indicated. The lower and upper edges of a box represent the first (qu1) and third (qu3) quartiles, respectively; the horizontal line inside the box indicates the median (md), the whiskers extend to the most extreme values inside inner fences, md ± 1.5(qu3 − qu1), and the dots indicate outliers. Data in gray are significantly greater than those in white for each property (P values are from Mann-Whitney U test). (B to D) RE bias of groups of amino acid pairs with and without volume (B), polarity (C), and charge (D) changes for each of the 4005 clade pairs. Each dot represents one clade pair. A uniform noise between −0.03 and 0.03 was added to all RE bias values in (B) to (D) to enhance readability of the figure. The dashed line indicates y = x, while numbers above and below the diagonal indicate numbers of dots residing in corresponding regions before the addition of the random noise.
DISCUSSION
In this study, we adopted a likelihood method to estimate REs between amino acids from pairs of genome sequences and found significant and substantial RE variations across the tree of life. Using a series of negative and positive controls, we demonstrated that our RE estimates are reliable and that the revealed RE variations are genuine.
Why do REs vary among species? Because each amino acid site in the proteome of a species has a virtually unique environment (e.g., specific adjacent amino acid residues, interacting molecules, and physicochemical microenvironment), it is expected that the REs vary among amino acid sites. However, the RE for an amino acid pair is estimated by averaging across a large number of sites and hence is not expected to vary among species unless the mean RE of the amino acid pair is truly different among species. In other words, our results indicate the existence of genome-wide, clade-specific REs, a phenomenon analogous to the well-documented among-species variations in genomic GC (guanine and cytosine) content and codon usage (8). While the latter phenomena are known to have resulted from variations in mutational and potentially selectional patterns across species, among-clade variations in REs are by definition caused by selectional differences. That is, the mechanism of proteome evolution varies across lineages. This interpretation is supported by the observation that REs are more similar between unrelated proteins of the same clade than between orthologous proteins of different clades.
We hypothesized and provided evidence that RE variations are at least in part caused by proteome-wide alterations of physicochemical environments of amino acid residues such that some but not all amino acid pairs become less exchangeable in one clade than in another. Such proteome-wide alterations of physicochemical environments could be a consequence of changes of proteomic characteristics. For example, proteins are generally more compact with denser salt bridges in thermophilic organisms than in mesophilic organisms (22, 23), which potentially affects the physicochemical environments of amino acid residues. This said, the exact mechanisms underlying the landscape of RE variation require further investigations, similar to the situation for genomic GC content (24–31) and codon usage (18–20, 32–37) variations with regard to their potential selecting agents. Recent analyses of a few plant and animal clades suggested that a shift in positive selection (e.g., because of an environmental change) is more likely than that in negative selection to create RE differences among lineages (38, 39). It will be interesting to test this hypothesis in additional lineages, especially unicellular organisms.
The revelation of genome-wide, clade-specific REs means that different REs may need to be considered for different species in the numerous analyses that depend on REs. As mentioned in Introduction, these analyses include many that are fundamental to molecular evolutionary research. To what extent the consideration of among-lineage variations in REs affects the conclusions of many published studies and future researches that rely on REs awaits exploration.
MATERIALS AND METHODS
Sequence data acquisition and alignment
Sequence data used were retrieved from various sources listed in table S1. Coding sequence alignments of four mammalian clades, fruitflies, and yeasts were directly retrieved from respective databases. For each of the other eukaryotic clades, we queried in Ensembl (https://useast.ensembl.org/index.html) a list of all one-to-one orthologous genes for the pair of species and downloaded their coding sequences. The coding sequences were translated to protein sequences using Multiple Alignment of Coding Sequences (MACSE) v1.02 (40). Local pairwise protein sequence alignment was performed for each pair of orthologs by Multiple Alignment using Fast Fourier Transform (MAFFT) v7.294b (41) using the L-INS-i algorithm. The corresponding coding sequence alignment was then derived using a custom Python script. All prokaryotic clades were sampled from the strains available in the Alignable Tight Genomic Clusters (ATGC) database (42). All alignments were filtered so that no gaps, missing data, or ambiguous codons exist. The alignments and relevant Python scripts have been deposited to GitHub (https://github.com/ztzou/REvariation).
For the analyses of orthologous versus nonorthologous genes between the rodent clade and the avian clade, we downloaded all coding sequences of mouse, rat, chicken, and turkey from Ensembl 84. In each species, the longest transcript of each gene was retained for subsequent analysis. We then obtained from Ensembl a list of one-to-one orthologs between mouse and rat, a list of one-to-one orthologs between chicken and turkey, and a list of one-to-one orthologs between mouse and chicken. We compared REs respectively estimated from four groups of genes: RO, AO, RN, and AN. RO refers to the group of genes that appear on both the first and third lists. AO refers to the group of genes that appear on both the second and third lists. RN refers to the group of genes that appear on the first list but not on the third list. AN refers to the group of genes that appear on the second list but not on the third list.
ML estimation of model parameters
For each alignment of two coding sequences, the program codeml in PAML4.9 was used to estimate ω under a user tree of two taxa, free parameters of individual codon frequencies, free parameter of κ, NSsites = 0, and no constraint of molecular clock. The control parameter aaDist was set to be 7 to allow the estimation of 75 individual ωij values.
Simulation of coding sequence evolution
All simulations followed the Markovian codon substitution model specified in Eq. 1 (43). To simulate a clade with a pair of taxa, a 61 × 61 transition matrix P(t) was first derived. For each pair of codons, the instantaneous substitution rate q was set as in Eq. 1, according to the REs, ω, π, and κ specified. The rate matrix Q was normalized to have a total rate of 1, and the transition matrix P(t) was equal to eQt (43). For each codon to be simulated, an ancestral codon was chosen randomly according to the equilibrium codon frequencies and then was subject to evolution under a Markov process xt = x0 · P(t), based on the specified genetic distance t and the transition matrix P(t). Two descendant codons were generated respectively for the pair of taxa, sampled from the “evolved” probability distribution xt. Parameters REs, ω, π, and κ used in the simulations of Fig. 1 were estimated from either the primate clade (parameter set A) or the fruitfly clade (set B). In Figs. 1 and 3, the sequence length was 5,000,000 codons, and the genetic distance between the sequences was 0.1 substitution per codon. The real sequence lengths and inferred genetic distances were used in simulations related to Figs. 2 (D and E) and 4B and figs. S2 and S4. All codons had the same evolutionary rate in simulation unless mentioned. When site-specific relative evolutionary rates were used (fig. S1), the relative rates were sampled from a gamma distribution with the shape parameter of 1. Parameters REs, ω, π, κ, genetic distance, and coding sequence length estimated for each of the 90 clades are listed in data file S1 and were used in the aforementioned simulations. Python scripts for deriving the transition matrix and for sequence simulation can be accessed from GitHub (https://github.com/ztzou/REvariation).
Amino acid classifications by physicochemical properties
Amino acid classifications by physicochemical properties follow Zhang (44). On the basis of charge, amino acids were classified into three groups: positively charged (R, H, and K), negatively charged (D and E), and neutral (A, N, C, Q, G, I, L, M, F, P, S, T, W, Y, and V). On the basis of polarity, amino acids were classified into two groups: polar (R, N, D, C, Q, E, G, H, K, S, T, and Y) and nonpolar (A, I, L, M, F, P, W, and V). On the basis of volume, amino acids were classified into three groups: small (A, G, P, S, T, N, D, Q, E, I, L, M, and V), large (R, H, K, F, W, and Y), and special (C).
Data and program availability
All sequence alignments and computer programs associated with this work are available at GitHub (https://github.com/ztzou/REvariation).
Supplementary Material
Acknowledgments
We thank A. Eyre-Walker, W.-C. Ho, D. Jiang, M. Sun, J. Xu, and J.-R. Yang for valuable comments. Funding: This work was supported by National Institutes of Health research grant R01GM120093 to J.Z. Author contributions: Z.Z. and J.Z. designed the research and wrote the paper. Z.Z. conducted the research and analyzed the data. Competing interests: The authors declare that they have no competing interests. Data and materials availability: All data needed to evaluate the conclusions in the paper are present in the paper, the Supplementary Materials, and/or Github (https://github.com/ztzou/REvariation). Additional data related to this paper may be requested from the authors.
SUPPLEMENTARY MATERIALS
Supplementary material for this article is available at http://advances.sciencemag.org/cgi/content/full/5/12/eaax3124/DC1
Data file S1. Parameters estimated from each of the 90 clades and used in various simulations.
Fig. S1. Simulations demonstrate the accuracy of ML estimates of amino acid REs.
Fig. S2. REs estimated from 90 clades respectively simulated using clade-specific parameters unless specified.
Fig. S3. Frequencies of between-clade RE correlations for clade pairs that show significant (orange, 3450 pairs) or nonsignificant (gray, 555 pairs) RE differences.
Fig. S4. REs respectively estimated from 90 clades simulated under nonstationary evolution of codon frequencies within clades (see the main text).
Table S1. Taxon composition and data source of all 90 clades for which relative amino acid exchangeabilities (REs) are estimated.
Table S2. Ten pairs of mammalian clades whose amino acid REs are compared for orthologous coding sequences.
REFERENCES AND NOTES
- 1.M. O. Dayhoff, R. Schwartz, B. C. Orcutt, in Atlas of Protein Sequence and Structure, M. O. Dathoff, Ed. (National Biomedical Research Foundation, 1978), pp. 345–352. [Google Scholar]
- 2.Jones D. T., Taylor W. R., Thornton J. M., The rapid generation of mutation data matrices from protein sequences. Comput. Appl. Biosci. 8, 275–282 (1992). [DOI] [PubMed] [Google Scholar]
- 3.Le S. Q., Gascuel O., An improved general amino acid replacement matrix. Mol. Biol. Evol. 25, 1307–1320 (2008). [DOI] [PubMed] [Google Scholar]
- 4.Whelan S., Goldman N., A general empirical model of protein evolution derived from multiple protein families using a maximum-likelihood approach. Mol. Biol. Evol. 18, 691–699 (2001). [DOI] [PubMed] [Google Scholar]
- 5.Henikoff S., Henikoff J. G., Amino acid substitution matrices from protein blocks. Proc. Natl. Acad. Sci. U.S.A. 89, 10915–10919 (1992). [DOI] [PMC free article] [PubMed] [Google Scholar]
- 6.Tang H., Wu C. I., A new method for estimating nonsynonymous substitutions and its applications to detecting positive selection. Mol. Biol. Evol. 23, 372–379 (2006). [DOI] [PubMed] [Google Scholar]
- 7.Zhang J., Kumar S., Detection of convergent and parallel evolution at the amino acid sequence level. Mol. Biol. Evol. 14, 527–536 (1997). [DOI] [PubMed] [Google Scholar]
- 8.D. Graur, A. K. Sater, T. F. Cooper, Molecular and Genome Evolution (Sinauer Associates, Inc., 2016). [Google Scholar]
- 9.M. Nei, S. Kumar, Molecular Evolution and Phylogenetics (Oxford Univ. Press, 2000). [Google Scholar]
- 10.Altschul S. F., Gish W., Miller W., Myers E. W., Lipman D. J., Basic local alignment search tool. J. Mol. Biol. 215, 403–410 (1990). [DOI] [PubMed] [Google Scholar]
- 11.Ng P. C., Henikoff S., Predicting the effects of amino acid substitutions on protein function. Annu. Rev. Genomics Hum. Genet. 7, 61–80 (2006). [DOI] [PubMed] [Google Scholar]
- 12.Abascal F., Posada D., Zardoya R., MtArt: A new model of amino acid replacement for arthropoda. Mol. Biol. Evol. 24, 1–5 (2007). [DOI] [PubMed] [Google Scholar]
- 13.Feuda R., Dohrmann M., Pett W., Philippe H., Rota-Stabelli O., Lartillot N., Wörheide G., Pisani D., Improved modeling of compositional heterogeneity supports sponges as sister to all other animals. Curr. Biol. 27, 3864–3870.e4 (2017). [DOI] [PubMed] [Google Scholar]
- 14.Tang H., Wyckoff G. J., Lu J., Wu C. I., A universal evolutionary index for amino acid changes. Mol. Biol. Evol. 21, 1548–1556 (2004). [DOI] [PubMed] [Google Scholar]
- 15.Yang Z., PAML 4: Phylogenetic analysis by maximum likelihood. Mol. Biol. Evol. 24, 1586–1591 (2007). [DOI] [PubMed] [Google Scholar]
- 16.Yang Z., Nielsen R., Hasegawa M., Models of amino acid substitution and applications to mitochondrial protein evolution. Mol. Biol. Evol. 15, 1600–1611 (1998). [DOI] [PubMed] [Google Scholar]
- 17.Douzery E. J., Scornavacca C., Romiguier J., Belkhir K., Galtier N., Delsuc F., Ranwez V., OrthoMaM v8: A database of orthologous exons and coding sequences for comparative genomics in mammals. Mol. Biol. Evol. 31, 1923–1928 (2014). [DOI] [PubMed] [Google Scholar]
- 18.Qian W., Yang J. R., Pearson N. M., Maclean C., Zhang J., Balanced codon usage optimizes eukaryotic translational efficiency. PLOS Genet. 8, e1002603 (2012). [DOI] [PMC free article] [PubMed] [Google Scholar]
- 19.Duret L., tRNA gene number and codon usage in the C. elegans genome are co-adapted for optimal translation of highly expressed genes. Trends Genet. 16, 287–289 (2000). [DOI] [PubMed] [Google Scholar]
- 20.Hershberg R., Petrov D. A., General rules for optimal codon choice. PLOS Genet. 5, e1000556 (2009). [DOI] [PMC free article] [PubMed] [Google Scholar]
- 21.Misawa K., Kamatani N., Kikuno R. F., The universal trend of amino acid gain-loss is caused by CpG hypermutability. J. Mol. Evol. 67, 334–342 (2008). [DOI] [PubMed] [Google Scholar]
- 22.Robinson-Rechavi M., Alibes A., Godzik A., Contribution of electrostatic interactions, compactness and quaternary structure to protein thermostability: Lessons from structural genomics of Thermotoga maritima. J. Mol. Biol. 356, 547–557 (2006). [DOI] [PubMed] [Google Scholar]
- 23.Chakravarty S., Varadarajan R., Elucidation of factors responsible for enhanced thermal stability of proteins: A structural genomics based study. Biochemistry 41, 8152–8161 (2002). [DOI] [PubMed] [Google Scholar]
- 24.Raghavan R., Kelkar Y. D., Ochman H., A selective force favoring increased G+C content in bacterial genes. Proc. Natl. Acad. Sci. U.S.A. 109, 14504–14507 (2012). [DOI] [PMC free article] [PubMed] [Google Scholar]
- 25.Hildebrand F., Meyer A., Eyre-Walker A., Evidence of selection upon genomic GC-content in bacteria. PLOS Genet. 6, e1001107 (2010). [DOI] [PMC free article] [PubMed] [Google Scholar]
- 26.Hershberg R., Petrov D. A., Evidence that mutation is universally biased towards AT in bacteria. PLOS Genet. 6, e1001115 (2010). [DOI] [PMC free article] [PubMed] [Google Scholar]
- 27.Rocha E. P., Danchin A., Base composition bias might result from competition for metabolic resources. Trends Genet. 18, 291–294 (2002). [DOI] [PubMed] [Google Scholar]
- 28.Reichenberger E. R., Rosen G., Hershberg U., Hershberg R., Prokaryotic nucleotide composition is shaped by both phylogeny and the environment. Genome Biol. Evol. 7, 1380–1389 (2015). [DOI] [PMC free article] [PubMed] [Google Scholar]
- 29.Musto H., Naya H., Zavala A., Romero H., Alvarez-Valín F., Bernardi G., Correlations between genomic GC levels and optimal growth temperatures in prokaryotes. FEBS Lett. 573, 73–77 (2004). [DOI] [PubMed] [Google Scholar]
- 30.Singer C. E., Ames B. N., Sunlight ultraviolet and bacterial DNA base ratios. Science 170, 822–826 (1970). [DOI] [PubMed] [Google Scholar]
- 31.Long H., Sung W., Kucukyildirim S., Williams E., Miller S. F., Guo W., Patterson C., Gregory C., Strauss C., Stone C., Berne C., Kysela D., Shoemaker W. R., Muscarella M. E., Luo H., Lennon J. T., Brun Y. V., Lynch M., Evolutionary determinants of genome-wide nucleotide composition. Nat. Ecol. Evol. 2, 237–240 (2018). [DOI] [PMC free article] [PubMed] [Google Scholar]
- 32.Plotkin J. B., Kudla G., Synonymous but not the same: The causes and consequences of codon bias. Nat. Rev. Genet. 12, 32–42 (2011). [DOI] [PMC free article] [PubMed] [Google Scholar]
- 33.Chen S., Li K., Cao W., Wang J., Zhao T., Huan Q., Yang Y. F., Wu S., Qian W., Codon-resolution analysis reveals a direct and context-dependent impact of individual synonymous mutations on mRNA level. Mol. Biol. Evol. 34, 2944–2958 (2017). [DOI] [PMC free article] [PubMed] [Google Scholar]
- 34.Ikemura T., Correlation between the abundance of Escherichia coli transfer RNAs and the occurrence of the respective codons in its protein genes: A proposal for a synonymous codon choice that is optimal for the E. coli translational system. J. Mol. Biol. 151, 389–409 (1981). [DOI] [PubMed] [Google Scholar]
- 35.Akashi H., Synonymous codon usage in Drosophila melanogaster: Natural selection and translational accuracy. Genetics 136, 927–935 (1994). [DOI] [PMC free article] [PubMed] [Google Scholar]
- 36.Bulmer M., The selection-mutation-drift theory of synonymous codon usage. Genetics 129, 897–907 (1991). [DOI] [PMC free article] [PubMed] [Google Scholar]
- 37.Hershberg R., Petrov D. A., Selection on codon bias. Annu. Rev. Genet. 42, 287–299 (2008). [DOI] [PubMed] [Google Scholar]
- 38.Chen Q., He Z., Lan A., Shen X., Wen H., Wu C. -I., Molecular evolution in large steps—Codon substitutions under positive selection. Mol. Biol. Evol. 36, 1862–1873 (2019). [DOI] [PubMed] [Google Scholar]
- 39.Chen Q., Lan A., Shen X., Wu C.-I., Molecular evolution in small steps under prevailing negative selection—A nearly universal rule of codon substitution. Genome Biol. Evol. 11, 2702–2712 (2019). [DOI] [PMC free article] [PubMed]
- 40.Ranwez V., Harispe S., Delsuc F., Douzery E. J., MACSE: Multiple Alignment of Coding SEquences accounting for frameshifts and stop codons. PLOS ONE 6, e22594 (2011). [DOI] [PMC free article] [PubMed] [Google Scholar]
- 41.Katoh K., Standley D. M., MAFFT multiple sequence alignment software version 7: Improvements in performance and usability. Mol. Biol. Evol. 30, 772–780 (2013). [DOI] [PMC free article] [PubMed] [Google Scholar]
- 42.Kristensen D. M., Wolf Y. I., Koonin E. V., ATGC database and ATGC-COGs: An updated resource for micro- and macro-evolutionary studies of prokaryotic genomes and protein family annotation. Nucleic Acids Res. 45, D210–D218 (2017). [DOI] [PMC free article] [PubMed] [Google Scholar]
- 43.Z. Yang, Computational Molecular Evolution (Oxford Univ. Press, 2006). [Google Scholar]
- 44.Zhang J., Rates of conservative and radical nonsynonymous nucleotide substitutions in mammalian nuclear genes. J. Mol. Evol. 50, 56–68 (2000). [DOI] [PubMed] [Google Scholar]
Associated Data
This section collects any data citations, data availability statements, or supplementary materials included in this article.
Supplementary Materials
Supplementary material for this article is available at http://advances.sciencemag.org/cgi/content/full/5/12/eaax3124/DC1
Data file S1. Parameters estimated from each of the 90 clades and used in various simulations.
Fig. S1. Simulations demonstrate the accuracy of ML estimates of amino acid REs.
Fig. S2. REs estimated from 90 clades respectively simulated using clade-specific parameters unless specified.
Fig. S3. Frequencies of between-clade RE correlations for clade pairs that show significant (orange, 3450 pairs) or nonsignificant (gray, 555 pairs) RE differences.
Fig. S4. REs respectively estimated from 90 clades simulated under nonstationary evolution of codon frequencies within clades (see the main text).
Table S1. Taxon composition and data source of all 90 clades for which relative amino acid exchangeabilities (REs) are estimated.
Table S2. Ten pairs of mammalian clades whose amino acid REs are compared for orthologous coding sequences.