Abstract
Precisely determining the intracellular concentrations of metabolites and signaling molecules is critical in studying cell biology. Fluorogenic RNA-based sensors have emerged to detect various targets in living cells. However, it is still challenging to apply these genetically encoded sensors to quantify the cellular concentrations and distributions of targets. Herein, using a pair of orthogonal fluorogenic RNA aptamers, DNB and Broccoli, we engineered a modular sensor system to apply the DNB-to-Broccoli fluorescence ratio to quantify the cell-to-cell variations of target concentrations. These ratiometric sensors can be broadly applied for live-cell imaging and quantification of metabolites, signaling molecules, and other synthetic compounds.
Keywords: aptamers, biosensors, fluorogenic RNA, ratiometric sensors, small-molecule imaging
Graphical Abstract
Ratiometric fluorogenic RNA-based sensors were developed to quantify metabolites and signalling molecules in living cells. Novel red-colored RNA-based sensors were engineered. These RNA-based sensors can be genetically encoded and engineered into versatile probes for a wide range of cellular targets.
Fluorescent probes that allow live-cell imaging of small molecules have enabled us to better understand cellular signaling and metabolite flux. Various fluorescent small-molecule probes and genetically encoded fluorescent protein (FP)-based sensors have been developed to image metabolites and signaling molecules.[1] The function of FP sensors requires a target-binding domain that can both selectively recognize the target and result in sufficient conformational change to refold FP or change the orientation between two FPs.[2] However, for many physiologically important analytes, these adequate target-binding domains are not easily identified. The limited signal-to-noise ratio has further prevented their wide applications.[3]
We and others have developed a new class of genetically encoded sensors based on fluorogenic RNA aptamers.[4] Aptamers are short single-stranded oligonucleotides that can bind to their targets with high affinity and specificity.[5] Fluorogenic RNA aptamers, e.g., Spinach or Broccoli, can bind and activate the fluorescence of dyes such as 3,5-difluoro-4-hydroxybenzylidene-1-trifluoroethyl-imidazolinone (DFHBI-1T).[6] By fusing a target-binding aptamer into Spinach/Broccoli, genetically encoded RNA-based sensors have been developed for live-cell imaging of metabolites, signaling molecules, proteins, and metal ions.[4, 7]
Almost all these fluorogenic RNA sensors were developed based on a Spinach/Broccoli-dye complex (λex/ λem, ~480 nm/503 nm). With a single-wavelength readout, artifacts can easily arise from variations in the cellular RNA distributions. For quantitative and multiplexed imaging of cellular analytes,[8] it is critical to develop new RNA sensor pairs that have little spectra overlap and that can be orthogonally imaged.
Here, we develop ratiometric RNA sensors to quantify the cellular concentrations and distributions of small molecules. The sensor comprises Broccoli and a dinitroaniline (DN)-binding aptamer, DNB.[6b, 9] We have engineered novel red-colored RNA sensors by fusing target-binding aptamers into DNB. Using Broccoli as the reference, we can quantitatively image various small molecules in living cells.
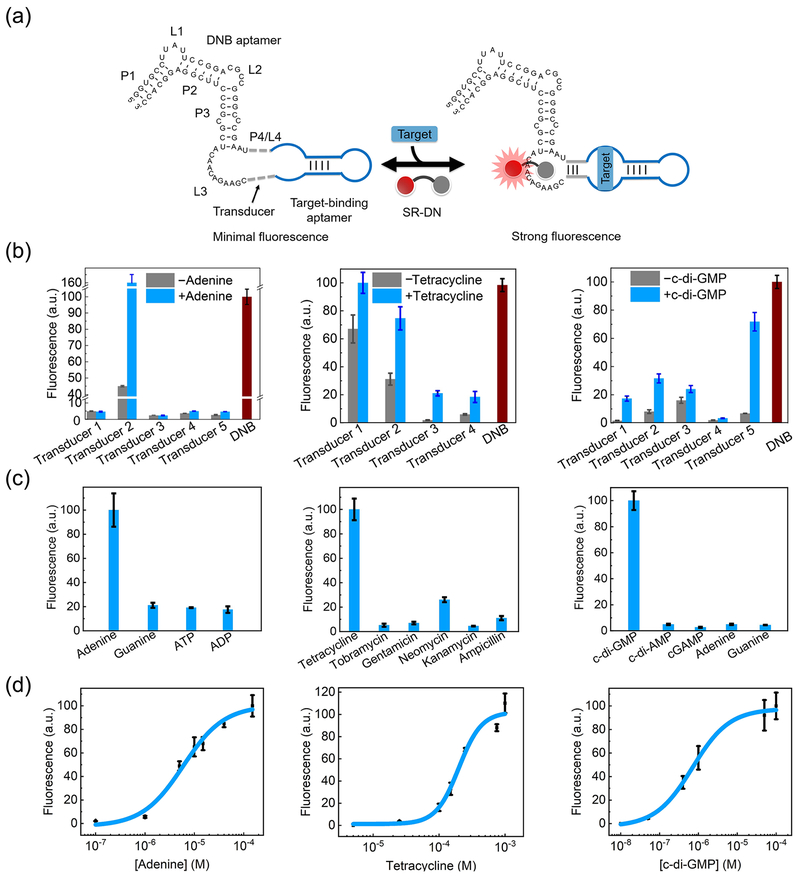
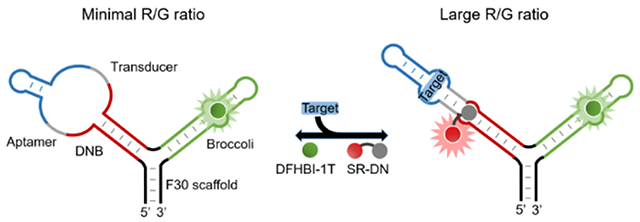
We first wondered if it is possible to develop DNB-based metabolite sensors. Dinitroaniline is a general contact quencher for fluorophores including sulforhodamine B (SR). The conjugation of DN and SR generates a non-fluorescent complex, SR-DN. The binding of DNB isolates DN, which activates the SR fluorescence.[9] After analyzing the DNB structure, we realized that its P4/L4 hairpin could be potentially used to fuse with target-binding aptamers (Fig. 1a).[9] We replaced this domain with three sequences that maintained a similar hairpin structure (Fig. S1). Similar to DNB (83.1-fold), all three mutations activated the SR-DN fluorescence (62.8- to 80.4-fold). In contrast, RNA with a mismatched P4 stem completely lost its binding with SR-DN (Fig. S1). Indeed, DNB functions depend on the structure, but not the sequence, of P4/L4.
Figure 1.
Design and in vitro characterization of DNB-based sensors. (a) Schematic of DNB-based sensors, which comprise a target-binding aptamer (blue), a transducer (dashed gray) and DNB. Target binding induces the folding of transducer and DNB to activate the fluorescence of sulforhodamine B (SR). (b) Optimization of transducers for DNB-based adenine, tetracycline and c-di-GMP sensors. Fluorescence was measured with 5 μM RNA and 0.5 μM SR-DN at λex = 571 nm and λem = 591 nm after incubating with 10 μM adenine, 200 μM tetracycline, or 10 μM c-di-GMP. (c) Selectivity was measured in the presence of 10 μM, 1 mM, and 100 μM of the indicated compounds for adenine, tetracycline and c-di-GMP sensors, respectively. (d) Dose-response curve for fluorescence detection of targets by the optimal sensors. Shown are mean and SEM values of three independent replicates.
We inserted an adenine-binding aptamer[10] into P4/L4 (Fig. 1a). In silico structural predication guided our design of five adenine-targeting sensors with different transducer sequences. An optimal sensor (Transducer 2, Table S1) exhibited a 3.6-fold fluorescence enhancement in the presence of 10 μM adenine (Fig. 1b). Similarly, we developed DNB-based sensors for an antibiotic, tetracycline, and a signaling molecule, c-di-GMP.[4d, 11] A 1.5- to 11.9-fold fluorescence increase was observed after adding 200 μM tetracycline (Fig. 1b). Interestingly, the optimal transducer sequence, Transducer 3, has been previously used in a ribozyme-based tetracycline sensor.[11a] An optimal sensor for c-di-GMP was achieved with a 10.6-fold fluorescence enhancement after adding 10 μM c-di-GMP. Transducer 1, whose sequence was previously used in a Spinach-based sensor c-di-GMP,[4d] also exhibited similar fold enhancement (Fig. 1b). Previously identified transducers may be directly applicable in these modular DNB-based sensors.
These sensors also preserve the high selectivity towards their targets (Fig. 1c). After demonstrating the robust sensor performance under different temperature and Mg2+ ion conditions (Fig. S2), we further studied their dynamic ranges (Fig. 1d). The half-maximal fluorescence was reached after adding 5.9 μM adenine, 0.8 μM c-di-GMP, or 196 μM tetracycline. By defining the dynamic range as targets that induced 10% – 90% of maximum fluorescence, 1.0 – 40 μM adenine, 0.1 – 20 μM c-di-GMP, and 85 – 880 μM tetracycline could be detected. Indeed, these sensors could be potentially used to detect adenine (~0.5 – 5 μM) and c-di-GMP (~0.05 – 10 μM) in their physiological concentration ranges.[4d, 12] The minimum antibacterial concentration of tetracycline is ~300 μM,[13] which is also suitable for detection with these DNB-based sensors.
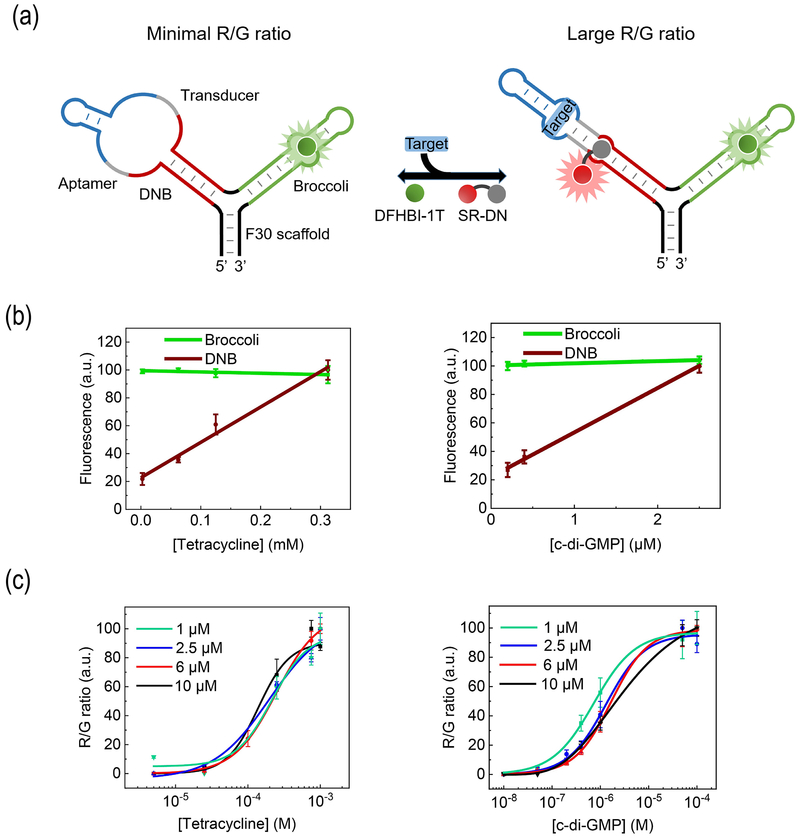
We next asked if it is possible to use an RNA strand containing Broccoli (λex/ λem, 480 nm/ 503 nm) and DNB (λex/ λem, 571 nm/ 591 nm) to develop ratiometric sensors. To facilitate the proper folding of each aptamer, we inserted DNB and Broccoli into two arms of an F30 scaffold [14] (Fig. 2a). After adding DFHBI-1T and SR-DN, both Broccoli/DFHBI-1T and DNB/SR-DN fluorescence could be easily detected and distinguished from each other (Fig. S3a–b). Thus, Broccoli and DNB can be used as an orthogonal fluorescent pair.
Figure 2.
Design and in vitro characterization of ratiometric sensors. (a) Schematic of the sensor that comprises an F30 scaffold (black), a Broccoli (green) and a DNB-based sensor. Target binding to the aptamer (blue) stabilizes the transducer duplex (gray), enabling DNB (red) to fold and activate the fluorescence of sulforhodamine B. (b) Dose-response curves of the optimal ratiometric tetracycline and c-di-GMP sensors. Fluorescence was measured with 5 μM RNA and 0.5 μM SR-DN. (c) Dose-response curves as measured at varying concentrations of RNA and 0.5 μM SR-DN. R/G ratio indicated the fluorescence ratio as measured at λex/ λem, 571 nm/ 591 nm (R) vs. that at λex/ λem, 480 nm/ 503 nm (G). Shown are mean and SEM values of three independent replicates.
We wondered if ratiometric sensors (termed D/B) could be developed by conjugating DNB-based sensor with a Broccoli reference (Fig. 2a). Indeed, a linear correlation was observed between the Broccoli fluorescence and RNA concentration (Fig. S3c). As expected, the Broccoli signal of D/B sensors remained constant after adding various amounts of targets, while the DNB fluorescence can be used to detect target concentrations (Fig. 2b). Half-maximal fluorescence was reached with 122 μM tetracycline or 0.95 μM c-di-GMP, and a linear detection range of 1 – 250 μM and 0.2 – 2.5 μM was observed, respectively (Fig. 2b). These D/B sensors still retained high selectivity towards the targets (Fig. S3f).
Alternative B/D sensors could be developed using a DNB reference and a Broccoli-based sensor (Fig. S4a). We first engineered a previously reported Broccoli-based c-di-GMP sensor[6b] into a ratiometric sensor. After adding different amounts of c-di-GMP, the DNB fluorescence was not influenced, while the Broccoli fluorescence was linearly correlated with c-di-GMP (Fig. S4c). Similarly, we developed another ratiometric B/D sensor for tetracycline. Using the same Transducer 3 from the DNB-based tetracycline sensor (Fig. 1b), an optimal B/D sensor selectively responded to tetracycline with a linear detection range of 10 – 400 μM (Fig. S4d). Thus, using a DNB reference, we can potentially convert existing Broccoli-based sensors into sensors for ratiometric analysis.
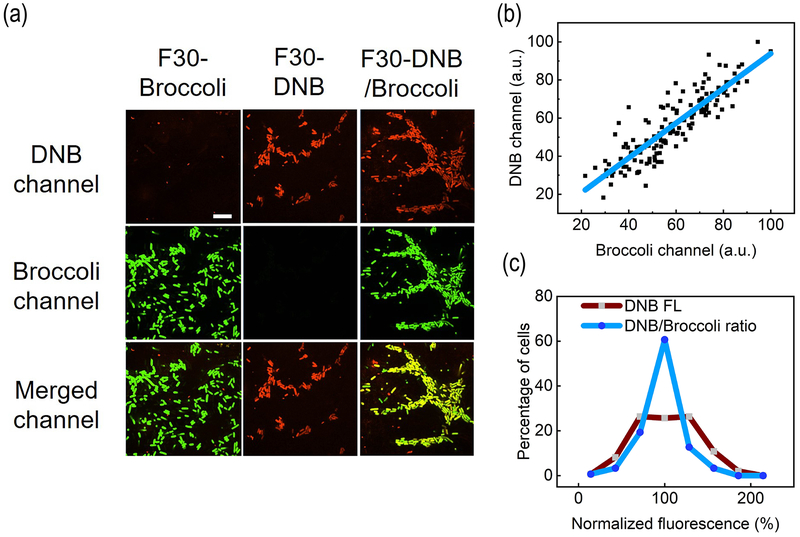
We next asked if DNB and Broccoli fluorescence could be orthogonally imaged in living cells. We synthesized three plasmids expressing either F30-Broccoli, F30-DNB or both aptamers (F30-DNB/Broccoli) (Fig. S5). After transforming into E. coli cells, the cellular fluorescence was imaged in the presence of DFHBI-1T and SR-DN. The Broccoli and DNB fluorescence could be clearly visualized in two separate channels without influencing each other (Fig. 3a).
Figure 3.
Orthogonal live-cell imaging of DNB and Broccoli. (a) Fluorescence imaging of BL21 (DE3)* cells expressing F30-Broccoli, F30-DNB, or F30-DNB/Broccoli in the presence of 200 μM DFHBI-1T and 1 μM SR-DN. Scale bar, 10 μm. (b) A linear correlation between DNB and Broccoli fluorescence in 150 cells expressing F30-DNB/Broccoli. Pearson’s r2= 0.8. (c) After analyzing 150 individual F30-DNB/Broccoli expressing cells, distribution of DNB fluorescence levels were compared to that of DNB/Broccoli ratio.
We further analyzed individual cells that express F30-DNB/Broccoli, and, a linear correlation of Broccoli and DNB fluorescence was observed (Fig. 3b). After comparing the cellular distributions of DNB fluorescence with that of DNB/Broccoli ratio (Fig. 3c), indeed, a largely symmetric Gaussian distribution was shown only after ratiometric normalization. This is one demonstration of the importance of ratiometric imaging. We have further used real-time PCR to quantify the cellular F30-DNB/Broccoli RNA levels after different times of IPTG induction (Fig. S6). The cellular DNB-to-Broccoli fluorescence ratio is independent of RNA levels. The cellular fluorescence in both Broccoli and DNB channels were linearly correlated with the aptamer concentrations (Fig. S6). We can use either Broccoli or DNB as the reference to normalize sensor expression levels.
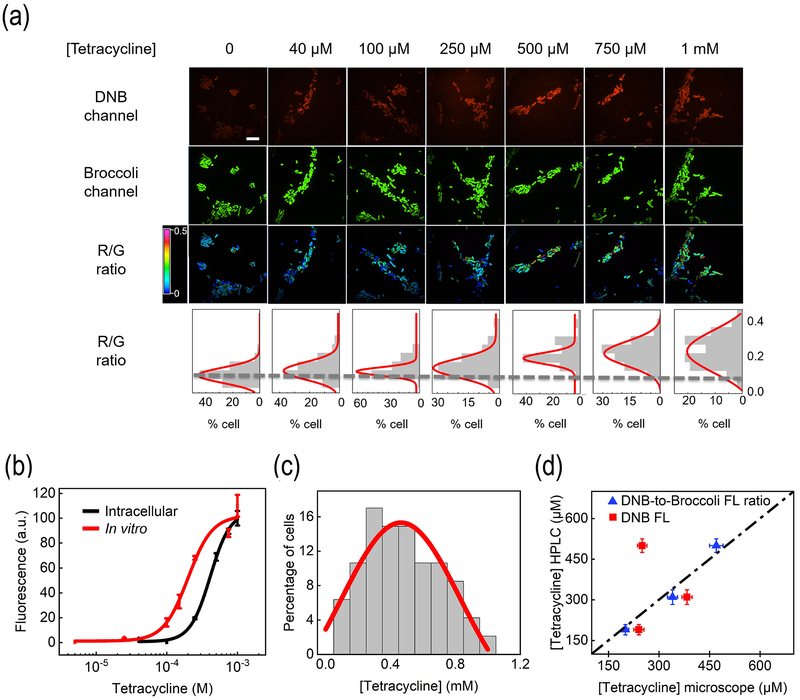
We next asked if we could apply D/B sensors to image and determine target levels in living cells. We first chose tetracycline-targeting Tc-D/B as an example. After adding 40 – 1,000 μM tetracycline, target-dependent activation of DNB fluorescence was observed, while the Broccoli fluorescence remained at a constant level (Fig. 4a). Our in vitro data indicated that independent of RNA concentration, the DNB-to-Broccoli fluorescence ratio could be directly correlated with target concentration (Fig. 2c). A linear detection range of 70 – 750 μM for tetracycline and 0.3 – 10 μM for c-di-GMP was observed.
Figure 4.
Intracellular imaging of tetracycline. (a) Fluorescence imaging of BL21 (DE3)* cells expressingjj Tc-D/B after 70 min incubation with 0 – 1,000 μM tetracycline. Scale bar, 10 μm. According to the DNB-to-Broccoli fluorescence (R/G) ratio of 300 individual cells from three experimental replicates, a distribution curve was generated. (b) In vitro and cellular dose-response curves of Tc-D/B based on the mean and SEM DNB-to-Broccoli fluorescence ratio. (c) Cellular distribution of tetracycline after adding 1 mM tetracycline. Individual cells were binned according to tetracycline concentration. The percentage of cells in each bin was plotted. (d) Validation of the determined cellular tetracycline levels with an HPLC assay after adding 250, 500, and 1,000 μM tetracycline. The tetracycline levels were determined based on either DNB fluorescence only (red) or DNB-to-Broccoli fluorescence ratio (blue).
We analyzed 300 individual cells at each tetracycline concentration (Fig. 4a–b). On average a 1.6-fold, 2.7-fold, and 3.3-fold increase in the DNB-to-Broccoli fluorescence ratio was observed after adding 250, 500, and 1,000 μM tetracycline (Fig. 4b). Based on the calibration curve, these fluorescence ratios were correlated with 200, 340, and 470 μM cellular tetracycline (Fig. 2c). The lower intracellular than extracellular tetracycline concentration is likely due to the reduced cell membrane permeability or the activation of efflux pumps.[15] We have further applied an HPLC assay[16] to validate the determined tetracycline concentrations (Fig. S7). Indeed, the determined values from the HPLC assay and fluorescence imaging matched each other well (Fig. 4d).
We wondered if cellular tetracycline levels can be accurately determined by only measuring the DNB fluorescence. Based on the corresponding dose-responsive curve (Fig. S8) and Pearson correlation coefficient (Fig. S9), the determined tetracycline levels with DNB-only images were quite different from that with ratiometric images. By comparing with the HPLC results (Fig. 4d), ratiometric images quantified tetracycline levels with obvious higher accuracy, especially at high concentration range.
We further analyzed the cellular distributions of tetracycline. After adding 1 mM tetracycline, 18%, 50%, and 32% of cells accumulated high (>650 μM), medium (300 – 650 μM), and low (<300 μM) levels of tetracycline (Fig. 4c). To test if the cellular tetracycline accumulation is directly correlated with cell death, we used a Sytox Blue (SB) dye to stain the dead/dying cells (Fig. S10). The percentage of SB-stained cells increased from almost zero in the absence of tetracycline to 9.7%, 16%, and 30% after 2 h incubation with 40, 500, and 1,000 μM tetracycline. SB-stained cells (90.3%) also exhibited high levels of tetracycline. Indeed, the intracellular accumulation of tetracycline is highly correlated with the reduced cellular survival.
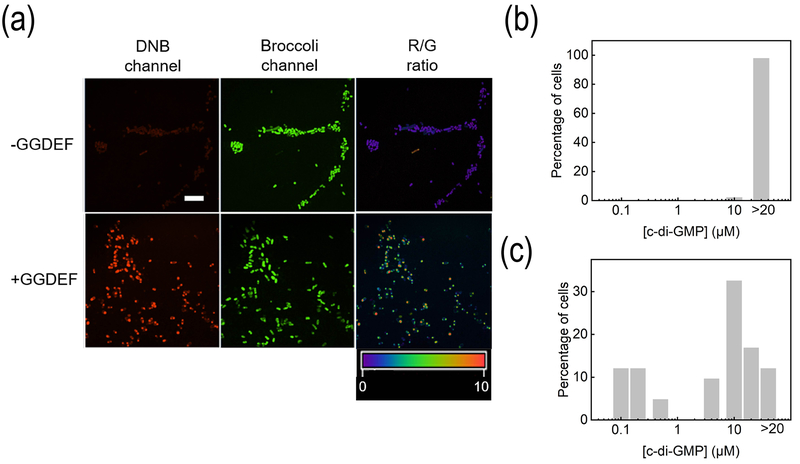
We further applied c-di-GMP-targeting CDG-D/B sensor to image cellular c-di-GMP. It is known that the diguanylate cyclase GGDEF domain can be used to catalyze the synthesis of c-di-GMP.[17] Indeed, without GGDEF expression, the cellular DNB fluorescence was relatively low: 25.9%, 46.3%, and 27.8% of cells exhibited low (<0.2 μM), medium (0.2 – 10 μM), and high (>10 μM) c-di-GMP levels (Fig. 5a and 5c). After expressing GGDEF, bright DNB fluorescence was observed (Fig. 5a), with 97.9% of cells exhibiting a high level (>10 μM) of c-di-GMP (Fig. 5b). Again, an HPLC assay[18] was used to validate the determined c-di-GMP concentrations (Fig. S11). After 1 h or 1.5 h IPTG induction, the calculated c-di-GMP level based on the cellular DNB-to-Broccoli fluorescence ratio was 13 μM and 7.3 μM, respectively. Quite similarly, the c-di-GMP level as determined in the HPLC assay was 11 μM and 7.1 μM in these two conditions. While if only using DNB fluorescence for the calculation, a large variation from the HPLC results was observed, i.e., 20 μM and 16 μM (Table S2). Indeed, D/B sensors could be used to quantify the cellular levels and distributions of signaling molecules.
Figure 5.
Quantitative imaging of c-di-GMP. (a) Fluorescence imaging of c-di-GMP in live BL21 (DE3)* cells. 200 μM DFHBI-1T and 1 μM SR-DN were added 70 min before imaging. Scale bar, 10 μm. (b, c) Cellular distribution of c-di-GMP in the presence (b) or absence (c) of GGDEF. Individual cells were binned according to c-di-GMP concentration. The percentage of cells in each bin was plotted.
In sum, we have developed ratiometric RNA-based sensors that can be modularly adapted to quantify various analyte levels in individual cells. Independent of RNA expression level, the cellular DNB-to-Broccoli fluorescence ratio can be used to quantify target concentrations. For the first time, red-colored fluorogenic RNA-based sensors have been developed for imaging small molecules. These new powerful genetically encoded sensors can be broadly applied for intracellular imaging of small molecules.
Supplementary Material
Acknowledgements
The authors acknowledge the support of start-up, NIH R01AI136789, T32GM008515, NSF CAREER, and Sloan Research Fellowship. Thank Dr. James Chambers for the assistance in fluorescence imaging, Dr. Kathryn Williams for revising the manuscript, and Drs. Craig Martin, S. Thayumanavan, Stephen Lory, and M. Sloan Siegrist for valuable comments.
References
- [1].a) Zhang J, Campbell RE, Ting AY, Tsien RY, Nat. Rev. Mol. Cell Biol 2002, 3, 906–918; [DOI] [PubMed] [Google Scholar]; b) Okumoto S, Curr. Opin. Biotechnol 2010, 21, 45–54; [DOI] [PMC free article] [PubMed] [Google Scholar]; c) Ni Q, Mehta S, Zhang J, FEBS J. 2018, 285, 203–219; [DOI] [PMC free article] [PubMed] [Google Scholar]; d) Liu D, Evans T, Zhang FZ, Metab. Eng 2015, 31, 35–43; [DOI] [PubMed] [Google Scholar]; e) Frommer WB, Davidson MW, Campbell RE, Chem. Soc. Rev 2009, 38, 2833–2841; [DOI] [PMC free article] [PubMed] [Google Scholar]; f) Miyawaki A, Niino Y, Mol Cell 2015, 58, 632–643. [DOI] [PubMed] [Google Scholar]
- [2].a) Lindenburg L, Merkx M, Sensors-Basel 2014, 14, 11691–11713; [DOI] [PMC free article] [PubMed] [Google Scholar]; b) Germond A, Fujita H, Ichimura T, Watanabe TM, Biophys. Rev 2016, 8, 121–138. [DOI] [PMC free article] [PubMed] [Google Scholar]
- [3].a) Miyawaki A, Annu Rev Biochem 2011, 80, 357–373; [DOI] [PubMed] [Google Scholar]; b) Palmer AE, Qin Y, Park JG, McCombs JE, Trends Biotechnol 2011, 29, 144–152. [DOI] [PMC free article] [PubMed] [Google Scholar]
- [4].a) Paige JS, Nguyen-Duc T, Song WJ, Jaffrey SR, Science 2012, 335, 1194–1194; [DOI] [PMC free article] [PubMed] [Google Scholar]; b) Song WJ, Strack RL, Jaffrey SR, Nat. Methods 2013, 10, 873–875; [DOI] [PMC free article] [PubMed] [Google Scholar]; c) You MX, Litke JL, Jaffrey SR, Proc. Natl. Acad. Sci. U. S. A 2015, 112, E2756–E2765; [DOI] [PMC free article] [PubMed] [Google Scholar]; d) Kellenberger CA, Wilson SC, Sales-Lee J, Hammond MC, J. Am. Chem. Soc 2013, 135, 4906–4909; [DOI] [PMC free article] [PubMed] [Google Scholar]; e) Yu QK, Shi J, Mudiyanselage APKKK, Wu R, Zhao B, Zhou M, You MX, Chem. Commun 2019, 55, 707–710; [DOI] [PMC free article] [PubMed] [Google Scholar]; f) Mudiyanselage APKKK, Wu R, Leon-Duque MA, Ren K, You M, Methods 2019, 161, 24–34; [DOI] [PMC free article] [PubMed] [Google Scholar]; g) Ying ZM, Wu Z, Tu B, Tan WH, Jiang JH, J. Am. Chem. Soc 2017, 139, 9779–9782; [DOI] [PubMed] [Google Scholar]; h) Sharma S, Zaveri A, Visweswariah SS, Krishnan Y, Small 2014, 10, 4276–4280; [DOI] [PubMed] [Google Scholar]; i) Kellenberger CA, Wilson SC, Hickey SF, Gonzalez TL, Su Y, Hallberg ZF, Brewer TF, Iavarone AT, Carlsson HK, Hsieh YF, Hammond MC, Proc. Natl. Acad. Sci. U. S. A 2015, 112, 5383–5388; [DOI] [PMC free article] [PubMed] [Google Scholar]; j) Jepsen MDE, Sparvath SM, Nielsen TB, Langvad AH, Grossi G, Gothelf KV, Andersen ES, Nat. Commun 2018, 9, 18. [DOI] [PMC free article] [PubMed] [Google Scholar]
- [5].a) Song KM, Lee S, Ban C, Sensors-Basel 2012, 12, 612–631; [DOI] [PMC free article] [PubMed] [Google Scholar]; b) Stojanovic MN, Kolpashchikov DM, J. Am. Chem. Soc 2004, 126, 9266–9270. [DOI] [PubMed] [Google Scholar]
- [6].a) Paige JS, Wu KY, Jaffrey SR, Science 2011, 333, 642–646; [DOI] [PMC free article] [PubMed] [Google Scholar]; b) Filonov GS, Moon JD, Svensen N, Jaffrey SR, J. Am. Chem. Soc 2014, 136, 16299–16308. [DOI] [PMC free article] [PubMed] [Google Scholar]
- [7].Sun ZN, Nguyen T, McAuliffe K, You MX, Nanomaterials-Basel 2019, 9, E233. [DOI] [PMC free article] [PubMed] [Google Scholar]
- [8].a) Chen YH, Liu WJ, Zhang ZM, Zheng C, Huang YJ, Cao RZ, Zhu DZ, Xu L, Zhang M, Zhang YH, Fan JN, Jin LH, Xu YK, Kuang CF, Liu X, Nat. Commun 2018, 9, 4818; [DOI] [PMC free article] [PubMed] [Google Scholar]; b) Modi S, Swetha MG, Goswami D, Gupta GD, Mayor S, Krishnan Y, Nat. Nanotechnol 2009, 4, 325–330. [DOI] [PubMed] [Google Scholar]
- [9].Arora A, Sunbul M, Jaschke A, Nucleic Acids Res. 2015, 43, e144. [DOI] [PMC free article] [PubMed] [Google Scholar]
- [10].Mandal M, Breaker RR, Nat. Struct. Mol. Biol 2004, 11, 29–35. [DOI] [PubMed] [Google Scholar]
- [11].a) Wittmann A, Suess B, Mol. BioSyst 2011, 7, 2419–2427; [DOI] [PubMed] [Google Scholar]; b) Wang XC, Wilson SC, Hammond MC, Nucleic Acids Res. 2016, 44, e139. [DOI] [PMC free article] [PubMed] [Google Scholar]
- [12].a) Traut TW, Mol. Cell. Biochem 1994, 140, 1–22; [DOI] [PubMed] [Google Scholar]; b) Hengge R, Nat. Rev. Microbiol 2009, 7, 263–273; [DOI] [PubMed] [Google Scholar]; c) Kalia D, Merey G Nakayama S, Zheng Y, Zhou J, Luo Y, Guo M, Roembke BT, Sintim HO, Chem. Soc. Rev 2013, 42, 305–341. [DOI] [PubMed] [Google Scholar]
- [13].Chang CF, Chang LC, Chang YF, Chen M, Chiang TS, J. Vet. Diagn. Invest 2002, 14, 153–157. [DOI] [PubMed] [Google Scholar]
- [14].a) Filonov GS, Kam CW, Song WJ, Jaffrey SR, Chem. Biol 2015, 22, 649–660; [DOI] [PMC free article] [PubMed] [Google Scholar]; b) Filonov GS, Jaffrey SR, Curr. Protoc. Chem. Biol 2016, 8, 1–28. [DOI] [PMC free article] [PubMed] [Google Scholar]
- [15].a) Webber MA, Piddock LJV, J. Antimicrob. Chemother 2003, 51, 9–11; [DOI] [PubMed] [Google Scholar]; b) May KL, Grabowicz M, Proc. Natl. Acad. Sci. U. S. A 2018, 115, 8852–8854. [DOI] [PMC free article] [PubMed] [Google Scholar]
- [16].a) Franklin TJ, Biochem. J 1967, 105, 371–378; [DOI] [PMC free article] [PubMed] [Google Scholar]; b) Yu H, Mu H, Hu YM, J. Pharm. Anal 2012, 2, 76–81. [DOI] [PMC free article] [PubMed] [Google Scholar]
- [17].a) Simm R, Morr M, Kader A, Nimtz M, Romling U, Mol. Microbiol 2004, 53, 1123–1134; [DOI] [PubMed] [Google Scholar]; b) Seshasayee ASN, Fraser GM, Luscombe NM, Nucleic Acids Res. 2010, 38, 5970–5981. [DOI] [PMC free article] [PubMed] [Google Scholar]
- [18].Roy AB, Petrova OE, Sauer K, Bio-Protoc. 2013, 3, e828. [DOI] [PMC free article] [PubMed] [Google Scholar]
Associated Data
This section collects any data citations, data availability statements, or supplementary materials included in this article.


