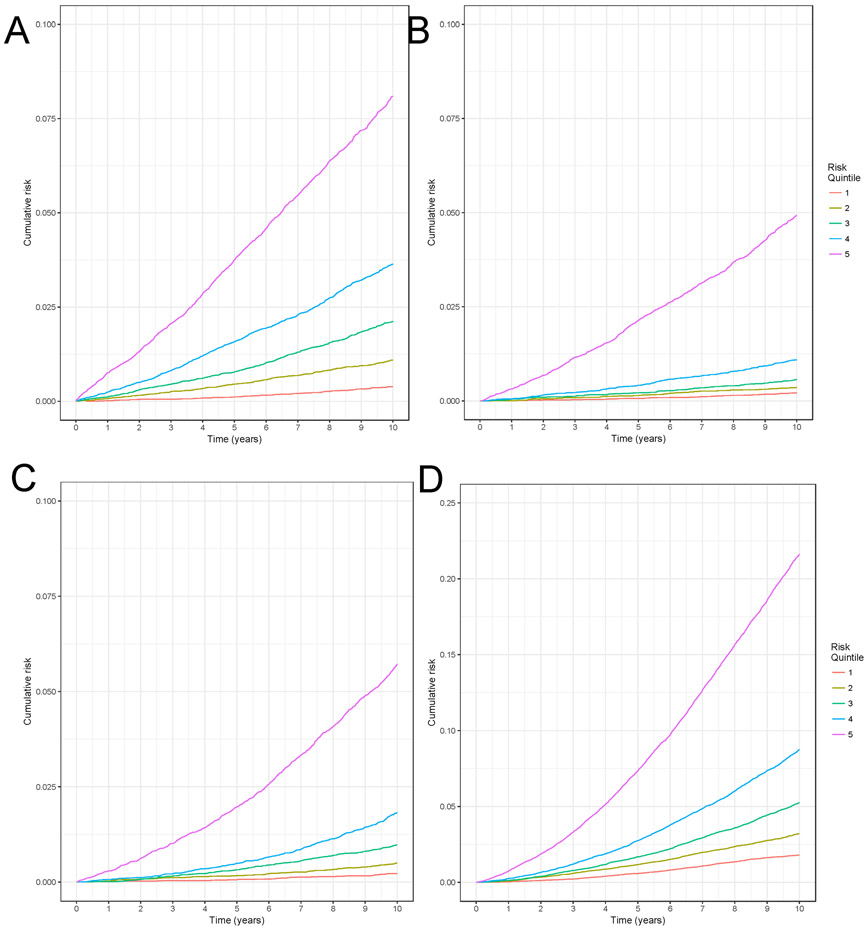
Figure 2: Stratified Kaplan-Meier plot to evaluate model discrimination for A) myocardial infarction, B) lung cancer, C) hip fracture, D) death.
Note that the vertical axis is truncated to 0.1 in panels A, B, and C and to 0.25 in panel D. They do not extend to 1 due to the rarity of the events. Each line represents the lowest to highest risk quintile, according to a woman’s risk as predicted by the 10-year model for myocardial infarction, lung cancer, hip fracture, and death in the test set. In a model that discriminates well, we would expect that the highest risk quintile would have the highest cumulative risk and the lowest risk quintile would have the lowest observed cumulative risk

