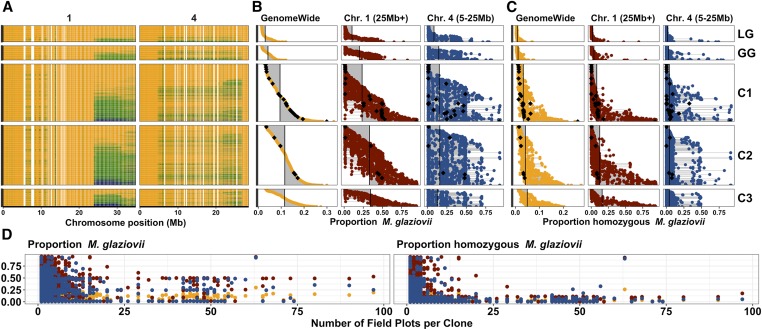
Figure 3.
The effects of (genomic) selection on M. glaziovii introgressions. The mean M. glaziovii allele dosage at IDMs in 250 kb windows on chromosomes 1 and 4 is depicted on the top left (A). Physical position on each chromosome is depicted in megabases (Mb) along the x-axis. Colors range from orange (0 M.g. alleles), to green (1 M.g. allele), to dark blue (2 M.g. alleles). The top middle panel (B) shows the per individual proportion and the top right panel (C) shows the rate of homozygosity for M. glaziovii alleles at IDM. Proportions for (B) were calculated as the sum (per clone) of the dosages at IDMs divided by two times the number of IDMs. The proportions for (C) were simply the proportion (per clone) out of the total number of IDMs with a dosage equal to two. The proportions in (B and C) were computed either with all IDMs (GenomeWide, left column), at IDMs on chr. 1 >25 Mb (middle column), at IDMs on chr. 4 from 5 to 25 Mb (right column). The populations can be compared in (B and C) by looking down the columns and using the vertical lines, which represent the mean values for that group and region, as a visual aid. For (A–C), each row (y-axis) is an individual cassava clone and the vertical panels represent five populations: IITA Genetic Gain (GG) and three successive generations of genomic selection progeny (C1, C2 and C3), descended originally from GG. Rows (clones) are aligned across (A–C) and sorted within population based on the genome-wide proportion M. glaziovii [left column of (B)]. At the bottom, (D) shows how the introgression frequency and homozygosity rate per individual (y-axis) for the C1, C2, and C3 relates to the cumulative number of field plots planted (as of January 2019) per clone (x-axis). The number of field plots per clone is meant as a proxy representing the level of advancement through variety development stages of the breeding process. For illustrative purposes, we highlight C1, C2, and C3 clones with >50 field plots in (B and C) with black diamonds. For (D) as in (B and C), we break down the proportions in (D) by region and use the same color coding: genome-wide (orange), chr. 1 region (dark red), chr. 4 region (dark blue).

