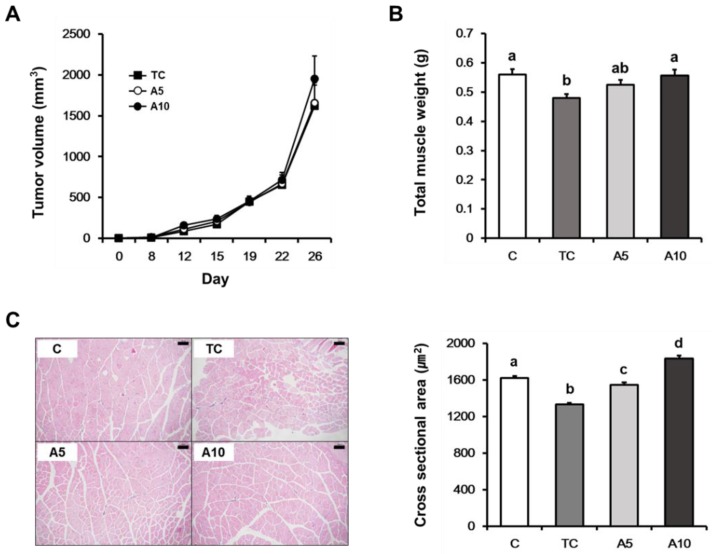
Figure 1.
(A) Tumor volumes of CT26 tumor-bearing mice; (B) total muscle weight at the time of euthanasia; (C) representative hematoxylin and eosin (H&E) staining (magnification × 100) (left) and average value for cross sectional area (right) of the quadriceps muscle. Values are presented as the mean ± SEM. Statistical significance was evaluated by one-way ANOVA followed by the Duncan’s multiple range test. Means with different superscript letter are significantly different at p < 0.05 (B) and p < 0.0001 (C). C, control; TC, tumor control; A5, 5 mg/kg ajoene extract; A10, 10 mg/kg ajoene extract (n = 10 per group for A and B; n = 4 for C).

