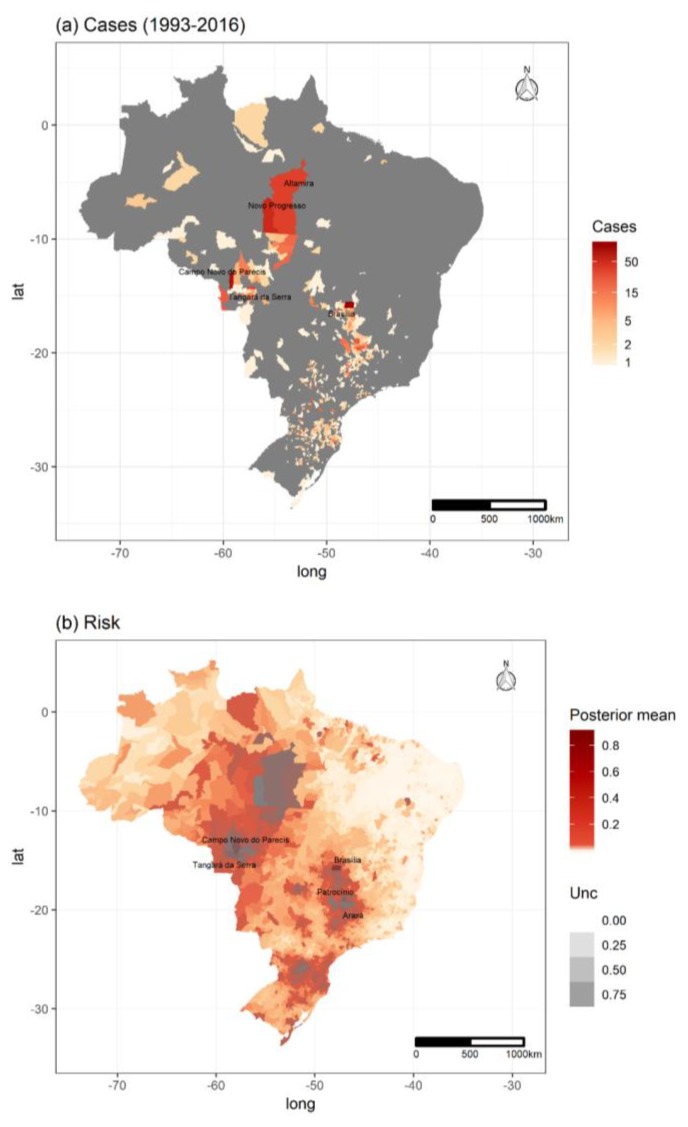
Figure 2.
Hantavirus disease distribution in Brazil. (a) Observed values from 1993–2016, highlighting the municipalities with largest number of cases. Grey areas are municipalities with no notified cases; (b) Expected values for the probability of hantavirus disease in humans, predicted by a spatiotemporal model containing forest, climate, and social vulnerability, with uncertainty as transparency levels (Unc) based on the variation of credible intervals. The top five municipalities in terms of risk per year are highlighted. See the risk map without the uncertainty layer in Figure S4.

