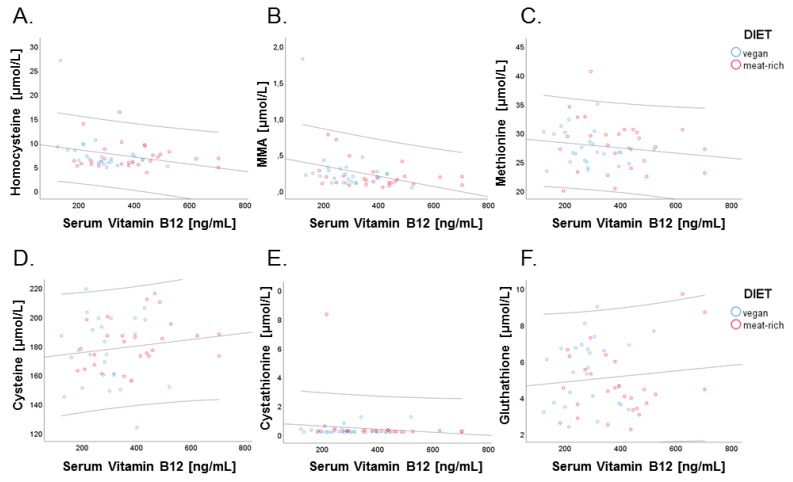
Figure 6.
Relationship of serum vitamin B12 with cellular markers of vitamin B12, tHcy, and MMA, and with other marker metabolites of B-vitamin status. Data points of participants in the vegan and meat-rich diets are shown as blue and red dots, respectively. Correlations are shown for serum vitamin B12 (ng/L) and total homocysteine (µmol/L; r = 0.280, p = 0.042) (Panel A), serum vitamin B12 and methylmalonic acid (µmol/L; r = 0.280, p = 0.042) (Panel B), serum vitamin B12 and methionine (µmol/L; r = −0.154, p = 0.272) (Panel C), serum vitamin B12 and serum cysteine (µmol/L; r = 0.147, p = 0.293) (Panel D), serum vitamin B12 and cystathionine (µmol/L; r = −0.126, p = 0.367) (Panel E), and serum vitamin B12 and glutathione (µmol/L; r = 0.110, p = 0.434) (Panel F). Dispersion lines show the 95% confidence interval of the linear regression fit.

