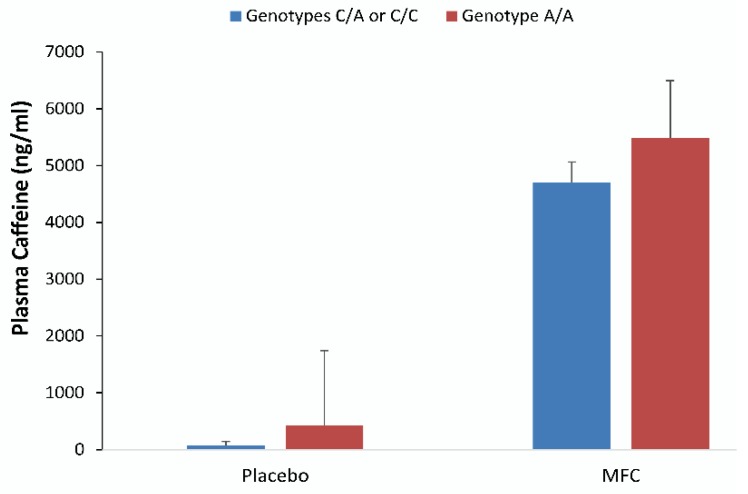
Figure 5.
Plasma caffeine concentrations measured in samples drawn at 16:00 for those with genotypes C/A or C/C (n = 6), and genotype A/A (n = 11) in the placebo and MFC trials (mean ± SD). Both groups had significantly higher caffeine concentrations when comparing MFC and placebo trials (p < 0.001). The difference in trial contrasts between genotype groups was not statistically significant (p = 0.56).

