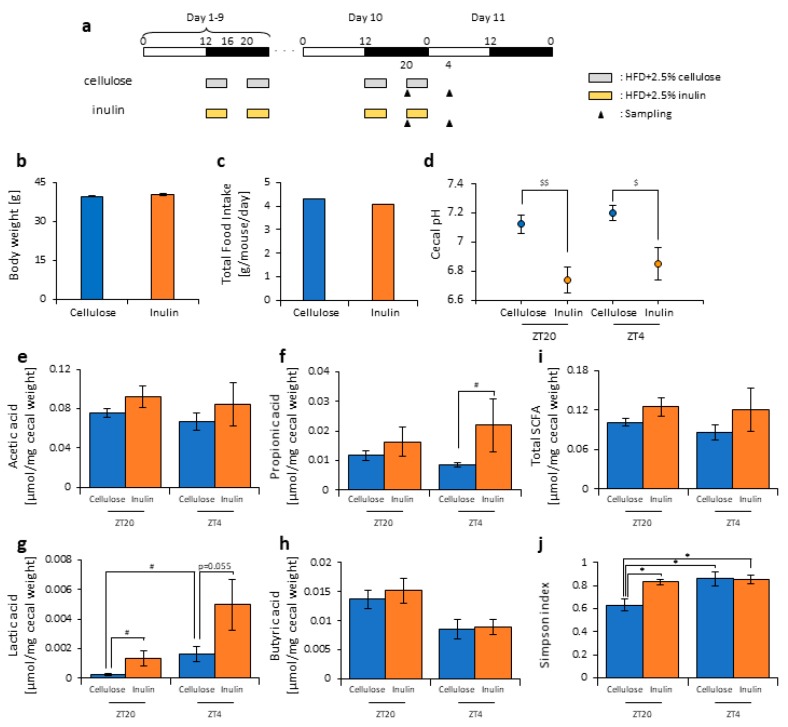
Figure 1.
Inulin feeding decreased cecal pH and increased short-chain-fatty-acids. (a) Experimental schedule, where the white and black bars indicate environmental 12 h light and dark conditions, respectively. The gray bar indicates feeding with a high-fat-diet (HFD) and 2.5% cellulose. The yellow bar indicates feeding with HFD and 2.5% inulin. The black arrowhead indicates the sampling time. (b) Body weight before sampling. (c) Average daily food intake. (d) Cecal pH of mice housed for 10 days for each group. (e–i) The short-chain fatty acids (SCFAs) of mice, including (e) acetic acid, (f) propionic acid, (g) lactic acid, (h) butyric acid, and (i) total SCFAs. (j) Bacterial alpha diversity. Comparison of the Simpson index estimation of the 16S rDNA gene libraries at 97% similarity from the sequencing analysis. All values except (c) are represented as mean ± SEM (cellulose at ZT20 (n = 5) and 4 (n = 5); inulin at ZT20 (n = 5) and 4 (n = 5)). * p < 0.05, evaluated using the two-way ANOVA with Tukey’s post hoc test. $$ p < 0.01, $ p < 0.05, evaluated using the two-way ANOVA with Sidak’s post hoc test. # p < 0.05, evaluated using the Mann–Whitney test with a two-stage linear step-up procedure of the Benjamini, Krieger, and Yekutieli test for multiple comparisons.

