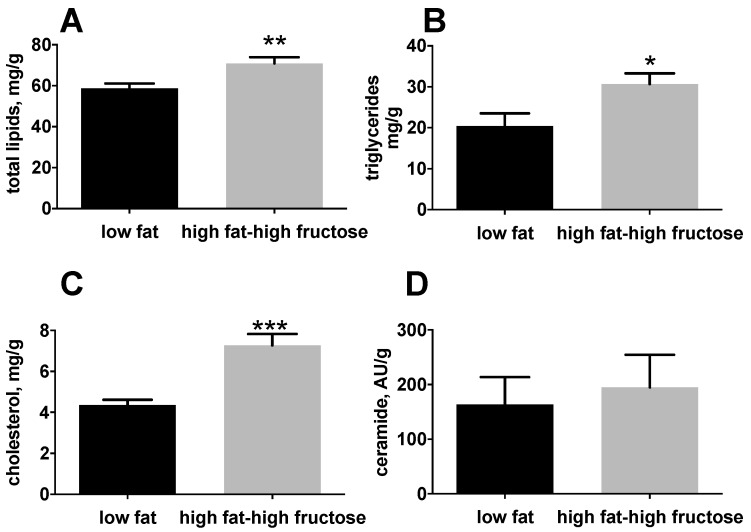
Figure 3.
Hepatic lipid composition in middle aged rats fed a low fat or high fat-high fructose diet for 4 weeks. Lipid composition in the liver was assessed by measuring total lipids (A), triglycerides (B), total cholesterol (C), and ceramides (D). Values are the means ± SEM of eight rats. * p < 0.05, ** p < 0.01, *** p < 0.001 compared to low fat diet (two-tailed, unpaired, student’s t-test).

