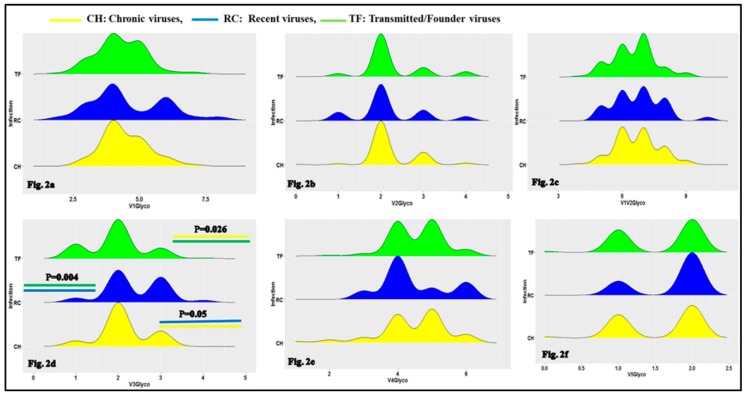
Figure 2.
Ridge plot comparing the HIV-1 envelope variable loop number of N-glycosylation sites between TF, RC and chronic (CH) viruses. The boxes represent a density plot of number of N-glycosylation sites for: Env V1 loop (a), Env V2 loop (b), Env V1V2 loop (c), Env V3 loop (d), Env V4 loop (e) and Env V5 loop (f) for CH, RC and TF viruses respectively. In box, the top (green), middle (blue) and bottom (yellow) represent respectively number of N-glycosylation sites for CH, RC and TF viruses envelope sequences respectively. The X-axis represents sequence loops number of N-glycosylation sites and the Y-axis the density of sequences number of N-glycosylation sites for each timeline category of viruses (CH, RC and TF). As shown in Figure 2d, the differences in Env V3 loop numbers of N-glycosylation sites between CH and TF, p = 0.026; RC and TF, p = 0.004 and CH and RC, p = 0.05 were statistically significant using Wald test with logistic regression model.

