

SUMMARY
The bromodomain protein 4 (BRD4) is an atypical kinase and histone acetyl transferase (HAT) that binds to acetylated histones and contributes to chromatin remodeling and early transcriptional elongation. During transcription, BRD4 travels with the elongation complex. Since most alternative splicing events take place co-transcriptionally, we asked if BRD4 plays a role in regulating alternative splicing. We report that distinct patterns of alternative splicing are associated with a conditional deletion of BRD4 during thymocyte differentiation in vivo. Similarly, the depletion of BRD4 in T cell acute lymphoblastic leukemia (T-ALL) cells alters patterns of splicing. Most alternatively spliced events affected by BRD4 are exon skipping. Importantly, BRD4 interacts with components of the splicing machinery, as assessed by both immunoprecipitation (IP) and proximity ligation assays (PLAs), and co-localizes on chromatin with the splicing regulator, FUS. We propose that BRD4 contributes to patterns of alternative splicing through its interaction with the splicing machinery during transcription elongation.
In Brief
The bromodomain protein 4 (BRD4) is an important regulator of both normal development and tumorigenesis, regulating chromatin organization and transcription. Uppal et al. report that BRD4 also regulates alternative splicing: distinct patterns of alternative splicing are associated with depletion of BRD4 in T cell acute lymphoblastic leukemia (T-ALL) cancer cells and during thymocyte differentiation in vivo.
Graphical Abstract
INTRODUCTION
The bromodomain protein 4 (BRD4) is an important regulator of both normal development and tumorigenesis. The growth of many tumors, including AML (acute myeloid leukemia) (Roe and Vakoc, 2016) and T cell acute lymphoblastic leukemia (T-ALL) (Winter et al., 2017), has been shown to be dependent on BRD4 in cell culture and in preclinical models (Zuber et al., 2011). Small molecule inhibitors of BRD4, including JQ1 and the degron dBET6, have been shown to block growth in a variety of tumor models. Normal development depends on BRD4: the germline deletion of BRD4 is embryonic lethal. BRD4 also regulates gene expression in both innate and adaptive immune cells (Bolden et al., 2014; Cheung et al., 2017; Dey et al., 2000, 2019; Mele et al., 2013; Schmidt et al., 2015). During thymocyte differentiation, BRD4 is required at a critical step of maturation (Gegonne et al., 2018). Thymopoiesis occurs in a series of discrete developmental steps. The first precursor cells to enter the thymus are characterized by the absence of both co-stimulatory molecules, CD4 and CD8, and are thus labeled “double negative” (DN). Following a burst of proliferation, DN cells begin to express the co-receptor, CD8, and are referred to as immature single-positive (ISP) thymocytes. These undergo a single round of proliferation to become CD4+CD8+ double-positive (DP) cells that express the mature T cell receptor and then further mature to single-positive (SP) CD4+ or CD8+. Deletion of BRD4 at the DN stage of development impairs maturation beyond the ISP stage, leading to a significant loss of DP and SP cells and thymic cellularity. Surprisingly, except for BRD4-deficient ISPs, BRD4-deficient thymocytes and peripheral T cells have relatively normal patterns of transcription, despite defects in each of the developmental stages and peripheral T cell activation.
These findings suggest a function for BRD4 beyond its roles in chromatin organization and transcription. BRD4 is known to uniquely coordinate chromatin organization and transcription through its histone acetyl transferase (HAT) enzymatic activity and its atypical kinase activity (Devaiah et al., 2016, 2012). BRD4 HAT activity acetylates both histone tails and the globular domain of histone H3, resulting in nucleosome dissociation and chromatin remodeling at BRD4-target genes (Devaiah et al., 2016). BRD4’s intrinsic kinase activity phosphorylates Ser2 of the RNA polymerase II (Pol II) carboxy terminal domain (CTD), which hyperactivates Topoisomerase I, releasing the torsional stress imposed by early transcription elongation and facilitating pause release (Devaiah et al., 2012; Baranello et al., 2016). Thus, BRD4 coordinates chromatin organization and transcription via a stepwise process regulated through its pleiotropic enzymatic activities. BRD4 is also known to act as a passive scaffold that recruits various transcription factors to promoters and enhancers. Proteomic analysis of BRD4-associated factors identified a large series of transcription factors bound by BRD4, including the elongation factors PTEFb, JMJD6, and NSD3 (Rahman et al., 2011). In addition, a large number of splicing factors were complexed with BRD4. Among them were Fus, U2AF2, and members of the HnRNP and SR families.
Given the intimate relationship between splicing, transcription, and chromatin structure and the association of BRD4 with splicing factors, we considered the possibility that BRD4 contributes to the regulation of alternative splicing. Splicing in mammalian systems is mediated by the U2-dependent spliceosome, a multi-megadalton complex that assembles on intronic 5′and 3′splice sites (Will and Lührmann, 2011). Components of the spliceosome include the U1–U6 ribonucleoproteins (RNPs). The activity of the spliceosome is regulated by a series of transacting factors, such as the HnRNP and SR protein families, that regulate patterns of alternative splicing. Although it was originally thought that alternative splicing largely occurred post-transcriptionally, it is now clear that most alternative splicing events are co-transcriptional (Brugiolo et al., 2013; Oesterreich et al., 2016). Indeed, the two processes are closely linked and reciprocally regulate each other (Kornblihtt et al., 2004). Pol II plays a critical role in regulating alternative splicing—both in recruiting splicing factors and in defining exons. A number of regulators of alternative splicing, such as FUS, bind to the Ser2 phosphorylated form of the Pol II CTD (Schwartz et al., 2012). Lending support to the hypothesis that BRD4 regulates splicing was the report that the BET protein, BRDT, also forms a complex with spliceosome components (Berkovits et al., 2012) and that BRD4 depletion alters splicing patterns in response to heat shock (Hussong et al., 2017).
Here, we report that BRD4 modulates alternative splicing in vivo. In contrast to its effects on transcription, the deletion of BRD4 during thymocyte differentiation affected the patterns of alternative splicing in each of the developmental thymocyte subpopulations. Similarly, the inhibition or depletion of BRD4 in T-ALL tumor cells, by either the small molecule JQ1 or the degron dBET6, altered patterns of splicing. Significantly, BRD4 was shown to interact directly with components of the splicing machinery in vitro and to co-localize with them in vivo, both in cell lines and primary thymocytes. Taken together, these findings demonstrate that BRD4 contributes to establishing patterns of alternative splicing.
RESULTS
BRD4 Deficiency in Thymocytes Alters Alternative Splicing Patterns
While BRD4 HAT activity reduces nucleosome occupancy across active genes, and its kinase activity promotes transcription (Devaiah et al., 2012, 2016), the finding that BRD4 travels with the transcription elongation complex (Winter et al., 2017; Kanno et al., 2014) raised the possibility that it is also involved, directly or indirectly, in co-transcriptional RNA splicing. We previously reported that the conditional deletion of BRD4 at the DN stage of thymic development impairs normal differentiation without significantly altering RNA expression profiles, except at the ISP stage (Gegonne et al., 2018). Thus, the thymus provided us with an ideal system to examine the contribution of BRD4 to patterns of alternative splicing of endogenous genes in vivo. To assess the effect of BRD4 on alternative splicing in the thymus, we analyzed RNA-sequencing (RNA-seq) data from wild-type (WT) thymocytes and thymocytes deleted of BRD4 to determine whether BRD4 deletion affected the total number of alternative splice events in the thymus (Figure 1A). A total of 639 changes in alternative splicing were observed in the thymus upon BRD4 deletion. Of these changes, there was an increase in 323 splicing events and a decrease in 316 in the BRD4-deleted thymus (Figure S1A). Five different forms of alternative splicing have been defined: skipped exon (SE), alternative 5′ (A5SS) or alternative 3′ (A3SS) splice sites, mutually exclusive exons (MXEs), and retained intron (RI). The SE was the predominant form affected by BRD4 deletion, though all of the forms were affected to some extent (Figures 1A and S1A). Of note, there were no significant effects of BRD4 deletion on the level of any of the splicing factors (Gegonne et al., 2018). These data demonstrate that BRD4 contributes to the splicing of endogenous genes in vivo.
Figure 1. BRD4 Regulates Alternative Splicing in Murine Thymocytes.

(A) Schematic diagram depicting different types of alternatively spliced events (left). The bar graph (right) shows the distribution of alternatively spliced events among those that are differentially spliced in total thymus in BRD4 knock-out versus wild type (WT) (FDR < 0.05). Comparison of splicing events between WT and BRD4-deficient cells was based on transcripts expressed in both. (B) Developmental stages in thymocyte differentiation, DN (CD4, CD8 DN), ISP (CD8+ ISP), DP (CD4, CD8 DP), CD4, and CD8 single-positive thymocytes are shown. Arched arrows denote level of proliferative activity in DN and ISP thymocytes. (C) Bar graph showing the total number of differentially spliced events in the different thymocyte subpopulations in BRD4 knock-out versus wild-type thymus (FDR < 0.05), derived from RNA-seq analysis. BRD4 was conditionally deleted in DN thymocytes by LCK-Cre (Gegonne et al., 2018). Comparison of splicing events between WT and BRD4-deficient cells was based on transcripts expressed in both. See also Figure S1.
The generation of T cells in the thymus results from the sequential differentiation of a series of thymocyte precursors (Figure 1B). The earliest thymic immigrants from the bone marrow do not express the markers associated with mature T cells, namely the CD4/CD8 coreceptor molecules, and are called DNs. DN thymocytes differentiate into CD4+CD8+ DP thymocytes via an immature transitional cell that expresses only CD8 (ISP). DP thymocytes differentiate into the mature CD4+ and CD8+ SP thymocytes that seed the periphery. BRD4 is expressed in all five subpopulations, at approximately equal levels (Figure S1B). Deletion of BRD4 at the DN stage causes a selective defect in the RNA expression profile in the ISP thymocytes, targeting the cell cycle and metabolic pathways and severely inhibiting their further differentiation (Gegonne et al., 2018). In contrast, BRD4 had only a modest effect on the RNA expression profiles of the remaining thymocyte subpopulations, while their differentiation was noticeably affected. Therefore, we next asked whether BRD4 affected alternative splicing throughout thymocyte development by comparing the RNA splicing patterns from WT and BRD4-deficient thymocytes at each differentiation stage. As summarized in Figure 1C, splicing patterns were affected by BRD4 deletion in each of the subpopulations, with both increases and decreases in the different splicing events (Figure S1A). Consistent with BRD4 preferentially affecting the maturation of the ISP subpopulation (Gegonne et al., 2018), the largest differences occurred in this population. Namely, within the ISP population, there were a total of 241 differences in splicing events among expressed genes between the BRD4-deficient ISPs and the WT. BRD4 deletion similarly resulted in splicing event differences among expressed genes in the other subpopulations. Interestingly, most of the alternative splicing events were unique to each of the subpopulations, although a number were shared among two or three of the subpopulations (Tables 1 and S1; Figure S1C), suggesting that alternative splicing patterns are developmentally regulated.
Table 1.
Summary of Immune Relevant Genes Whose Patterns of Splicing Are Altered by BRD4 Deficiency and the Thymocyte Subset in which the Alteration Occurs
| Gene Name | Description | Thymocyte Subset |
|---|---|---|
| CD45, ptprc | protein tyrosine phosphatase, receptor type | CD4 |
| FYN | FYN proto-oncogene, Src family tyrosine kinase | ISP |
| IL2rg, γC | interleukin 2 receptor subunit gamma | DN, ISP, DP, SP |
| Arhgef1 | rho guanine nucleotide exchange factor 1 for RhoA GTPase signaling | ISP, DP |
| Picalm | phosphatidylinositol binding clathrin assembly protein | DN, CD4 |
| Arhgap17 | rho GTPase-activating protein 17 | DP |
| Arhgef2 | rho guanine nucleotide exchange factor 2 for RhoA GTPase signaling | ISP |
| Socs1 | suppressor of cytokine signaling 2 | ISP |
| Cd2bp2 | CD2 cytoplasmic tail binding protein 2 | DN |
| LAIR1 | leukocyte-associated immunoglobulin-like receptor 1 | ISP, DP, CD4 |
| RUNX2 | runt-related transcription factor 2 | ISP |
The observed changes in splicing patterns among the thymocyte subpopulations resulting from BRD4 deletion were not correlated with intron length, since the distribution of intronic lengths did not differ among the subpopulations and paralleled the overall genomic distribution (Figure S1D).
Genome browser views of the predicted alternatively spliced exons (Figure S2A) verified the altered patterns of splicing in BRD4-deficient thymocytes and were used to design RT-PCR primers such that amplification would generate different-sized DNA fragments, reflecting the different splice products (Figure 2). The splicing patterns of individual genes known to be developmentally regulated were first compared between the thymocyte subpopulations in the WT thymus. For example, it is known from protein expression studies that exon 5 of CD45 is subject to alternative splicing. Inclusion of exon 5 leads to the formation of the RB isoform, whereas exclusion is associated with the RO isoform. During thymocyte differentiation, there is a preferential exclusion of exon 5 in DN and DP thymocytes, followed by an increased inclusion in the more mature SP thymocytes (McNeill et al., 2004). Validation of the RNA-seq data by RT-PCR using primers that distinguish in the inclusion/exclusion of exon 5 of CD45 shows that exon 5 is preferentially included (A/A+B > 0.5) in SP CD8+ thymocytes, relative to the less mature populations (Figures 2A and 2B). Thus, the pattern of splicing observed in the RNA-seq analysis generally parallels that known for the cell-surface expression of CD45. Similarly, exon 15 of Arhgef1 is preferentially included in DP and CD8+ thymocytes (Figures 2C and 2D); exon 13 of Picalm is preferentially excluded in all WT subpopulations, except in the more mature SP CD4+ and CD8+ (Figures 2E and 2F). Therefore, alternative splicing is developmentally regulated during normal thymocyte maturation.
Figure 2. Validation of RNA-Seq Data by RT-PCR.

RNA from the different thymocyte subpopulations was subjected to RT-PCR for the indicated genes: CD45 (A and B), Arhgef1 (C and D), and Picalm (E and F). (A, C, and E) Upper panels: schematic diagrams depicting partial gene structure of the alternatively spliced genes CD45 (A), Arhgef1 (C), and Picalm (E). Rectangular boxes represent the exons, and the horizontal straight lines connecting the boxes represent the introns; the numbers below the boxes refer to the exon number of the gene, and numbers inside the boxes refer to the length of the exons; the numbers within the terminal exons do not refer to the actual exon length but the length amplifiable by the RT-PCR primers. The arrow heads show the approximate positions of the RT-PCR primers; boxes with hashed lines show the alternative exons; and curved lines connecting the boxes depict the splicing pattern. WT and KO refer to the splicing pattern prevalent in either the wild-type or knock-out thymocytes as determined by RNA-seq analysis. Lower panels: ethidium bromide stained agarose gels showing RT-PCR products derived from total RNA from BRD4 WT and KO thymocytes. (B, D, and F) Bar graphs of the RT-PCR results for CD45 (B), Arhgef1 (D), and Picalm (F). The ratios A/A+B (ratio of included exon transcript/total transcripts) were used as measure of alternative splicing and represent the average of three separate RT-PCR analyses. #, p < 0.05, significant difference between WT subpopulations, relative to WT DN; *p < 0.05, significant difference between WT and KO for the specific subpopulation. See also Figure S2.
We next compared the splicing patterns between WT and BRD4-deficient cells in the same subpopulations (Figure 2). Although BRD4 deletion did not markedly change the total level of expression of CD45, Arhgef1, or Picalm transcripts (Figure S2D), it did result in changes in their splicing patterns. For example, the frequency of inclusion of exon 5 of CD45 is significantly increased in BRD4-deficient CD4 cells, relative to WT (Figures 2A and 2B). In the other subpopulations, the frequency of CD45 exon 5 inclusion does not differ significantly between WT and BRD4-deficient thymocytes. In contrast, the frequency of inclusion of exon 15 of Arhgef1 is significantly decreased in ISP and DP cells; the inclusion of exon 13 of Picalm is also significantly decreased in BRD4-deficient DN and CD4 thymocytes (Figures 2C–2F). These results are consistent with the predicted changes from the RNA-seq data (Figure S2A).
The alternative splicing patterns of two additional genes that are not developmentally regulated in thymopoiesis, OS9 and Clcn 4–2, were also examined. As expected, there were no significant differences in the alternative splicing patterns among the WT thymocyte subpopulations. Deletion of BRD4 affected the alternative splicing of OS9 in all subpopulations and of Clcn4–2 in CD4+ and CD8+ thymocytes (Figures S2B and S2C).
Taken together, these results indicate that BRD4 differentially regulates splicing throughout thymopoiesis. Thus, BRD4 contributes to the regulation of splicing during thymocyte differentiation in vivo.
Loss of BRD4 in T-ALL Cells Results in Changes in Splicing Patterns
The finding that BRD4 contributes to the regulation of splicing in thymocytes led to the question of whether BRD4 plays a similar role in other cell types—in particular, tumor cell lines, where BRD4 is an important driver. The growth of T-ALL is severely inhibited either by the small molecule, JQ1, which blocks the binding of BRD4 to chromatin or by degron-mediated (dBET6) degradation of BRD4 (Winter et al., 2017). Although treatment with either JQ1 or dBET6 downregulated the expression of a large number of transcripts (Winter et al., 2017), their effects on the binding of BRD4 across the genome varied dramatically. Analysis of the published chromatin immunoprecipitation sequencing (ChIP-seq) datasets revealed that BRD4 peaks within the gene body represent over half of all peaks (4,065/ 7,241); one-quarter of the BRD4 peaks are in intergenic regions (1,827). Treatment of cells with dBET6, which leads to the degradation of BRD4, abolishes all BRD4 peaks, including at promoters (TSS), gene bodies, transcription termination sites (TTSs), and intergenic sites (Figure 3A). In contrast, treatment with JQ1, which releases BRD4 and stabilizes it (Jung et al., 2014; Jin et al., 2018), primarily affects BRD4 binding at the TSS. JQ1 has relatively little effect on the association of BRD4 within the gene body or the TTS or across intergenic regions. Since JQ1 functions by blocking BRD4 binding to chromatin through its bromodomains, these findings suggest that BRD4 association within the gene body does not depend on its bromodomains binding to acetylated lysines.
Figure 3. BET Inhibition (JQ1) or BET Degradation (dBET6) Alter Splicing Patterns in T Cell Acute Lymphoblastic Leukemia (T-ALL) Cells.

(A) Effect of JQ1 or dBET6 treatment on the binding of BRD4 across the gene. ALL, TSS+gene body+TTS+intergenic; TSS, transcription start site; Gene body, between TSS and TTS; TTS, transcription termination site; intergenic, all remaining sequences. The peak distribution, in the absence of treatment is as follows: TSS, 1123; gene body, 4065; TTS, 226; intergenic, 1827. (B) Bar graph showing the distribution of alternative splice events among the differentially spliced events in response to JQ1 treatment or dBET6 treatment in T-ALL cells. (C) Bar graph showing the fraction of alternative splice (AS) genes that also have BRD4 associated with them at the TSS (pkAS). The total number of BRD4 peaks detected at the TSS across the genome was 1123. (D) Bar graph showing the fraction of AS genes that are also differentially expressed (DE) in response to JQ1 or dBET6 treatment. p values for (C) and (D) were obtained using a hypergeometric test, which tests the probability that the frequency of AS genes derived from either DE genes (overlap) or genes with BRD4-bound TSS peaks is larger than expected from the population; a low p value suggests the enrichment of AS genes in either DE genes or genes with BRD4 TSS peaks. See also Figures S3 and S4.
To determine whether BRD4 regulates splicing patterns in T-ALL, we analyzed the published T-ALL RNA-seq datasets (Winter et al., 2017). This analysis revealed that treatment of TALL cells with either JQ1 or dBET6 resulted in 1,141 and 2,548 alternative splicing events, respectively, but did not affect the expression of splicing factor genes (Figure 3B; Table S2). Although the overall distributions among the different splice forms were similar in T-ALL treated with either dBET6 or JQ1, degradation of BRD4 by dBET6 resulted in a markedly larger and distinct effect on the total number of splice events than did the JQ1 treatment (Figures 3B and S3A). SE events represented over half of the changes resulting from either treatment and were distributed across the metagene (Figures S3B and S3C). MXEs represented the second-largest category of change (Figure 3B).
Alternative splicing events resulting from either JQ1 or dBET6 treatment are enriched among genes bound by BRD4 at the TSS (Figure 3C). The fraction of alternatively spliced events associated with BRD4 peaks is greater for dBET6 (14%) than for JQ1 (6%), possibly because dBET6 is more efficient that JQ1 in removing BRD4 from the TSS (Figure 3A). Similarly, alternative splicing events are enriched in genes that are differentially expressed (DE) in response to JQ1 or dBET6 (Figure 3D). Reflecting the fact that the effect of JQ1 on BRD4 is limited to the TSS, the fraction of alternative splicing events among differentially expressed genes (12%) is also lower than for dBET6 (47%). Alternative splicing events also occurred in genes whose level of expression was not directly affected by dBET6 or JQ1 (Figures 3C and S3A). This finding is consistent with the fact that changes in stress or signaling pathways alter splicing without changing expression (Zhang and Manley, 2013).
Among the SE events, dBET6 treatment resulted in preferential inclusion of alternative exons, while JQ1 treatment led to increased exon skipping (Figure S3D). These results indicate that dBET6-mediated BRD4 degradation modulates alternative splicing events via a mechanism that is distinct from that of JQ1-mediated BRD4 release from chromatin. This is consistent with the finding that dBET6 results in a loss of BRD4 across the entire gene, while JQ1 primarily displaces BRD4 bound to the promoter, not the gene body (Figure 3A) It is possible that JQ1 modulates splicing by releasing chromatin-bound BRD4 and redirecting it to either the transcription elongation or splicing machinery of expressed genes (Figures 4 and 6).
Figure 4. BRD4 Interacts with Splicing Factors In Vivo.

(A) Immunoblot of BRD4 immunoprecipitates from thymocyte nuclear extracts (with and without benzonase treatment) with indicated antibodies to splicing factors FUS, HnRNPL, and U1–70. The immunoprecipitates from a single extract were run on either a 6% gel to visualize BRD4 and Fus or on a 10% gel to visualize HnRNPL and U1–70. The values under the IP lanes indicate the enrichment of anti-BRD4 co-IP, relative to the IgG control. (B, left) Immunoblot of BRD4 immunoprecipitates from HeLa nuclear extracts with indicated antibodies to splicing factors FUS, HnRNPM, U1–70, and U1-A. (B, right) Immunoblot of FUS immunoprecipitates from HeLa nuclear extracts with indicated antibodies to BRD4 and splicing factors HnRNPM, U1–70, and U1-A. (C) Schematic representation of BRD4 and BRD4-deletion mutants. The coordinates of the mouse BRD4 mutations are as follows. WT BRD4, 1402 aa; DN, 722–1402 aa; ΔC, 1–699aa; ΔBD1, 146–1402 aa; ΔBD2+B, 1–349/599–1402 aa; ΔB, 1–502/549–1402 aa; ΔET, 1–600/684–1402 aa; ΔHAT, 1–1156/1198–1402 aa. (D) Immunoblots showing pull-down analysis of recombinant BRD4 with recombinant HnRNPM. rHnRNPM (0.25 μg) was pulled down with rflag-BRD4 (0.5 μg) immobilized on Flag beads. Immunoblots were with anti-HnRNPM (upper) and anti-BRD4 (lower). (E) Immunoblots showing pull-down analysis of recombinant BRD4 with recombinant FUS. rFUS (0.25 μg) was pulled down with rflag-BRD4 (0.5 μg) WT or equimolar amounts of N-terminal or C-terminal BRD4 truncation mutants immobilized on Flag beads. Immunoblots were with anti-FUS (upper) and anti-BRD4 (lower). (F) Binding of HnRNPM (left panel) and FUS (right panel) to BRD4 mutants was assessed in pull-down assays with rBRD4 immobilized on Flag beads and immunoblotting with appropriate antibodies. The results represent the average of two experiments. (G) Retention of FUS and HnRNPM to BRD4 mutants, relative to the WT, was quantified as the fraction of input and normalized to the extent of binding to BRD4 WT. All results are representative of at least two independent experiments. See also Figure S5.
Figure 6. BRD4 Co-localizes with Other Splicing Factors In Situ in Primary Thymocytes and HeLa Cells.

(A) Proximity ligation assays (PLAs) were performed on primary thymocytes with anti-BRD4 and the antibodies for the indicated splicing factors. The PLAs are all significantly above the single antibody controls (Figure S6C). (B) PLA was performed using anti-BRD4 and the antibodies for the indicated splicing factors on fixed HeLa cells that had been treated with JQ1 (500 nM)/ DMSO for 6 hr. There is no significant difference (p > 0.05) between the treated and control PLA samples for either HnRNPM or Fus; both PLAs are significantly above single antibody alone controls (Figure S6C). PLA interaction is shown in red; DAPI staining in blue. See also Figures S6C and S6D.
Importantly, alternative splicing events correlated with the binding of BRD4 at the alternative exons. Namely, at sites of alternative splicing events unique to dBET6 treatment, dBET6 but not JQ1 resulted in a loss of BRD4 binding (Figures S4A and S4B). At sites common to both dBET6 and JQ1, BRD4 binding was lost following both treatments (Figure S4C).
Analysis of the differentially spliced genes in both dBET6- and JQ1-treated cells shows that cell-cycle pathways are preferentially affected (Figure S4D). Taken together, these results demonstrate that BRD4 contributes to the regulation of splicing and suggest that the role of BRD4 in splicing is distinct from its role in chromatin organization and transcription.
These findings lead to the conclusion that BRD4 contributes to the regulation of alternative splicing through its interaction(s) within the gene body, independent of its binding to acetylated histones.
BRD4 Modulates Splicing of the Insulin Receptor Minigene
As demonstrated above, the deletion of BRD4 alters the patterns of alternative splicing in vivo in both normal and tumor cells. To further characterize the role of BRD4 in alternative splicing, we turned to a well-characterized system: the insulin receptor (IR) minigene (Figure S5A). The IR exists as two isoforms as a result of alternative splicing of exon 11. A minigene derived from the IR, in which exons 10–12 and the intervening introns are inserted downstream of the cytomegalovirus (CMV) promoter, has been used to demonstrate active regulation of exon 11 usage (Kosaki et al., 1998). Using this minigene construct, we examined the effect of overexpressing BRD4 on the splicing pattern of the minigene (Figure S5). Transfection of the IR minigene alone into HeLa cells resulted in the generation of two transcripts: one containing exons 10–11-12 (generating a 310-bp RT-PCR product) and one containing only exons 10 and 12 (generating a 274-bp RT-PCR product) (Figure S5B). Co-transfection of the IR minigene with a BRD4 expression construct resulted in an increase in the relative amount of exon 11 inclusion (Figures S5B and S5C). Thus, BRD4 expression contributes to the regulation of splicing of exon 11, providing further evidence for its role in alternative splicing.
BRD4 Directly Interacts with Components of the Splicing Machinery
Previous mass spec analysis of factors that co-immunoprecipitate with BRD4 had identified a large series of splicing factors, including FUS, HnRNPM, HnRNPL, U1–70, and U1-A (Rahman et al., 2011). Having demonstrated that BRD4 contributes to the regulation of alternative splicing, we sought to determine the mechanism by which BRD4 functions—namely, whether BRD4 acts directly on the splicing machinery or indirectly through some other mechanism. Since ChIP analyses have mapped BRD4 to the body of expressed genes, we first considered the possibility that BRD4 directly associates with splicing factors. Both thymocyte and HeLa cell nuclear extracts were subjected to IP with anti-BRD4 antibody and the ability to coimmunoprecipitate splicing factors assessed by immunoblotting. As shown in Figure 4A, anti-BRD4 co-precipitates a series of splicing factors including U1–70 and regulatory splicing factors HnRNPL and FUS from thymocyte extracts (Marko et al., 2014). Treatment of the extracts with benzonase, which removes RNA and DNA, did not affect the interaction of BRD4 with the splicing factors (Figure 4A). Therefore, we can conclude that the interaction is direct. Similarly, anti-BRD4 co-immunoprecipitates components of the spliceosome, U1–70, and U1A, as well as HnRNPM and FUS from HeLa nuclear extracts (Figure 4B, left). Conversely, IP of HeLa extracts with anti-FUS antibody co-immunoprecipitated BRD4, as well as other spliceosome components: HnRNPM, U1–70, and U1-A (Figure 4B, right). Thus, in both thymocytes and HeLa cells, BRD4 associates with the splicing complex.
Within the splicing complex, BRD4 binds directly to HnRNPM and FUS, as shown by pull-down experiments with recombinant proteins (Figures 4C–4G). Both rHnRNPM and rFUS were efficiently pulled down by rBRD4 (Figures 4D and 4E). Using N-terminal and C-terminal truncations of rBRD4, the binding site of FUS was mapped to the N terminus, validating the previous mass spec results (Rahman et al., 2011) (Figure 4E). Further fine mapping using BRD4-deletion mutants revealed that HnRNPM and FUS have different requirements for binding to BRD4. Thus, FUS efficiently binds to mutants deleted of the bromodomains, ET, or HAT domains, indicating that none of these domains is uniquely required for binding (Figures 4F, right, and 4G). In contrast, binding of HnRNPM to mutants deleted of the extra-terminal (ET) or the HAT domains is markedly reduced, but not eliminated (Figures 4F, left, and 4G), suggesting that both domains contribute to the interaction with BRD4. Interestingly, the effect of BRD4 on alternative splicing of the IR minigene was not significantly affected by the BRD4 deletions (Figure S5D). Taken together, these results demonstrate a direct interaction between BRD4 and components of the splicing machinery and are consistent with the interpretation that BRD4 directly contributes to the patterns of alternative splicing.
BRD4 and FUS Co-localize on the Genome
The above results demonstrate that BRD4 interacts with splicing factors, but they do not indicate whether the interaction occurs on chromatin or in the nucleoplasm. Published ChIP-seq datasets of BRD4 (Liu et al., 2013) and FUS (Schwartz et al., 2012) were re-analyzed to assess the extent of co-localization on chromatin. An analysis of the distribution of BRD4 and FUS across the metagene body shows the highest localization for both around the promoter and 5′UTR, with significant enrichment within all transcripts (Figures 5A and 5B). BRD4 and FUS, like H3K27Ac, are both highly enriched on chromatin within 1.5 Kb of the TSS (Figures 5A 5B, and S6A). To determine whether BRD4 and FUS are co-localized, an enriched heatmap analysis was performed. In this analysis, genes were rank ordered according to the level of binding of BRD4, centered on the TSS. The level of FUS binding was mapped relative to the rank-ordered binding of BRD4. As visualized in Figure 5C, the binding of FUS was directly correlated with that of BRD4. Additional co-localization analyses using two methods in Coloc-stats (Simovski et al., 2018) indicated that the association of FUS and BRD4 is statistically significant (p < 1e–04 by HyperBrowser and p < 2e–03 by GenometriCorr). The co-localization of BRD4, FUS, and H3K27Ac across three representative genes is further evidenced in genome browser views (Figures 5D and S6B).
Figure 5. BRD4 and FUS Co-localize on the Genome.

(A) Metagene profile of BRD4 and FUS CHIP datasets showing colocalization of BRD4 and FUS at the TSS. (B) Log2 enrichment of reads in genomic features along the metagene body. (C) Enrichment heatmap showing co-localization of BRD4 with FUS across the genome. (D) Genome browser views of DNAAF3, ROBO3, and MAN1A1, showing BRD4 and FUS co-localization around the TSS and gene body. See also Figures S6A and S6B.
BRD4 Co-localizes with Splicing Factors In Situ
The above results demonstrate that BRD4 can directly interact with components of the splicing machinery in vitro. Whether BRD4 is associated with the spliceosome in situ was determined by subjecting thymocytes and HeLa cells to a PLA, which detects proteins situated within 30–40 nm of each other within the cell. As shown in Figure 6A, in thymocytes, BRD4 is detected robustly in proximity to the splicing factors HnRNPL, FUS, and U1–70 (see Figure S6C for quantitation and additional controls). Similarly, in HeLa cells, BRD4 co-localizes with FUS, HnRNPM, U1–70, and U1-A but not with the negative control, nucleolin (Figure S6C). Furthermore, this co-localization is independent of the binding of BRD4 through its bromodomains, since treatment of HeLa cells with JQ1 does not disrupt the association (Figure 6B). Taken together, these results document the co-localization of BRD4 with the spliceosome complex in situ.
DISCUSSION
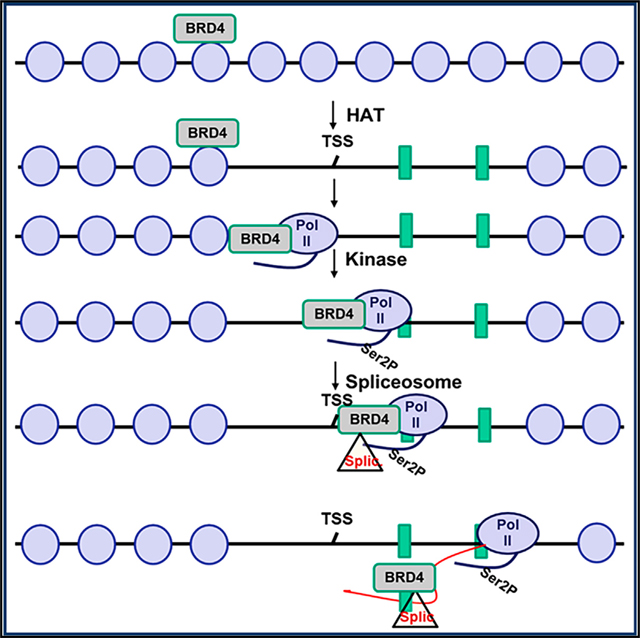
BRD4 is a member of the BET family of proteins that has been implicated in a variety of solid and hematological malignancies, as well as inflammatory diseases (Hajmirza et al., 2018). Although BRD4 is being actively studied as a therapeutic target, knowledge of its biological functions is still incomplete. It is already evident that BRD4 has pleiotropic activities: it serves as a scaffold for a variety of transcription factors, notably the transcription elongation factor, PTEFb, which it delivers to sites of transcription initiation (Patel et al., 2013). BRD4 also plays an active role in regulating both chromatin structure through its HAT activity and transcription through its kinase activity, which phosphorylates Ser2 of the Pol II CTD, thereby coordinating the regulation of gene expression (Devaiah et al., 2012, 2016). Since chromatin structure has been implicated in regulating splicing and phosphorylated Ser2 of the CTD recruits splicing factors (Luco et al., 2011; Naftelberg et al., 2015), these earlier studies suggested that BRD4 could regulate splicing. In the present study, we have established that BRD4 contributes to patterns of splicing both in normal cells in vivo and in cancer cells. Through its direct interaction with the splicing machinery on the genome, BRD4 acts to modulate exon usage. These findings lead to a model in which BRD4 functions to integrate the processes of chromatin structure, transcription, and splicing to ensure proper regulation of gene expression (Figure S6D).
The role for BRD4 in regulating alternative splicing in vivo was documented in the thymus, where deletion of BRD4 resulted in marked changes in the patterns of alternative splicing. This finding significantly extends previous studies in which thymocyte differentiation has been shown to depend on normal splicing patterns, since conditional deletion of HnRNPL in DN thymocytes results in aberrant splicing of CD45 and defective thymocyte maturation (Gaudreau et al., 2012). Furthermore, we have found that the transitions from one developmental stage to another— DN to ISP to DP to SP—are accompanied by changes in the patterns of splicing, indicating that splicing is developmentally regulated in the thymus. BRD4, which is expressed at approximately equal levels in each of these stages (Gegonne et al., 2018), contributes to this regulation since deletion of BRD4 results in changes in the splicing patterns at each stage of differentiation, preferentially affecting SE events. Since BRD4 does not affect the expression of splicing factors (Gegonne et al., 2018), we propose that it functions through its direct interactions with the splicing machinery.
Consistent with its role in cancer, BRD4 also contributes to patterns of alternative splicing in T-ALL cells, largely affecting the genes involved in cell-cycle regulation. Interestingly, degradation of BRD4 results in much larger changes in splicing patterns than the inhibition of BRD4 binding to chromatin through its bromodomains. This suggests that BRD4-mediated regulation of alternative splicing does not depend entirely on its binding to chromatin through its bromodomains. Further support for this perspective comes from the finding that BRD4’s co-localization with splicing factors is not perturbed by JQ1, which prevents binding to chromatin. In addition, whereas degradation of BRD4 targets both promoters and gene bodies, blocking of BRD4-mediated interactions with chromatin by JQ1 is largely confined to the promoter regions of genes, lending further support to the conclusion that BRD4’s interaction with the elongation and splicing machineries does not depend on its bromodomains. Whether it binds to chromatin at gene bodies directly by a bromodomain-independent mechanism or indirectly through its binding to either the transcription elongation factors or the splicing machinery remains to be determined. Our finding that BRD4 directly interacts with FUS, HnRNPM, and HnRNPL suggests that it can participate as an integral component of the splicing machinery. The precise mechanism(s) by which BRD4 contributes to the regulation of splicing remain to be determined.
Mutations in splicing factors have been reported in a number of different malignancies, including myelodysplastic syndromes; acute myeloid leukemia; and lung, breast, and pancreatic cancers, pointing to a critical role of splicing in cancer (Qiu et al., 2016; de Necochea-Campion et al., 2016; Martínez-Montiel et al., 2017; Wang et al., 2017). The splicing factor, HnRNPM, regulates the splicing pattern of CD44, which is known to play a role in cancer metastasis (Xu et al., 2014). BRD4 similarly plays a role in metastasis (Hu et al., 2015; Alsarraj and Hunter, 2012). Translocations of the regulator of splicing, FUS, lead to sarcomas (Crozat et al., 1993). More recently, an analysis of splicing patterns in nearly 9,000 tumors revealed extensive alternative splicing associated with transformation (Kahles et al., 2018). Surprisingly, in some tumors, the extent of novel splicing events was disproportionate to the mutational burden, suggesting that another regulatory mechanism may be at play (Kahles et al., 2018). Based on our present finding that BRD4 directly interacts with both HnRNPM and FUS, it is tempting to speculate that BRD4, which is frequently overexpressed in cancer, exerts its effect on tumorigenesis and metastasis at least in part through its regulation of splicing. Future studies will be directed at addressing these possibilities.
STAR★METHODS
LEAD CONTACT AND MATERIALS AVAILABILITY
Further information and requests for resources and reagents should be directed to and will be fulfilled by the Lead Contact, Dinah S. Singer (singerd@mail.nih.gov). All materials generated in this study are available for distribution following execution of an MTA.
EXPERIMENTAL MODEL AND SUBJECT DETAILS
Generation of BRD4 KO mice
The design of the Brd4 knockout (Brd4-) and Brd4-floxed (Brd4f) alleles, is described previously (Devaiah et al., 2016). Briefly, the knock-out allele (Brd4-) was generated by replacing a 2kb genomic region spanning exon 3 (which contains the ATG) with an exogenous 6.6Kb fragment carrying the β-geo (βgal) gene. In the Brd4f allele, exon 3 is flanked by LoxP sites. Brd4+/− mice were bred with mice expressing the Cre recombinase under the control of the LCK proximal promoter (Lee et al., 2001). Brd4f/f mice were then bred with Brd4 ± LCK-Cre+/− to produce Brd4f/− LCK-Cre+/− mice. Both male and female mice, 6–8 weeks, were used in the thymocyte analyses. The experiments were approved by the National Cancer Institute Animal Care and Use Committee (ASP 18–417, 18–430), mice were cared for in accordance with National Institutes of Health guidelines.
Purification of thymocyte subpopulations
Purification of thymocyte subpopulations was previously reported (Gegonne et al., 2018). Briefly, DP thymocytes were purified by flow cytometry based on the expression of both CD4 and CD8 surface markers; CD4 thymocytes were sorted by flow cytometry based on the expression of CD4 and TCRβ at the surface. DN, ISP and CD8 thymocytes were sorted by FACS respectively on their lack of CD4, CD8, TCRβ surface expression for DN, the expression of CD8 and low TCRβ expression for the ISP and finally the expression of CD8 and TCRβ at the surface for CD8 Single Positive cells.
Cell culture, Plasmids and Transient Transfections
HeLa cells were cultured in DMEM medium supplemented with 10% fetal bovine serum. The human Flag-tagged BRD4 WT in pCMV2 mammalian vector was a gift from E. Verdin (Gladstone Institute of Virology, University of California, San Francisco, CA). The human Flag-tagged BRD4 ΔET in pCMV2 mammalian vector was obtained from Addgene (Addgene plasmid number 21938) (Bisgrove et al., 2007). Human flag-hBRD4-HAT triple mutant is as described before (Devaiah et al., 2016). The murine Flag-tagged BRD4 WT cloned in pCDNA mammalian vector is as described before (Devaiah et al., 2012). Murine Flag-BRD4-kinase dead mutant was generated in the lab by cloning BRD4 with deletion in B-domain (502–549 aa) in pCDNA vector (J.D. Weissman, S. Hlavaty, B. Devaiah, and D.S.D., unpublished data). Murine Flag-His-BRD4 WT (1–1402 amino acids) in the pAcHLT-C baculovirus transfer vector was described previously (Maruyama et al., 2002). Murine Flag-His-BRD4 ΔN (722–1402 amino acids), ΔBD1 (146–1402 amino acids), ΔBD2+B (1–349/ 599–1402 amino acids), ΔB (1–502/549–1402 amino acids), ΔET (1–600/684–1402 amino acids), ΔHAT (1–1156/1198–1402 amino acids) and ΔC mutants (1–730 amino acids) were generated as drop-out mutants in the pAcHLT-C baculovirus transfer vector from the Flag- BRD4 WT (Devaiah et al., 2012; J.D. Weissman, S. Hlavaty, B. Devaiah, and D.S.D., unpublished data). pGST-WTFUS was obtained from Addgene (Addgene plasmid number 44978). Insulin receptor mini gene plasmid was a gift from Dr Stefans Stamm (University of Kentucky) (Kosaki et al., 1998). Transient co-transfections of BRD4 constructs with the insulin receptor minigene plasmid were done in HeLa cells using Lipofectamine (Invitrogen), as described by the manufacturer. The transfected cells were harvested after 18 h and analyzed for protein levels and alternative splicing as described below.
METHOD DETAILS
RNA-Seq analysis
RNA-Seq analysis was previously described in Devaiah et al., 2016 and Gegonne et al., 2018. Briefly, DN, ISP, DP, CD4 and CD8 thymocytes from WT and Brd4 cKO (Brd4f/- LCK-Cre+/−) males were purified as described above. RNA was isolated from WT and BRD4-deleted cells; libraries were made and sequenced as pair-end reads on an Hiseq platform according to established procedures. RNA-Seq reads were aligned to mouse reference genome (mm10) with STAR aligner (Dobin et al., 2013). Raw read counts were obtained using htseq-count (Anders et al., 2015) and normalized for further analysis using the built-in normalization algorithms of DESeq2 (Love et al., 2014).
Alternative splicing detection using RT-PCR
For mini gene assays, total RNA was isolated using RNAeasy mini plus kit (QIAGEN) as per the manufacturer’s instructions 18 hours post transfection. DNase (QIAGEN) treatment was carried out during RNA isolation as per the manufacturer’s instructions. Reverse transcription (RT) was performed in a 20 mL reaction system containing 2 mg of total RNA using insulin receptor plasmid specific reverse primers (0.5 μM) and the Thermoscript RT system (Invitrogen) as per the manufacturer’s instructions. For JQ1 treatment, cells transfected with either WT BRD4 or empty vector (14 hr) were treated with JQ1 (500 nM)/ DMSO for six hours followed by harvesting for RNA and protein extracts.
For alternative splicing validation of thymocytes RNA-Seq data, 30 ng of total RNA from WT and KO thymocytes (Gegonne et al., 2018) was used with gene specific primers (0.1 μM) using the Thermoscript RT system (Invitrogen) following the manufacturer’s instructions. Primer sequences are shown in the Key Resources Table.
All PCR amplifications were performed using 1 μl of RT reaction in a 20 μl of PCR reaction using Amplitaq gold 360 master mix as per the manufacturer’s instructions (Thermofisher). RT-PCR product (10 μl) were electrophoresed on ethidium bromide stained agarose gel and visualized under UV light using a gel documentation system. The densitometry analysis of the PCR bands was carried out using Image-Lite software from LI-cor (USA).
Protein purification
Flag-His-tagged BRD4, Flag-His-BRD4 ΔN, ΔC, ΔHAT, ΔET, ΔBD1 and ΔBD2+B mutants were purified as described earlier (Devaiah et al., 2012). Human HNRNPM protein was purchased (HNRNPM-5432H, Creative Biomart). GST-FUS was induced in E. coli cells (BL21 Rosetta-gami strain; Novagen) using 0.8 mM isopropyl_β-D-1-thiogalactopyranoside (IPTG) for 4 hr at RT and purified on Glutathione Agarose beads (Thermo Scientific Pierce) in the presence of Benzonase (200units/500ml Bacteria culture). After elution, glutathione was removed by buffer exchange and the GST-FUS protein concentrated on Amicon Ultra 50K filters (Millipore). Purified protein was recovered in 20 mM HEPES, pH 7.9, 100 mM NaCl, 0.2 mM EDTA, and 10% vol/vol glycerol and stored at −80°C.
Immunoprecipitation (IP) and Immunoblotting
For co-immunoprecipitation, 100 μg of HeLa nuclear extract was incubated with protein G agarose beads (Thermo Scientific) coated with 5 μg of appropriate antibody overnight at 4°C. Extract from 107 thymocytes was incubated with protein G agarose beads and 5ug of BRD4 antibody (A301–985A50, Bethyl laboratories).To test for recombinant Flag-BRD4 direct binding to recombinant GST-FUS or HnRNPM, anti-Flag antibody (GenScript A 00187) bound Dynabeads Protein G (ThermoFisher) were incubated with equimolar concentrations of proteins for 2 hr at 25°C. To test the binding of the BRD4 mutants to recombinant GST-FUS or HnRNPM, the BRD4 mutants were incubated with each of the proteins, together with anti-Flag antibody and beads for 2 hr at 25°C. The beads were then washed two times with 50 mM Tris, pH 7.5, 137 mM NaCl and 0.5% Nonidet P-40 and two times with 20 mM Tris, pH 7.5, 100 mM NaCl and 0.1% Tween. The co-immunoprecipitated proteins were eluted by heating in 2 × SDS loading buffer at 80°C for 10 min. For immunoblotting, proteins were separated on SDS/PAGE gels, transferred onto a nitrocellulose membrane (GE Healthcare). For in vivo co-immunoprecipitation, the membrane was partitioned into three horizontal strips to probe multiple proteins with different molecular weight. After blocking the membrane with 5% fat-free milk in TBST, the blots were incubated with the primary antibodies BRD4 antibody (A301–985A50, Bethyl laboratories), Anti-FUS (4H11) mouse monoclonal Antibody (sc-47711, Santa Cruz biotechnology), Anti-FUS rabbit polyclonal Antibody (ThermoFisher PA5–23696). HNRNP M1–4 mouse monoclonal IgG1 Antibody (1D8, sc-20002, Santa cruz biotechnology), HNRNP M1–4 Rabbit polyclonal Antibody (Bethyl A303 910A), HNRNP-L Rabbit polyclonal Antibody (Bethyl A303 895A), Anti-U1A antibody (ab55751, abcam), Anti-U1–70K mouse monoclonal Antibody, clone 9C4.1, (05–1588, EMD Millipore), anti-flag rabbit polyclonal Antibody (F7425, Sigma). Anti-TBP antibody (ab51841,Abcam). The secondary antibodies IRDye®800CM or IRDye®680RD (LI-COR Biosciences) were used for protein detection. All immunoblot analyses were performed using the Odyssey infrared scanner and secondary antibodies from Li-Cor. The signal quantification was done using Image studio lite software.
Proximity ligation assay (PLA)
For PLA in thymocytes, DN, ISP and CD8 single positive cells were selected using the Dynabeads Untouched Mouse CD8 cells kit. 4×10⁴ cells were plated for 2 hours in μ-Slide Angiogenesis (I-bidi). For PLA using HeLa cells, approximately 104 cells were grown overnight in μ-Slide Angiogenesis (I-bidi). PLA was conducted using the Duolink® In Situ PLA® Kit (Sigma) according to the manufacturer’s protocol. For JQ1 treatment, the cells were treated with JQ1 (500 nM) or DMSO 6 hr before PLA. The primary antibodies used were as follows: anti-BRD4 rabbit polyclonal antibody was generated against the BRD4 C-terminal peptide (CFQSDLLSIFEENLF) by a custom antibody service (Covance) (1:100 dilution) (Dey et al., 2000), anti-FUS (4H11) mouse monoclonal antibody (sc-47711, Santa cruz biotechnology) (1:100 dilution), HNRNP M1–4 mouse monoclonal IgG1 antibody (1D8, sc-20002, Santa cruz biotechnology) (1:100 dilution), HNRNPL mouse monoclonal Antibody (sc 32317, Santa Cruz biotechnology) (1:100 dilution), anti-U1A antibody (ab55751, abcam) (1:100 dilution), anti-U1–70K Mouse Monoclonal antibody, clone 9C4.1, (05–1588, EMD miilipore) (1:100 dilution) and anti-Nucleolin (sc-8031, Santa Cruz biotechnology) (1:100 dilution). Cells were observed with either the Zeiss LSM880 Multi-Photon Confocal Microscope or the Yokogawa spinning disk confocal / Nikon Eclipse Ti2 microscope. The signal quantification was done using ImageJ with a custom macro.
Bioinformatics analysis
Analysis of alternative splicing in thymocyte subpopulation was performed on the datasets reported by Gegonne et al. (2018). For BRD4-FUS co-localization analysis (Figures 5 and S6), the following GEO datasets were used: BRD4 CHIP-Seq samples BRD4–1, BRD4–2 in HEK293T cells using GEO dataset GSE51633 (Liu et al., 2013) and FUS CHIP-Seq for Si-control, Si-FUS in HEK293T cells using NCBI BioProject dataset PRJNA185008 (Schwartz et al., 2012). GEO dataset GSE79290 was used for alternative splicing and BRD4 ChIP-Seq analysis in T-ALL cells (Winter et al., 2017). RNA-Seq datasets corresponding to the 6 hr time point after JQ1 and dBET6 treatment in T-ALL cells were used for alternative splicing and differential expression analysis. The Genomic browser views for specific differentially spliced genes from BRD4 CHIP-Seq datasets (DMSO, JQ1, dBET6) in T-ALL cells were plotted using integrated genomic browser software (Nicol et al., 2009).
For RNA-Seq analysis, sequencing reads were aligned to the reference genome (mouse: mm10 and human: hg19) with STAR aligner (v2.5.2b). Differential gene expression analysis was performed with DESeq2; a gene was considered as differentially expressed with its fold-change > 1.5 and FDR adjusted p value < 0.01, as previously described (Gegonne et al., 2018). Alternative splicing was analyzed by rMATS v3.2.5 (Shen et al., 2014); significant events were defined as events using junction counts with its FDR adjusted p value < 0.05 and absolute value of inclusion level difference (IncLevelDifference) > 0.1. The tool rmat2sashimiplot was used to draw alternative splicing plot (sashimiplot). For analysis of intronic length of skipped exon events, the lengths between upstream exon end site and downstream exon start site of skipped exon were calculated for events with inclusion level high in KO or WT and comparison was done using Wilcoxon test.
For ChIP-Seq analysis, sequencing reads were aligned to the human reference genome hg19 by using Bowtie2 (v2–2.2.3). The duplicated reads were removed and only uniquely mapped reads were used for peak identification. ChIP-Seq peaks were called using macs 2.1.0 (Model based analysis of ChIP-Seq) peak calling algorithm to identify enriched regions (Zhang et al., 2008). Default parameters with an enrichment qvalue cutoff of 0.05 and model fold of [5, 50] were used for calling significant regions. The downstream enrichment analysis was performed using hypergeometric test. Co-localization analyses used two methods in Coloc-stats (Simovski et al., 2018).
QUANTIFICATION AND STATISTICAL ANALYSIS
The data are presented as means ± standard deviation (SD) of at least three independent experiments. The p values indicate statistical significance, which is obtained using Student’s t test (two-tailed, unpaired).
DATA AND CODE AVAILABILITY
This study did not generate any new datasets.
Supplementary Material
KEY RESOURCES TABLE.
| REAGENT or RESOURCE | SOURCE | IDENTIFIER |
|---|---|---|
| Antibodies | ||
| Rabbit polyclonal anti- BRD4 | Bethyl laboratories | Cat# A301–985A50; RRID:AB_2631449 |
| Mouse monoclonal anti- FUS IgG1 (clone 4H11) | Santa Cruz biotechnology | Cat# sc-47711; RRID: AB_2105208 |
| Rabbit polyclonal anti-FUS | ThermoFisher Scientific | Cat# PA5–23696; RRID: AB_2541196 |
| Mouse monoclonal anti- HNRNP M1–4 IgG1 (clone 1D8) | Santa Cruz biotechnology | Cat# sc-20002; RRID: AB_627739 |
| Rabbit polyclonal anti- HNRNP M1–4 | Bethyl laboratories | Cat# A303 910A; RRID: AB_2781562 |
| Rabbit polyclonal anti- HNRNP-L | Bethyl laboratories | Cat# A303 895A; RRID: AB_2781551 |
| Mouse monoclonal anti- U1-A | Santa Cruz biotechnology | Cat# ab55751; RRID: AB_2193711 |
| Mouse monoclonal anti-U1–70K (clone 9C4.1) | EMD Millipore | Cat# 05–1588; RRID: AB_10805959 |
| Rabbit polyclonal anti-flag, | Sigma | Cat# F7425; RRID: AB_439687 |
| Mouse monoclonal anti-DYKDDDDK tag, | GenScript | Cat# A00187; RRID: AB_1720813 |
| Mouse monoclonal anti-TBP | abcam | Cat# ab51841; RRID: AB_945758 |
| Rabbit polyclonal anti- BRD4 [Epitope BRD4 C-terminal peptide (CFQSDLLSIFEENLF)] | Covance (Cutom antibody synthesis); Dey et al., 2000 | N/A |
| Mouse monoclonal anti- Nucleolin (C23, clone MS-3) | Santa Cruz biotechnology | Cat# Sc-8031; RRID: AB_670271 |
| IRDye®680RD Goat anti-mouse IgG Secondary Antibody | LI-COR Biosciences | Cat# P/N: 926–68070; RRID: AB_10956588 |
| IRDye® 800CW Goat anti-Rabbit IgG Secondary Antibody | LI-COR Biosciences | Cat# P/N: 926–32211; RRID: AB_621843 |
| Bacterial Strains | ||
| Rosetta-gami (DE3) pLysS Cells | Novagen | Cat# 71352 |
| Chemicals, Peptides, and Recombinant Proteins | ||
| (+)- JQ1 | BPS Bioscience | 27400 |
| Recombinant Human HNRNPM protein, His-tagged | Creative Biomart | 5432H |
| Glutathione Agarose beads | Thermo Scientific | 16100 |
| Protein-G Agarose Beads | Thermo Scientific | 20398 |
| Benzonase | Sigma | E1014 |
| RNase-Free DNase Set | QIAGEN | 79254 |
| Critical Commercial Assays | ||
| Duolink® In Situ Red Starter Kit Mouse/Rabbit | Sigma-Aldrich | DUO92101 |
| ThermoScript RT-PCR System for First-Strand cDNA Synthesis | Invitrogen | 11146024 |
| AmpliTaq Gold 360 Master Mix | ThermoFisher Scientific | 4398881 |
| RNAeasy mini plus kit | QIAGEN | 74134 |
| Dynabeads Untouched Mouse CD8 cells kit | Thermofisher | 11417D |
| Deposited Data | ||
| BRD4 chip-seq samples BRD4–1, BRD4–2 in HEK293T cells | Liu et al., 2013 | GEO: GSE51633 |
| FUS chip-seq for Si-control, Si-FUS in HEK293T cells | Schwartz et al., 2012 | BioProject: PRJNA185008 |
| RNA-Seq data and BRD4 ChIP-seq analysis in T-ALL cells | Winter et al., 2017 | GEO: GSE79290 |
| RNA-Seq data in mice thymocytes | Gegonne et al., 2018 | GEO: GSE109255 |
| Experimental Models: Cell Lines | ||
| HeLa Cell Lines | ATCC | CRM-CCL-2; RRID: CVCL_0030 |
| Experimental Models: Organisms/Strains | ||
| Mouse: Brd4f/f | Devaiah et al., 2016; Gegonne et al., 2018 | NA |
| Mouse: Brd4 ± LCK-Cre+/− | Devaiah et al., 2016; Gegonne et al., 2018 | NA |
| Mouse: Brd4f/− LCK-Cre+/− | Devaiah et al., 2016; Gegonne et al., 2018 | NA |
| Mouse: LCK-Cre+/− | Lee et al., 2001 | Taconic Biosciences |
| Oligonucleotides | ||
| Primer: Insulin receptor-forward: TAATACGACTCACTATAGGGC | This paper | N/A |
| Primer: Insulin receptor-reverse: GCTGCAATAAACAAGTTCTGC | This paper | N/A |
| Primer: CD45-forward: CAAACACCTACACCCAGTGAT | This paper | N/A |
| Primer: CD45-reverse: CACATGTTTGCTTCGTTGTGGT | This paper | N/A |
| Primer: Arhgef1-forward: CGCAGGAGCCAGGGGATACA | This paper | N/A |
| Primer: Arhgef1-reverse: CTTGGCTCTTGGGCAGACTGAGCA | This paper | N/A |
| Primer: Picalm-forward: CTAAGCTGCCAAATGACCTGCTTGA | This paper | N/A |
| Primer: Picalm-reverse: AAGGCCAGCTGAAGAATGTGGCTGTGCA | This paper | N/A |
| Primer: OS9-forward: AGAACCAGAGTCCAGAGCTTGTGCA | This paper | N/A |
| Primer: OS9-reverse: TCAGTCAGCCAGCGTGTGTCCTCTT | This paper | N/A |
| Primer: Clcn4–2-forward: AGAGGAGGATGATCTAGGACGCTGT | This paper | N/A |
| Primer: Clcn4–2-reverse: TCCAGCAGGCTCTTGATGAACTCCCA | This paper | N/A |
| Recombinant DNA | ||
| Human Flag-tagged BRD4 WT in pCMV2 mammalian vector | E. Verdin (Gladstone Institute of Virology, University of California, San Francisco, CA) | N/A |
| Human Flag-tagged BRD4 ΔET in pCMV2 mammalian vector | ADDgene (Bisgrove et al., 2007) | #21938; RRID: Addgene_21938 |
| Human flag-hBRD4-HAT triple mutant | Devaiah et al., 2016 | N/A |
| Murine Flag-tagged BRD4 WT cloned in pCDNA | Devaiah et al., 2012 | N/A |
| Murine Flag-BRD4-kinase dead mutant in pCDNA vector | J.D. Weissman, S. Hlavaty, B. Devaiah, and D.S.D., unpublished data | N/A |
| Murine Flag-His-BRD4 WT (1–1402 amino acids) in the pAcHLT-C baculovirus transfer vector | Maruyama et al., 2002 | N/A |
| Murine Flag-His-BRD4 ΔN (722–1402 amino acids) in the pAcHLT-C baculovirus transfer vector | Devaiah et al., 2012 | N/A |
| ΔBD1 (146–1402 amino acids) in the pAcHLT-C baculovirus transfer vector | Devaiah et al., 2012 | N/A |
| ΔBD2+B (1–349/599–1402 amino acids) in the pAcHLT-C baculovirus transfer vector | Devaiah et al., 2012 | N/A |
| ΔB (1–502/549–1402 amino acids) in the pAcHLT-C baculovirus transfer vector | Devaiah et al., 2012 | N/A |
| ΔET (1–600/684–1402 amino acids) in the pAcHLT-C baculovirus transfer vector | Devaiah et al., 2012 | N/A |
| ΔHAT (1–1156/1198–1402 amino acids) in the pAcHLT-C baculovirus transfer vector | Devaiah et al., 2012 | N/A |
| ΔC mutants (1–730 amino acids) in the pAcHLT-C baculovirus transfer vector | Devaiah et al., 2012 | N/A |
| pGST-WT-FUS | Addgene | 44978; RRID:Addgene_44978 |
| Insulin receptor mini gene plasmid | Dr Stefans Stamm (University of Kentucky); Kosaki et al., 1998 | N/A |
| Software and Algorithms | ||
| Image studio Lite | Li-Cor | https://www.licor.com/islite |
| ImageJ | Schneider et al., 2012 | https://imagej.nih.gov/ij/ |
| Venn | N/A | http://bioinformatics.psb.ugent.be/webtools/Venn/ |
| rmat2sashimiplot | https://github.com/Xinglab/rmats2sashimiplot | |
| Bowtie2 (v2–2.2.3) | Langmead and Salzberg, 2012 | https://github.com/BenLangmead/bowtie 2M |
| Macs 2.1.0 | Zhang et al., 2008 | https://github.com/taoliu/MACS |
| STAR aligner (v2.5.2b) for sequence alignment RNA-seq analysis | Dobin et al., 2013 | https://github.com/alexdobin/STAR |
| rMATS for alternative splicing analysis | Shen et al., 2014 | http://rnaseqmats.sourceforge.net |
| Coloc-stats | Simovski et al., 2018 | https://hyperbrowser.uio.no/coloc-stats/ |
Highlights.
BRD4, which regulates chromatin and Pol CTD phosphorylation, also regulates RNA splicing
BRD4 directly interacts with the splicing machinery
Thymocyte subsets have distinct patterns of alternative splicing
Depletion of BRD4 in T-ALL cells and thymocytes alters patterns of RNA splicing
ACKNOWLEDGMENTS
The authors gratefully acknowledge Drs. Ranjan Sen, Dan Larson, Ananda Roy, and Richard Hodes for their critical review of the manuscript; the rest of the Singer lab for helpful discussions; and Michael Kruhlak and Jan Wisniewski for assistance with imaging. This work was supported by the Intramural Research Program of the NIH, National Cancer Institute, Center for Cancer Research.
Footnotes
DECLARATION OF INTERESTS
The authors declare no competing interests.
SUPPLEMENTAL INFORMATION
Supplemental Information can be found online at https://doi.org/10.1016/j.celrep.2019.10.066.
REFERENCES
- Alsarraj J, and Hunter KW (2012). Bromodomain-Containing Protein 4: A Dynamic Regulator of Breast Cancer Metastasis through Modulation of the Extracellular Matrix. Int. J. Breast Cancer 2012, 670632. [DOI] [PMC free article] [PubMed] [Google Scholar]
- Anders S, Pyl PT, and Huber W (2015). HTSeq–a Python framework to work with high-throughput sequencing data. Bioinformatics 31, 166–169. [DOI] [PMC free article] [PubMed] [Google Scholar]
- Baranello L, Wojtowicz D, Cui K, Devaiah BN, Chung HJ, Chan-Salis KY, Guha R, Wilson K, Zhang X, Zhang H, et al. (2016). RNA Polymerase II Regulates Topoisomerase 1 Activity to Favor Efficient Transcription. Cell 165, 357–371. [DOI] [PMC free article] [PubMed] [Google Scholar]
- Berkovits BD, Wang L, Guarnieri P, and Wolgemuth DJ (2012). The testis-specific double bromodomain-containing protein BRDT forms a complex with multiple spliceosome components and is required for mRNA splicing and 3′-UTR truncation in round spermatids. Nucleic Acids Res. 40, 7162–7175. [DOI] [PMC free article] [PubMed] [Google Scholar]
- Bisgrove DA, Mahmoudi T, Henklein P, and Verdin E (2007). Conserved P-TEFb-interacting domain of BRD4 inhibits HIV transcription. Proc. Natl. Acad. Sci. USA 104, 13690–13695. [DOI] [PMC free article] [PubMed] [Google Scholar]
- Bolden JE, Tasdemir N, Dow LE, van Es JH, Wilkinson JE, Zhao Z, Clevers H, and Lowe SW (2014). Inducible in vivo silencing of Brd4 identifies potential toxicities of sustained BET protein inhibition. Cell Rep. 8, 1919–1929. [DOI] [PMC free article] [PubMed] [Google Scholar]
- Brugiolo M, Herzel L, and Neugebauer KM (2013). Counting on co-transcriptional splicing. F1000Prime Rep. 5, 9. [DOI] [PMC free article] [PubMed] [Google Scholar]
- Cheung KL, Zhang F, Jaganathan A, Sharma R, Zhang Q, Konuma T, Shen T, Lee JY, Ren C, Chen CH, et al. (2017). Distinct roles of Brd2 and Brd4 in potentiating the transcriptional program for Th17 cell differentiation. Mol. Cell 65, 1068–1080.e5. [DOI] [PMC free article] [PubMed] [Google Scholar]
- Crozat A, Aman P, Mandahl N, and Ron D (1993). Fusion of CHOP to a novel RNA-binding protein in human myxoid liposarcoma. Nature 363, 640–644. [DOI] [PubMed] [Google Scholar]
- de Necochea-Campion R, Shouse GP, Zhou Q, Mirshahidi S, and Chen CS (2016). Aberrant splicing and drug resistance in AML. J. Hematol. Oncol 9, 85. [DOI] [PMC free article] [PubMed] [Google Scholar]
- Devaiah BN, Lewis BA, Cherman N, Hewitt MC, Albrecht BK, Robey PG, Ozato K, Sims RJ III, and Singer DS (2012). BRD4 is an atypical kinase that phosphorylates serine2 of the RNA polymerase II carboxy-terminal domain. Proc. Natl. Acad. Sci. USA 109, 6927–6932. [DOI] [PMC free article] [PubMed] [Google Scholar]
- Devaiah BN, Case-Borden C, Gegonne A, Hsu CH, Chen Q, Meerzaman D, Dey A, Ozato K, and Singer DS (2016). BRD4 is a histone acetyltransferase that evicts nucleosomes from chromatin. Nat. Struct. Mol. Biol 23, 540–548. [DOI] [PMC free article] [PubMed] [Google Scholar]
- Dey A, Yang W, Gegonne A, Nishiyama A, Pan R, Yagi R, Grinberg A, Finkelman FD, Pfeifer K, Zhu J, et al. (2019). BRD4 directs hematopoietic stem cell development and modulates macrophage inflammatory responses. EMBO J. 38, e100293. [DOI] [PMC free article] [PubMed] [Google Scholar]
- Dey A, Ellenberg J, Farina A, Coleman AE, Maruyama T, Sciortino S, Lippincott-Schwartz J, and Ozato K (2000). A bromodomain protein, MCAP, associates with mitotic chromosomes and affects G(2)-to-M transition. Mol. Cell. Biol 20, 6537–6549. [DOI] [PMC free article] [PubMed] [Google Scholar]
- Dobin A, Davis CA, Schlesinger F, Drenkow J, Zaleski C, Jha S, Batut P, Chaisson M, and Gingeras TR (2013). STAR: ultrafast universal RNA-seq aligner. Bioinformatics 29, 15–21. [DOI] [PMC free article] [PubMed] [Google Scholar]
- Gaudreau MC, Heyd F, Bastien R, Wilhelm B, and Möröy T (2012). Alternative splicing controlled by heterogeneous nuclear ribonucleoprotein L regulates development, proliferation, and migration of thymic pre-T cells. J. Immunol 188, 5377–5388. [DOI] [PubMed] [Google Scholar]
- Gegonne A, Chen QR, Dey A, Etzensperger R, Tai X, Singer A, Meerzaman D, Ozato K, and Singer DS (2018). Immature CD8 Single-Positive Thymocytes Are a Molecularly Distinct Subpopulation, Selectively Dependent on BRD4 for Their Differentiation. Cell Rep. 24, 117–129. [DOI] [PMC free article] [PubMed] [Google Scholar]
- Hajmirza A, Emadali A, Gauthier A, Casasnovas O, Gressin R, and Callanan MB (2018). BET Family Protein BRD4: An Emerging Actor in NFκB Signaling in Inflammation and Cancer. Biomedicines 6, E16. [DOI] [PMC free article] [PubMed] [Google Scholar]
- Hu Y, Zhou J, Ye F, Xiong H, Peng L, Zheng Z, Xu F, Cui M, Wei C, Wang X, et al. (2015). BRD4 inhibitor inhibits colorectal cancer growth and metastasis. Int. J. Mol. Sci 16, 1928–1948. [DOI] [PMC free article] [PubMed] [Google Scholar]
- Hussong M, Kaehler C, Kerick M, Grimm C, Franz A, Timmermann B, Welzel F, Isensee J, Hucho T, Krobitsch S, and Schweiger MR (2017). The bromodomain protein BRD4 regulates splicing during heat shock. Nucleic Acids Res. 45, 382–394. [DOI] [PMC free article] [PubMed] [Google Scholar]
- Jin X, Yan Y, Wang D, Ding D, Ma T, Ye Z, Jimenez R, Wang L, Wu H, and Huang H (2018). DUB3 Promotes BET Inhibitor Resistance and Cancer Progression by Deubiquitinating BRD4. Mol. Cell 71, 592–605.e4. [DOI] [PMC free article] [PubMed] [Google Scholar]
- Jung M, Philpott M, Müller S, Schulze J, Badock V, Eberspächer U, Moosmayer D, Bader B, Schmees N, Fernández-Montalván A, and Haendler B (2014). Affinity map of bromodomain protein 4 (BRD4) interactions with the histone H4 tail and the small molecule inhibitor JQ1. J. Biol. Chem 289, 9304–9319. [DOI] [PMC free article] [PubMed] [Google Scholar]
- Kahles A, Lehmann KV, Toussaint NC, Hüser M, Stark SG, Sachsenberg T, Stegle O, Kohlbacher O, Sander C, and Rätsch G; Cancer Genome Atlas Research Network (2018). Comprehensive Analysis of Alternative Splicing Across Tumors from 8,705 Patients. Cancer Cell 34, 211–224.e6. [DOI] [PMC free article] [PubMed] [Google Scholar]
- Kanno T, Kanno Y, LeRoy G, Campos E, Sun HW, Brooks SR, Vahedi G, Heightman TD, Garcia BA, Reinberg D, et al. (2014). BRD4 assists elongation of both coding and enhancer RNAs by interacting with acetylated histones. Nat. Struct. Mol. Biol 21, 1047–1057. [DOI] [PMC free article] [PubMed] [Google Scholar]
- Kornblihtt AR, de la Mata M, Fededa JP, Munoz MJ, and Nogues G (2004). Multiple links between transcription and splicing. RNA 10, 1489–1498. [DOI] [PMC free article] [PubMed] [Google Scholar]
- Kosaki A, Nelson J, and Webster NJ (1998). Identification of intron and exon sequences involved in alternative splicing of insulin receptor premRNA. J. Biol. Chem 273, 10331–10337. [DOI] [PubMed] [Google Scholar]
- Langmead B, and Salzberg SL (2012). Fast gapped-read alignment with Bowtie 2. Nat. Methods 9, 357–359. [DOI] [PMC free article] [PubMed] [Google Scholar]
- Lee PP, Fitzpatrick DR, Beard C, Jessup HK, Lehar S, Makar KW, Pérez-Melgosa M, Sweetser MT, Schlissel MS, Nguyen S, et al. (2001). A critical role for Dnmt1 and DNA methylation in T cell development, function, and survival. Immunity 15, 763–774. [DOI] [PubMed] [Google Scholar]
- Liu W, Ma Q, Wong K, Li W, Ohgi K, Zhang J, Aggarwal A, and Rosenfeld MG (2013). Brd4 and JMJD6-associated anti-pause enhancers in regulation of transcriptional pause release. Cell 155, 1581–1595. [DOI] [PMC free article] [PubMed] [Google Scholar]
- Love MI, Huber W, and Anders S (2014). Moderated estimation of fold change and dispersion for RNA-seq data with DESeq2. Genome Biol. 15, 550. [DOI] [PMC free article] [PubMed] [Google Scholar]
- Luco RF, Allo M, Schor IE, Kornblihtt AR, and Misteli T (2011). Epigenetics in alternative pre-mRNA splicing. Cell 144, 16–26. [DOI] [PMC free article] [PubMed] [Google Scholar]
- Marko M, Leichter M, Patrinou-Georgoula M, and Guialis A (2014). Selective interactions of hnRNP M isoforms with the TET proteins TAF15 and TLS/ FUS. Mol. Biol. Rep 41, 2687–2695. [DOI] [PubMed] [Google Scholar]
- Martínez-Montiel N, Anaya-Ruiz M, Pérez-Santos M, and Martínez-Contreras RD (2017). Alternative Splicing in Breast Cancer and the Potential Development of Therapeutic Tools. Genes (Basel) 8, E217. [DOI] [PMC free article] [PubMed] [Google Scholar]
- Maruyama T, Farina A, Dey A, Cheong J, Bermudez VP, Tamura T, Sciortino S, Shuman J, Hurwitz J, and Ozato K (2002). A Mammalian bromodomain protein, brd4, interacts with replication factor C and inhibits progression to S phase. Mol. Cell Biol 22, 6509–6520. [DOI] [PMC free article] [PubMed] [Google Scholar]
- McNeill L, Cassady RL, Sarkardei S, Cooper JC, Morgan G, and Alexander DR (2004). CD45 isoforms in T cell signalling and development. Immunol. Lett 92, 125–134. [DOI] [PubMed] [Google Scholar]
- Mele DA, Salmeron A, Ghosh S, Huang HR, Bryant BM, and Lora JM (2013). BET bromodomain inhibition suppresses TH17-mediated pathology. J. Exp. Med 210, 2181–2190. [DOI] [PMC free article] [PubMed] [Google Scholar]
- Naftelberg S, Schor IE, Ast G, and Kornblihtt AR (2015). Regulation of alternative splicing through coupling with transcription and chromatin structure. Annu. Rev. Biochem 84, 165–198. [DOI] [PubMed] [Google Scholar]
- Nicol JW, Helt GA, Blanchard SG Jr., Raja A, and Loraine AE (2009). The Integrated Genome Browser: free software for distribution and exploration of genome-scale datasets. Bioinformatics 25, 2730–2731. [DOI] [PMC free article] [PubMed] [Google Scholar]
- Oesterreich FC, Herzel L, Straube K, Hujer K, Howard J, and Neugebauer KM (2016). Splicing of Nascent RNA Coincides with Intron Exit from RNA Polymerase II. Cell 165, 372–381. [DOI] [PMC free article] [PubMed] [Google Scholar]
- Patel MC, Debrosse M, Smith M, Dey A, Huynh W, Sarai N, Heightman TD, Tamura T, and Ozato K (2013). BRD4 coordinates recruitment of pause release factor P-TEFb and the pausing complex NELF/DSIF to regulate transcription elongation of interferon-stimulated genes. Mol. Cell. Biol 33, 2497–2507. [DOI] [PMC free article] [PubMed] [Google Scholar]
- Qiu J, Zhou B, Thol F, Zhou Y, Chen L, Shao C, DeBoever C, Hou J, Li H, Chaturvedi A, et al. (2016). Distinct splicing signatures affect converged pathways in myelodysplastic syndrome patients carrying mutations in different splicing regulators. RNA 22, 1535–1549. [DOI] [PMC free article] [PubMed] [Google Scholar]
- Rahman S, Sowa ME, Ottinger M, Smith JA, Shi Y, Harper JW, and Howley PM (2011). The Brd4 extraterminal domain confers transcription activation independent of pTEFb by recruiting multiple proteins, including NSD3. Mol. Cell. Biol 31, 2641–2652. [DOI] [PMC free article] [PubMed] [Google Scholar]
- Roe JS, and Vakoc CR (2016). The Essential Transcriptional Function of BRD4 in Acute Myeloid Leukemia. Cold Spring Harb. Symp. Quant. Biol 81, 61–66. [DOI] [PMC free article] [PubMed] [Google Scholar]
- Schneider CA, Rasband WS, and Eliceiri KW (2012). NIH Image to ImageJ: 25 years of image analysis. Nat. Methods 9, 671–675. [DOI] [PMC free article] [PubMed] [Google Scholar]
- Schmidt SF, Larsen BD, Loft A, Nielsen R, Madsen JG, and Mandrup S (2015). Acute TNF-induced repression of cell identity genes is mediated by NFkB-directed redistribution of cofactors from super-enhancers. Genome Res. 25, 1281–1294. [DOI] [PMC free article] [PubMed] [Google Scholar]
- Schwartz JC, Ebmeier CC, Podell ER, Heimiller J, Taatjes DJ, and Cech TR (2012). FUS binds the CTD of RNA polymerase II and regulates its phosphorylation at Ser2. Genes Dev. 26, 2690–2695. [DOI] [PMC free article] [PubMed] [Google Scholar]
- Shen S, Park JW, Lu ZX, Lin L, Henry MD, Wu YN, Zhou Q, and Xing Y (2014). rMATS: robust and flexible detection of differential alternative splicing from replicate RNA-Seq data. Proc. Natl. Acad. Sci. USA 111, E5593–E5601. [DOI] [PMC free article] [PubMed] [Google Scholar]
- Simovski B, Kanduri C, Gundersen S, Titov D, Domanska D, Bock C, Bossini-Castillo L, Chikina M, Favorov A, Layer RM, et al. (2018). Coloc-stats: a unified web interface to perform colocalization analysis of genomic features. Nucleic Acids Res. 46 (W1), W186–W193. [DOI] [PMC free article] [PubMed] [Google Scholar]
- Wang BD, Ceniccola K, Hwang S, Andrawis R, Horvath A, Freedman JA, Olender J, Knapp S, Ching T, Garmire L, et al. (2017). Alternative splicing promotes tumour aggressiveness and drug resistance in African American prostate cancer. Nat. Commun 8, 15921. [DOI] [PMC free article] [PubMed] [Google Scholar]
- Will CL, and Lührmann R (2011). Spliceosome structure and function. Cold Spring Harb. Perspect. Biol 3, a003707. [DOI] [PMC free article] [PubMed] [Google Scholar]
- Winter GE, Mayer A, Buckley DL, Erb MA, Roderick JE, Vittori S, Reyes JM, di Iulio J, Souza A, Ott CJ, et al. (2017). BET Bromodomain Proteins Function as Master Transcription Elongation Factors Independent of CDK9 Recruitment. Mol. Cell 67, 5–18.e19. [DOI] [PMC free article] [PubMed] [Google Scholar]
- Xu Y, Gao XD, Lee JH, Huang H, Tan H, Ahn J, Reinke LM, Peter ME, Feng Y, Gius D, et al. (2014). Cell type-restricted activity of hnRNPM promotes breast cancer metastasis via regulating alternative splicing. Genes Dev. 28, 1191–1203. [DOI] [PMC free article] [PubMed] [Google Scholar]
- Zhang J, and Manley JL (2013). Misregulation of pre-mRNA alternative splicing in cancer. Cancer Discov. 3, 1228–1237. [DOI] [PMC free article] [PubMed] [Google Scholar]
- Zhang Y, Liu T, Meyer CA, Eeckhoute J, Johnson DS, Bernstein BE, Nusbaum C, Myers RM, Brown M, Li W, and Liu XS (2008). Modelbased analysis of ChIP-Seq (MACS). Genome Biol. 9, R137. [DOI] [PMC free article] [PubMed] [Google Scholar]
- Zuber J, Shi J, Wang E, Rappaport AR, Herrmann H, Sison EA, Magoon D, Qi J, Blatt K, Wunderlich M, et al. (2011). RNAi screen identifies Brd4 as a therapeutic target in acute myeloid leukaemia. Nature 478, 524–528. [DOI] [PMC free article] [PubMed] [Google Scholar]
Associated Data
This section collects any data citations, data availability statements, or supplementary materials included in this article.
Supplementary Materials
Data Availability Statement
This study did not generate any new datasets.