Abstract
Background and aims
The regular overnight migrating motor complex (MMC) ensures that the normal fasting small-bowel water content (SBWC) is minimised. We have applied our recently validated non-invasive magnetic resonance technique to assess SBWC in newly diagnosed coeliac disease (CD), scleroderma (SCD) and irritable bowel syndrome (IBS), conditions possibly associated with small intestinal bacterial overgrowth (SIBO).
Methods
A total of 20 CD and 15 SCD patients with gastrointestinal symptoms were compared to 20 healthy volunteers (HV) and 26 IBS with diarrhoea (IBS-D) patients, as previously reported. All underwent a fasting magnetic resonance imaging (MRI) scan on a 1.5 T Philips Achieva MRI scanner to assess fasting SBWC and colonic volumes. Stool and symptom diaries were completed for one week.
Results
Compared to HV, all patients had significantly increased stool frequency and Bristol stool form score. SBWC was significantly increased in CD (median 109 mL; interquartile range (IQR) 53–224 mL) compared to HV (median 53 mL; IQR 31–98 mL; p < 0.01) and IBS-D (median 42 mL; IQR 28–67 mL; p < 0.01). A variable increase in SBWC was also found in SCD (median 77 mL; IQR 39–158 mL), but this was not significant (p = 0.2). Colonic volumes were similar for all groups, being a median of 547 mL (IQR 442–786 mL) for CD, 511 mL (453–789 mL) for SCD, 612 mL (445–746 mL) for HV and 521 mL (428–757 mL) for IBS-D. When CD patients were subdivided according to the Marsh classification, the higher grades had larger colonic volumes.
Conclusion
Fasting SBWC as assessed by MRI is significantly increased in newly diagnosed CD and SCD but decreased in IBS-D. Future studies should test whether increased resting fluid predisposes to SIBO.
Keywords: Small bowel, magnetic resonance imaging, irritable bowel syndrome, coeliac disease, scleroderma
Introduction
The normal fasting small bowel contains little resting secretions, since the inter-digestive migrating motor complex (MMC), which passes down the bowel every one to two hours, clears these into the colon.1 This is important, as it prevents excessive bacterial proliferation which would otherwise damage the small intestinal mucosa, leading in severe cases to malabsorption. Diseases such as scleroderma (SCD) which impair the MMC2 can be complicated by small intestinal bacterial overgrowth (SIBO) which can be prevented by stimulating the MMC with octreotide.3 Assessment of the motor patterns which lead to increased resting secretions and hence provide fertile conditions for bacterial growth has until recently required intestinal intubation, and so published data are scant. Early radiological studies in coeliac disease (CD) noted the increase in resting fluids which caused a characteristic dilution and flocculation of barium solutions, but they were not able to quantify this.4 We have validated a novel magnetic resonance imaging (MRI) technique for assessing small-bowel water content (SBWC).5 We have also shown that ondansetron, a 5HT-3 receptor antagonist shown to be effective in irritable bowel syndrome (IBS) with diarrhoea (IBS-D), normalised fasting SBWC while reducing antroduodenal motility,6 supporting the idea that reduced fasting SBWC could be an indicator of excessive small-bowel motility. We planned to exploit this new, non-invasive, highly patient-acceptable technique to assess small- and large-bowel water in conditions known to be associated with SIBO such as SCD7 and CD8 and to compare this to our data on IBS-D where there has been much interest in the possibility of SIBO as a cause of symptoms.
We hypothesised that resting SBWC would be increased in CD and SCD patients. The logic was that increased SBWC in untreated CD patients would reflect both the net effect of impaired absorption associated with villous atrophy and increased secretion associated with crypt hyperplasia and also the impaired motility reported in untreated CD,9,10 while increased SBWC in SCD would reflect the associated impaired motility and reduced absorption. We planned to compare these to a group of previously studied IBS-D patients who acted as a control for the effect of diarrhoea.
Materials and methods
Subjects
Twenty patients who were newly diagnosed with CD and on a gluten diet were recruited from gastroenterology clinics in secondary care (Nottingham University Hospital Trusts, Nottingham, UK, and Royal Hallamshire Hospital and University of Sheffield, Sheffield, UK). Diagnosis of CD was confirmed by duodenal (D2) biopsy. Fifteen patients with SCD who had gastrointestinal symptoms such as oesophageal reflux, abdominal pain, diarrhoea and constipation were recruited from a secondary care hospital (Nottingham Treatment Centre and Nottingham University Hospitals Trusts, Nottingham, UK). The results from these two groups were compared to previous groups of 20 healthy volunteers (HV) and 26 untreated IBS-D patients who underwent similar MRI fasting scans using the same criteria and restrictions as previously reported.11 The IBS-D patients satisfied the Rome III criteria for IBS-D12 and had been evaluated to exclude other causes of diarrhoeal disorders, including CD, microscopic colitis and bile salt diarrhoea.
This study was approved by the local ethics committees (06/Q2404/74, 10/H0906/50, L/07/2011). All subjects had given written consent, and the study was carried out according to the Good Clinical Practice Principles and Declaration of Helsinki. All subjects were asked to abstain from alcohol, caffeine and strenuous exercise from the night before. If they were on any medication that might have affected gastrointestinal motility, this was stopped a week before the study day. Subjects were asked to fast overnight before the study day. All subjects had completed a MRI safety questionnaire to ensure safety and exclude any MRI incompatible metal implants. All subjects were asked to fill in a seven-day stool diary based on the Bristol stool form scale, Hospital Anxiety and Depression Questionnaire and the Patient Health Questionnaire 15 (PHQ-15).
MRI scanning protocol
All subjects were scanned in the 1.5 T Philips Achieva MRI scanner (Philips, Best, The Netherlands) in the morning. Subjects were in a supine position with a SENSE-4 element body coil wrapped around the abdomen during the scanning phase. Subjects were in the scanner for approximately 15 minutes. Three different imaging sequences were used for this study. First, a coronal dual echo fast field echo (FFE) sequence was used to visualise the abdominal anatomy. This acquisition has 24 coronal planes and 45 continuous transverse images with a resolution of 1.76 mm × 1.76 mm and a slice thickness of 7 mm. Second, small-bowel water was assessed using similar protocol to our previous studies.5,6,11 This is a single breath-hold scan using a single-shot, fast spin echo sequence which gives a high intensity signals from areas with free fluid and little signal from other body tissues. The third imaging sequence was to assess colonic volumes. This method was recently described, and it involves a coronal dual echo FFE sequence with 24 continuous slices with an in-plane resolution of 1.76 mm × 1.76 mm and 7 mm slice thickness.13 All these sequences were done in an expiration breath holds of between 15 and 24 seconds.
Data analysis and statistics
Data were compared to a cohort of 20 HV who previously had a baseline fasting MRI scan as part of other research studies. These subjects were age and sex matched to the cohort of CD patients.
SBWC measurement was analysed with in-house software which was previously described and validated5 against naso-duodenal infusion of mannitol/ saline into the small bowel. The colonic volumes were manually segmented from the coronal images using Analyze9™ software (Mayo Foundation, Rochester, MN). The total colonic volume is the total sum of the segmented colon measured from each of the image slices.13 The SBWC and colonic volumes are expressed in millilitres.
Power and statistical analysis
Power calculation was not performed, as these MRI assessments have never been performed before in such subjects.
Statistical analysis was carried out using GraphPad Prism for Windows v6 (GraphPad Software, La Jolla, CA). Normality of the data was tested by using the D'Agostino and Pearson omnibus normality test. Comparisons between two groups were performed using a two-tailed unpaired t-test for variables with a normal distribution or Mann–Whitney's test for those with a non-normal distribution. For multiple comparisons, one-way analysis of variance was used for normally distributed variables and the Kruskal–Wallis test for non-normally distributed variables. The data are expressed as the mean (±standard deviation (SD)) when normally distributed and as the median (interquartile range (IQR)) when non-normally distributed. Results of comparison test are significant if p ≤ 0.05. Post hoc assessments were performed by using Bonferroni's multiple comparison test for normally distributed variables and Dunn's multiple comparison test for non-normally distributed variables. In the post hoc assessments, results were considered significant if p ≤ 0.03, thus accounting for the effect of multiple comparisons.
Results
General demographics
All subjects tolerated the MRI scanning protocol well. There were no adverse events during this study period. Twenty CD patients (12 female; age 45.6 ± 14.1 years) and 15 SCD (13 female; age 62.9 ± 12.9 years) were recruited and compared to 26 previously scanned IBS-D patients (17 female; age 48.5 ± 11.0 years) and 20 previously scanned HV (12 female; age 42.9 ± 15.3 years). Of the 20 CD patients, five had iron deficiency anaemia. Low folate and low B12 levels were each noted in one patient, but none had hypocalcaemia or hypoalbuminaemia. This group was further subtyped according to the D2 biopsy results based on the modified Marsh–Oberhuber grading system for CD.14 Eight CD patients had Marsh 3c, eight CD patients had Marsh 3b, two CD patients had Marsh 3a and two CD patients had Marsh 1.
Bowel patterns
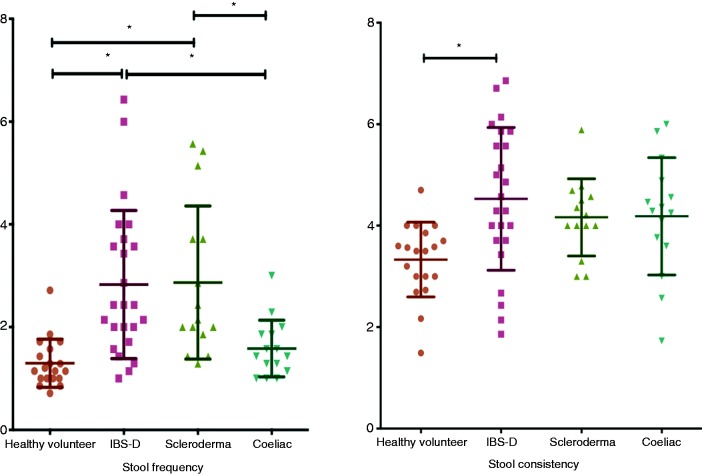
As Figure 1 and Table 1 show, there was a significantly increased daily stool frequency in all three patient groups compared to HV. The average Bristol stool form score was also increased in all three patient groups, but this only reached statistical significance for IBS-D.
Figure 1.
Average stool frequency and consistency per day.
Table 1.
Baseline demographics and stool pattern.
| HV | IBS-D | SCD | CD | p (one-way ANOVA) | |
|---|---|---|---|---|---|
| N | 20 | 26 | 15 | 20 | |
| Female : male | 12 : 8 | 17 : 9 | 13 : 2 | 12 : 8 | |
| Age, years | 42.9 ± 15.3 | 48.5 ± 11.0** | 62.9 ± 12.9*,*** | 45.6 ± 14.1 | <0.01 |
| PHQ-15, median (IQR) | 1.0 (0–3.0) | 11.0 (7.0–13.5)* | 10.0 (8.0–11.0)* | 10.0 (4.5–14.0)* | <0.01 |
| Anxiety | 4.5 ± 2.7 | 7.7 ± 4.1 | 6.5 ± 3.7 | 8.3 ± 3.7* | 0.02 |
| Depression | 1.4 ± 1.2 | 4.8 ± 3.3* | 4.2 ± 3.4* | 4.85 ± 2.9* | <0.01 |
| Stools/day, median (IQR) | 1.1 (1–1.6) | 2.4 (1.8–3.7)*,*** | 2.1 (1.9–3.7)* | 1.4 (1.1–1.9)** | <0.01 (Kruskal–Wallis) |
| Average stool consistency/day | 3.33 ± 0.7 | 4.5 ± 1.4* | 4.2 ± 0.8 | 4.2 ± 1.2 | <0.01 |
Data shown are the mean (standard deviation) unless otherwise stated.
Adjusted p < 0.03 versus HV following multiple comparison.
Adjusted p < 0.03 versus SCD following multiple comparison.
Adjusted p < 0.03 versus CD following multiple comparison.
HV: healthy volunteers; IBS-D: irritable bowel syndrome with diarrhoea; SCD; scleroderma; CD: coeliac disease; ANOVA: analysis of variance; PHQ-15: Patient Health Questionnaire 15; IQR: interquartile range.
Psychological assessments
Both CD and SCD showed similar PHQ-15 scores to IBS-D patients, and these were significantly higher than the HV. Similarly, patients' anxiety and depression scores were higher than the HV (see Table 1).
SBWC
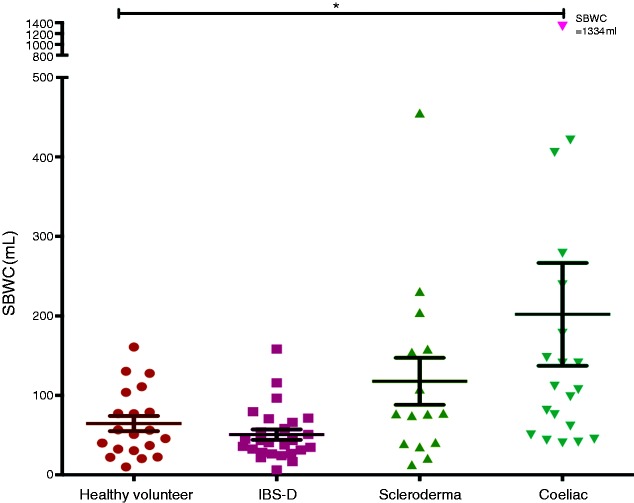
The MRI scans of the fasting small bowel showed significantly increased SBWC in the CD group compared to the HV and IBS-D groups, being a median of 109 mL (IQR 53–224 mL) versus a median of 53 mL (IQR 31–98 mL) and a median 42 mL (IQR 28–67 mL), respectively (p < 0.01). There was no significant difference in fasting SBWC between the CD and SCD groups (median 109 mL (IQR 53–224 mL) and median 77 mL (IQR 39–158), respectively; adjusted p > 0.9). There was an increase in fasting SBWC in SCD compared to IBS-D (adjusted p = 0.13) but not HV (adjusted p > 0.9; Figure 2). In the CD group, there was no difference in the fasting SBWC when comparing within the group who had anaemia (n = 5) versus normal haemoglobin level (n = 15). The values were a median of 178 mL (IQR 63–870 mL) and a median of 107 mL (IQR 50–148 mL), respectively (p = 0.31).
Figure 2.
Fasting small-bowel water content between healthy volunteers (HV), irritable bowel syndrome with diarrhoea (IBS-D), scleroderma (SCD) and coeliac disease (CD).
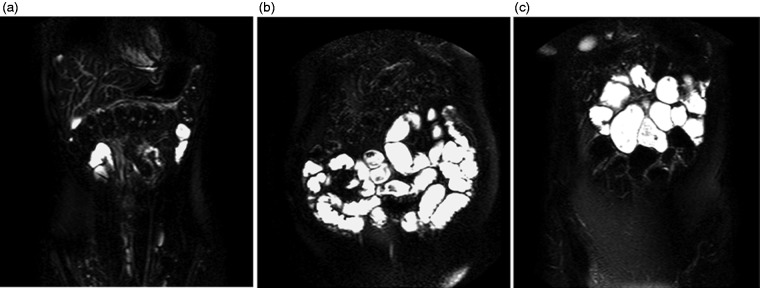
Figure 3 shows some example coronal images of the abdomen from (a) a HV, (b) a patient with CD and (c) a patient with SCD. The bright signal represents free water. Figure 3(b) shows a CD patient with an extremely large volume of water in the small bowel compared to a HV. MRI analysis of the SBWC showed 1334 mL of free fluid in the small bowel. Figure 3(c) shows a dilated small bowel and free water in the small bowel of a SCD patient. Most of the water appears to be in the proximal small bowel.
Figure 3.
Coronal images of the abdomen showing bright signals which represent free water in the small bowel of (a) a HV, (b) a CD patient and (C) a SCD patient.
Total colonic volume
Overall, there were no significant differences between CD (median 547 mL (IQR 442–786 mL)) versus HV (median 612 mL (IQR 445–746 mL); p = 0.89), IBS-D (median 521 mL (IQR 428–757 mL)) versus HV (p = 0.67) and SCD (median 511 mL (IQR 453–789 mL)) versus HV (p = 0.65; Figure 4).
Figure 4.
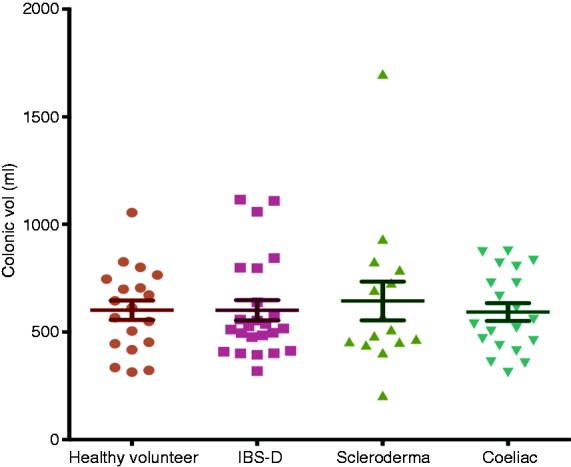
Total colonic volume between each patient group versus HV.
However, in the CD group, patients were further subtyped according to the severity of the D2 biopsy based on the modified Marsh grading (Figure 5). There was a significant difference in the total colonic volumes as the severity of the Marsh 3 subtype grading increased. The total colonic volumes for the Marsh 3a, 3b and 3c subtypes were a median of 395 mL (IQR 355–436 mL), 519 mL (IQR 423–757 mL) and 696 mL (528–806mL), respectively (p = 0.05). The stool frequency in Marsh 3c at a median of 1.2 (IQR 1.0–1.3) was reduced compared to grade 3a and 3b, which were a median of 1.4 (IQR 1.0–3.0) and 1.9 (IQR 1.6–2.1), respectively (p = 0.02; see Figure 6).
Figure 5.
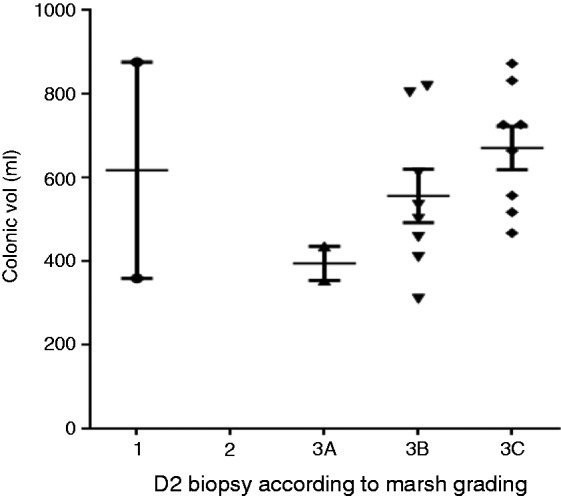
Total colonic volume versus severity of modified Marsh grading for D2 biopsy.
Figure 6.
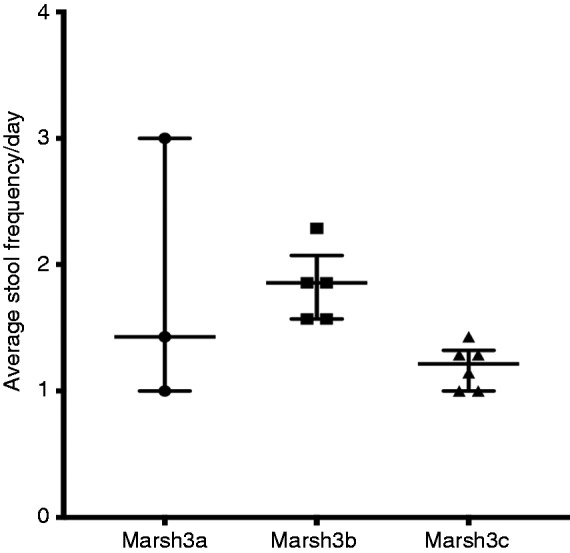
Average stool frequency per day versus modified Marsh 3 subtypes in D2 histology.
Correlation between MR parameters and bowel symptoms
There were no correlations between fasting SBWC and psychological distress symptoms such as anxiety or depression. There were no significant correlations between fasting SBWC and stool frequency and consistency (Table 2).
Table 2.
Correlation between fasting SBWC with psychological distress, stool frequency and consistency.
| Correlation between fasting SBWC | Spearman, r | p |
|---|---|---|
| Anxiety | 0.20 | 0.10 |
| Depression | 0.12 | 0.32 |
| Stool frequency | −0.07 | 0.57 |
| Stool consistency | −0.01 | 0.93 |
SBWC: small-bowel water content.
Discussion
This is the first attempt to relate fasting SBWC to clinical features and, as such, provides new insights into disease but also raises many new questions. We were not able to perform a power calculation prior to the start of the study, as MRI has never been performed in these groups of patients before. However, with our normal fasting SBWC of 53 (33) mL from a recently performed study in normal volunteers,15 we can calculate that using our technique in 25 HV we would be able to detect a 27 mL difference with an 80% power. Whether such an increase would be clinically significant remains to be determined. However, the striking variability in fasting small-bowel motor activity which occurs during the passage of the MMC suggests that any change would need to be substantial to be able to be detected by a single measurement which is not synchronised to the motor patterns. Plainly, the effects we observed in our patients were substantial, since the statistical test performed showed a p-value of < 0.01, which is very robust, and the difference seen would not be due to chance.
The increase in SBWC in untreated CD that we observed may represent the imbalance between absorption and secretion created by loss of the absorptive function of villi leaving the crypts, whose main function is secretion.16 It could also be secondary to the excess serotonin, characteristic of CD,17–19 which has a stimulatory effect on submucosa enteric nerves which drive secretion.20–22 Equally, given the documented disturbance in gastric emptying and postprandial motility in untreated CD,23 it may represent impairment of the MMC, something that could be easily tested. This increased fasting secretion would predispose to SIBO which is detected in a proportion of untreated CD patients, particularly those with more severe disease.8
Overall, we found that the changes in small-bowel water in CD were not accompanied by marked changes in colonic volumes. Our previous work showed that colonic volumes are rather constant,13 possibly because subjects control this by timing defecation to avoid the unpleasant sensation caused by over-distension. However, in our study, it is interesting to find that the more severely damaged small-bowel mucosa, as assessed by the modified Marsh grade, was associated with larger colonic volumes. One possible explanation is that the elevated peptide YY24,25 and glucagon-like peptide 126 described in untreated CD may inhibit intestinal motility, leading to an enlargement of both the small bowel and the colon. This was only observed in a small number of patients, but it could be tested by repeating our study with a larger cohort of CD patients before and after a gluten-free diet, along with measuring postprandial blood levels of these peptides.
SCD deranges small-bowel function by the loss of smooth muscle and fibrosis27 which results in impaired peristalsis in both the oesophagus and small intestine. Delayed orocaecal transit is common, and two-thirds of patients demonstrate SIBO.7 The increased fasting contents we have demonstrated are likely due to a combination of reduced small-bowel tone and impaired or reduced MMC activity which normally ‘sweeps’ the intestine clear. The slowly moving intestinal contents in these patients would provide ideal conditions for bacteria to proliferate. These increases in SBWC contrast with the decrease seen in IBS-D, where motility is enhanced,28,29 and as we showed, SBWC reduced, possibly driven by anxiety or stress.11,30,31
One limitation of our studies is that we did not prepare our subjects in any way or attempt to synchronise our scan time to the periodicity of the MMC. We would expect the SBWC to vary in relation to the occurrence of the MMC, being much less just after an MMC had passed distally. This may account for the variability in fasting SBWC seen in all groups. Unfortunately, recording small-bowel motility to ensure scanning occurred at the same time in the fasting cycle would involve intubation, which we know reduces fasting SBWC,6 possibly because it stimulates propulsive motility.32 MRI assessment of motility is coming of age, and it may be possible in the future to record both motility and SBWC.
Our findings throw light on the possible causes of SIBO in CD and SCD. These ideas should now be tested in a larger study in which the association of SBWC and SIBO is assessed in a group of untreated CD patients before and after institution of a gluten-free diet. It may also be worthwhile looking at whether prokinetics can reduce fasting SBWC in SCD and whether this will reduce the incidence of SIBO in this patient group.
Acknowledgements
We are grateful for the support from the NIHR Nottingham Digestive Diseases Biomedical Research Centre. The views expressed are those of the authors and not necessarily those of the NHS, the NIHR or the Department of Health.
Declaration of conflicting interests
None declared.
Ethics approval
This study was approved by the Nottingham Research Ethics Committee 2 review board (06/Q2404/74, 10/H0906/50, L/07/2011) on the 21/9/2006.
Funding
This research received no specific grant from any funding agency in the public, commercial or not-for-profit sectors.
Informed consent
Written informed consent was obtained from each participant included in the study. The study was carried out according to the Good Clinical Practice Principles and Declaration of Helsinki.
References
- 1.Deloose E, Janssen P, Depoortere I, et al. The migrating motor complex: control mechanisms and its role in health and disease. Nat Rev Gastroenterol Hepatol 2012; 9: 271–285. [DOI] [PubMed] [Google Scholar]
- 2.Vantrappen G, Janssens J, Hellemans J, et al. The interdigestive motor complex of normal subjects and patients with bacterial overgrowth of the small intestine. J Clin Invest 1977; 59: 1158–1166. [DOI] [PMC free article] [PubMed] [Google Scholar]
- 3.Soudah HC, Hasler WL, Owyang C. Effect of octreotide on intestinal motility and bacterial overgrowth in scleroderma. N Engl J Med 1991; 325: 1461–1467. [DOI] [PubMed] [Google Scholar]
- 4.Bjerkelund CJ, Husebye OW. The clinical and roentgenological findings in steatorrhea of varying etiology. Am J Dig Dis 1950; 17: 139–149. [DOI] [PubMed] [Google Scholar]
- 5.Hoad CL, Marciani L, Foley S, et al. Non-invasive quantification of small bowel water content by MRI: a validation study. Phys Med Biol 2007; 52: 6909–6922. [DOI] [PubMed] [Google Scholar]
- 6.Marciani L, Wright J, Foley S, et al. Effects of a 5-HT(3) antagonist, ondansetron, on fasting and postprandial small bowel water content assessed by magnetic resonance imaging. Aliment Pharmacol Ther 2010; 32: 655–663. [DOI] [PubMed] [Google Scholar]
- 7.Parodi A, Sessarego M, Greco A, et al. Small intestinal bacterial overgrowth in patients suffering from scleroderma: clinical effectiveness of its eradication. Am J Gastroenterol 2008; 103: 1257–1262. [DOI] [PubMed] [Google Scholar]
- 8.Rubio-Tapia A, Barton SH, Rosenblatt JE, et al. Prevalence of small intestine bacterial overgrowth diagnosed by quantitative culture of intestinal aspirate in celiac disease. J Clin Gastroenterol 2009; 43: 157–161. [DOI] [PMC free article] [PubMed] [Google Scholar]
- 9.Bai JC, Mauriño E, Martínez C, et al. Abnormal colonic transit time in untreated celiac sprue. Acta Gastroenterol Latinoam 1995; 25: 277–284. [PubMed] [Google Scholar]
- 10.Spiller RC, Lee YC, Edge C, et al. Delayed mouth-caecum transit of a lactulose labelled liquid test meal in patients with steatorrhoea caused by partially treated coeliac disease. Gut 1987; 28: 1275–1282. [DOI] [PMC free article] [PubMed] [Google Scholar]
- 11.Marciani L, Cox EF, Hoad CL, et al. Postprandial changes in small bowel water content in healthy subjects and patients with irritable bowel syndrome. Gastroenterology 2010; 138: 469–477.e1. [DOI] [PubMed] [Google Scholar]
- 12.Longstreth GF, Thompson WG, Chey WD, et al. Functional bowel disorders. Gastroenterology 2006; 130: 1480–1491. [DOI] [PubMed] [Google Scholar]
- 13.Pritchard SE, Marciani L, Garsed KC, et al. Fasting and postprandial volumes of the undisturbed colon: normal values and changes in diarrhea-predominant irritable bowel syndrome measured using serial MRI. Neurogastroenterol Motil 2014; 26: 124–130. [DOI] [PMC free article] [PubMed] [Google Scholar]
- 14.Dickson BC, Streutker CJ, Chetty R. Coeliac disease: an update for pathologists. J Clin Pathol 2006; 59: 1008–1016. [DOI] [PMC free article] [PubMed] [Google Scholar]
- 15.Wilkinson-Smith VC, et al. Insights into the different effects of food on intestinal secretion using magnetic resonance imaging. JPEN J Parenter Enteral Nutr 2018; 42: 1342–1348. [DOI] [PubMed] [Google Scholar]
- 16.Mellander A, Abrahamsson H, Sjovall H. Duodenal secretomotor function in untreated coeliac disease. Scand J Gastroenterol 1995; 30: 337–343. [DOI] [PubMed] [Google Scholar]
- 17.Sjolund K, Nobin A. Increased levels of plasma 5-hydroxytryptamine in patients with coeliac disease. Scand J Gastroenterol 1985; 20: 304–308. [DOI] [PubMed] [Google Scholar]
- 18.Wheeler EE, Challacombe DN. Quantification of enterochromaffin cells with serotonin immunoreactivity in the duodenal mucosa in coeliac disease. Arch Dis Child 1984; 59: 523–527. [DOI] [PMC free article] [PubMed] [Google Scholar]
- 19.Coleman NS, Foley S, Dunlop SP, et al. Abnormalities of serotonin metabolism and their relation to symptoms in untreated celiac disease. Clin Gastroenterol Hepatol 2006; 4: 874–881. [DOI] [PubMed] [Google Scholar]
- 20.Kellum JM, Budhoo MR, Siriwardena AK, et al. Serotonin induces Cl– secretion in human jejunal mucosa in vitro via a nonneural pathway at a 5-HT4 receptor. Am J Physiol 1994; 267: G357–G363. [DOI] [PubMed] [Google Scholar]
- 21.Munck LK, Eskerod O, Hansen MB, et al. Failure of tropisetron to inhibit jejunal water and electrolyte secretion induced by 5-hydroxytryptamine in healthy volunteers. Gut 1994; 35: 637–640. [DOI] [PMC free article] [PubMed] [Google Scholar]
- 22.Cooke HJ, Sidhu M, Wang YZ. 5-HT activates neural reflexes regulating secretion in the guinea-pig colon. Neurogastroenterol Motil 1997; 9: 181–186. [DOI] [PubMed] [Google Scholar]
- 23.Usai P, Usai Satta P, Lai M, et al. Autonomic dysfunction and upper digestive functional disorders in untreated adult coeliac disease. Eur J Clin Invest 1997; 27: 1009–1015. [DOI] [PubMed] [Google Scholar]
- 24.Sjolund K, Ekman R. Increased plasma levels of peptide YY in coeliac disease. Scand J Gastroenterol 1988; 23: 297–300. [DOI] [PubMed] [Google Scholar]
- 25.Wahab PJ, Hopman WP, Jansen JB. Basal and fat-stimulated plasma peptide YY levels in celiac disease. Dig Dis Sci 2001; 46: 2504–2509. [DOI] [PubMed] [Google Scholar]
- 26.Caddy GR, Ardill JE, Filmore D, et al. Plasma concentrations of glucagon-like peptide-2 in adult patients with treated and untreated coeliac disease. Eur J Gastroenterol Hepatol 2006; 18: 195–202. [DOI] [PubMed] [Google Scholar]
- 27.Young MA, Rose S, Reynolds JC. Gastrointestinal manifestations of scleroderma. Rheum Dis Clin North Am 1996; 22: 797–823. [DOI] [PubMed] [Google Scholar]
- 28.Gorard DA, Libby GW, Farthing MJ. Ambulatory small intestinal motility in “diarrhoea” predominant irritable bowel syndrome. Gut 1994; 35: 203–210. [DOI] [PMC free article] [PubMed] [Google Scholar]
- 29.Small PK, Loudon MA, Hau CM, et al. Large-scale ambulatory study of postprandial jejunal motility in irritable bowel syndrome. Scand J Gastroenterol 1997; 32: 39–47. [DOI] [PubMed] [Google Scholar]
- 30.Ditto B, Miller SB, Barr RG. A one-hour active coping stressor reduces small bowel transit time in healthy young adults. Psychosom Med 1998; 60: 7–10. [DOI] [PubMed] [Google Scholar]
- 31.Cann PA, Read NW, Cammack J, et al. Psychological stress and the passage of a standard meal through the stomach and small intestine in man. Gut 1983; 24: 236–240. [DOI] [PMC free article] [PubMed] [Google Scholar]
- 32.Read NW, Al Janabi NM, Bates TE, et al. Effect of gastrointestinal intubation on the passage of a solid meal through the stomach and small intestine in humans. Gastroenterology 1983; 84: 1568–1572. [PubMed] [Google Scholar]


