Abstract
Cell membrane potential and inorganic ion distributions are currently viewed from a kinetic electric paradigm, which ignores thermodynamics. The resting membrane potential is viewed as a diffusion potential. The 9 major inorganic ions found in blood plasma (Ca2+, Na+, Mg2+, K+, H+, Cl−, HCO3−, H2PO4−, and HPO42−) are distributed unequally across the plasma membrane. This unequal distribution requires the energy of ATP hydrolysis through the action of the Na+-K+ ATPase. The cell resting membrane potential in each of 3 different tissues with widely different resting membrane potentials has been shown to be equal to the Nernst equilibrium potential of the most permeant inorganic ion. The energy of the measured distribution of the 9 major inorganic ions between extra- and intracellular phases was essentially equal to the independently measured energy of ATP hydrolysis, showing that the distribution of these 9 major ions was in near-equilibrium with the ΔG′ of ATP. Therefore, thermodynamics does appear to play an essential role in the determination of the cell resting membrane potential and the inorganic ion distribution across the plasma membrane.—Veech, R. L., King, M. T., Pawlosky, R., Bradshaw, P. C., Curtis, W. Relationship between inorganic ion distribution, resting membrane potential, and the ΔG′ of ATP hydrolysis: a new paradigm.
Keywords: Gibbs-Donnan equilibrium, sodium-potassium ATPase, free energy, thermodynamics of ion transport, intravenous fluid therapies
BACKGROUND
Recently a review article was published entitled “The enduring legacy of the ‘constant field equation’ in membrane ion transport” (1). In the article, the authors state that “Thermodynamic equations are not applicable, because ion transport in cells is out of equilibrium.” We fundamentally disagree with this statement. Over the past 35 yr, a basic understanding of thermodynamics applied to membrane ion distribution and resting membrane potential has been reported (2–5). We summarize these contributions here and address several outstanding questions in this field using the understanding gained from these findings.
THE DISTRIBUTION OF IONS RELATED TO THE ACTIVITY OF THE SODIUM-POTASSIUM ATPASE AND TO THE INDEPENDENTLY MEASURED ΔG′ OF ATP
The Na+-K+ ATPase pump creates a Gibbs-Donnan equilibrium in which Na+ is the external functionally impermeant cation. The charge on this external Na+ is opposite in sign and nearly equal in magnitude to that of the internal impermeant anionic Gibbs-Donnan polyanionic material. This Gibbs-Donnan system balances the colloid-osmotic pressure established by the presence of these intracellular macromolecules to maintain cell volume. The gradients of the other 8 major inorganic ions are linked to the sodium gradient by a series of transporters. The cytoplasmic ΔG′ of ATP can be calculated from the measurement of cellular metabolite concentrations (6). For example, substrate and product levels of the glyceralydehyde-3-phosphate dehydrogenase–3-phosphoglycerate kinase reactions can be used as previously described (6) and recently reviewed (4).
THE ENERGY OF THE ION GRADIENTS OF THE 9 MAJOR INORGANIC IONS BETWEEN THE EXTRA- AND INTRACELLULAR PHASES OF THE CELL IS EQUAL TO THE FREE ENERGY OF ATP HYDROLYSIS
Although it has been long known that the development of an extracellular Na+ gradient requires the energy of ATP hydrolysis (7), it took several more decades for the magnitude of the energy of ATP hydrolysis in vivo to be determined (6). The ATP couple, [ATP]/([ADP]×[Pi]), participates in hundreds of reactions, allowing the ΔG′ of ATP to control a wide range of the reactions of cellular metabolism (8).
The distribution of intra- and extracellular H2O was estimated using the 3H2O and 14C inulin spaces in 3 cell types with resting membrane potentials (measured by a KCl electrode) of −83 mV for heart (9), −28 mV for liver (10), and −7 mV for red blood cells. Na+, K+ Mg2+, and Ca2+ were measured by atomic absorption spectroscopy, Cl− by chloridometry, and HCO3−, HPO42−, and H2PO4− were measured enzymatically. The pH was calculated from measured HCO3− and CO2 using the Henderson-Hasselbalch equation (11). Free [Mg2+] was calculated from the measured citrate:isocitrate ratio (12). Three tissues that have the widest range of resting membrane potential were chosen.
EN [ION]O/I IS CALCULATED FROM THE MEASURED ION CONCENTRATION AND THE NERNST EQUATION. THE EN, RESTING MEMBRANE POTENTIAL IS MEASURED BY KCL ELECTRODE
One can compare the contribution of voltage of the individual ions in the 3 tissues. This is achieved by plotting the voltages for the individual ion distributions against the resting membrane potentials. The Nernst potential, EN, of each of the 9 major inorganic ions between extra and intracellular phases was calculated using the Nernst equation:
 |
where R is the gas law constant 8.3145 × 10⁻³ kJ/mole; F is the Faraday constant 96.485 kJ/V/mol, T is absolute temperature or 311.15 in degrees Kelvin, o is out, and i is in.
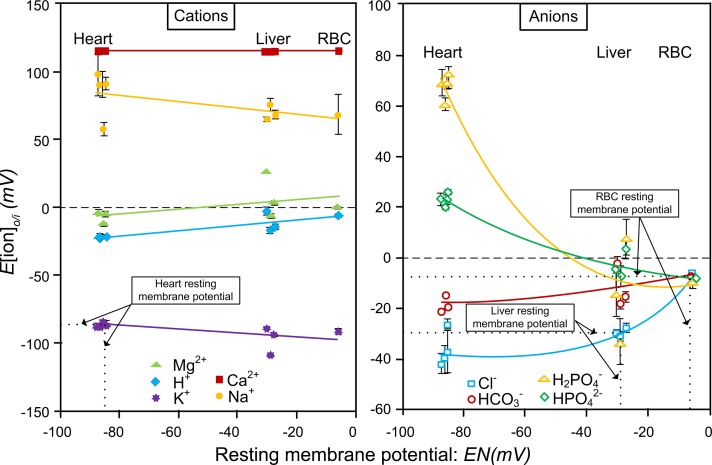
The Nernst potential for any ion in 2 phases is given in Eq. 1. The plots of voltage for each individual ion in heart, liver, and red blood cells are shown in Fig. 1. The 3 tissues are shown above their resting membrane potentials.
Figure 1.
The calculated Nernst potentials of the individual inorganic ions in tissues is plotted vs. the resting membrane potentials, EN. The x axis is the resting membrane potential of each of the 3 tissue types. The intersection of the measured resting membrane potential on the x axis for the 3 tissues, heart, liver, and red blood cell with the resting potential calculated on the y axis is shown by dotted lines for each of the 3 tissues. This intersection identifies the ions reflecting the resting membrane potential. For the heart, K+ reflects the resting potential at −83 mV; for the liver, Cl− reflects the resting membrane potential at −28 mV, and for the red blood cell Cl− and HCO3−, both reflect the resting membrane potential at −7 mV (11).
The resting membrane potential of cells from the 3 tissues was a Nernst equilibrium potential (13) of the most permeant ion (Fig. 1), which is not a diffusion potential. The most permeant ion is determined by the ion with the ΔG′[ion]o/i that approaches zero (Eq. 2).
 |
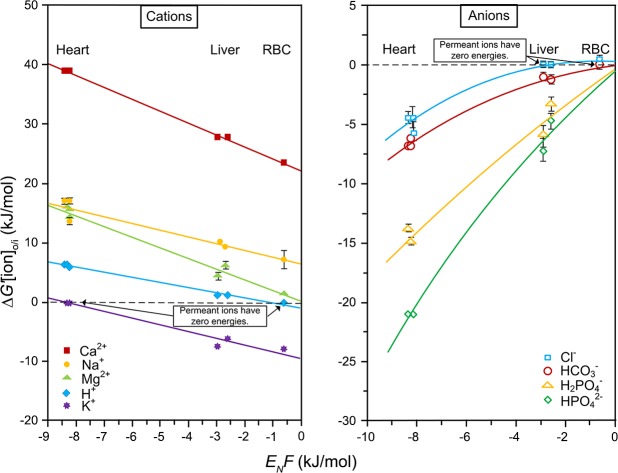
This can be seen in Fig. 2, which in the case of heart was K+, in liver was Cl−, and in the red blood cell was Cl− and HCO3−. The resting membrane potential is therefore not a diffusion potential as has been widely taught, demonstrating that thermodynamics do apply. The establishment and maintenance of the membrane potential and the distribution of the 9 major inorganic ions across the plasma membrane represent a Gibbs-Donnan equilibrium system that is based on thermodynamics.
Figure 2.
The energies of the 9 major inorganic ions between the intra- and extracellular phases. The ΔG′ [ion]o/i is shown for 3 cell types with greatly different resting membrane potentials. The resting membrane potential (EN) times the faraday constant F is plotted on the x axis. Equation 2) is plotted on the y axis. The ion that has an energy approaching zero is the most permeant ion. The resting membrane potential of the 3 tissues was a Nernst equilibrium potential (13) of the most permeant ion, which in the case of heart was K+, in liver was Cl−, and in red blood cells was Cl− and HCO3−.
For the energies one plots ΔG[ion]o/i against the resting membrane potential times the Faraday constant.
It was further shown that that ΔG′[cation]o/i formed linear relationships with the energy of the resting membrane potentials, EN × F, for the 3 cell types tested. In contrast, the energy of the anions (ΔG′[anion]o/i) formed curvilinear relationships with the resting membrane potential, reflecting the differing amounts of impermeant intracellular Donnan-active anionic macromolecules that are balanced by impermeant extracellular Na+ ions created by the Na+-K+ ATPase. The gradients of the other major inorganic ions were related to the gradient of the Na+ ion and linked to one another by ion transporters in the electroneutral and osmoneutral system. The 3 cell types tested each formed a Gibbs-Donnan near-equilibrium system wherein the resting membrane potential was equivalent to the Nernst equilibrium potential of the most permeant ion (Table 1).
TABLE 1.
Concentrations of EC and IC inorganic ions in heart, liver, and red blood cells
| Perfused beating heart |
Liver |
Red blood cell,
control |
||||
|---|---|---|---|---|---|---|
| Ion/location |
Glucose |
G + insulin |
G + ketones |
Control |
+ Na acetate |
|
| Ca2+ EC | 1.1 | 1.1 | 1.1 | 1.1 | 1.07 | 1.07 |
| Ca2+ IC | 0.0002 | 0.0002 | 0.0002 | 0.0002 | 0.0002 | 0.0002 |
| Na+ EC | 144 | 144 | 149 | 146 ± 1 | 170 ± 2 | 144 |
| Na+ IC | 6.5 ± 5.2 | 5.6 ± 1.8 | 5.1 ± 0.8 | 12.3 ± 1.2 | 10.7 ± 1.5 | 8.8 ± 6.3 |
| Mg2+ EC | 0.5 | 0.5 | 0.5 | 0.52 ± 0.0 | 0.51 ± 0.02 | 0.52 ± 0.02 |
| Mg2+ IC | 1.2 ± 0.03 | 0.72 ± 0.3 | 0.74 ± 0.1 | 0.43 ± 0.0 | 0.97 ± 0.01 | 0.5 |
| pH external | 7.42 | 7.39 | 7.4 | 7.37 ± 0.03 | 7.52 ± 0.0 | 7.40 |
| pH internal | 7.06 ± 0.01 | 7.05 ± 0.2 | 7.04 ± 0.03 | 7.12 ± 0.07 | 7.12 ± 0.1 | 7.29 ± 0.0 |
| K+ EC | 5.9 | 5.9 | 5.9 | 5.22 ± 0.1 | 3.9 ± 0.3 | 5.16 ± 0.3 |
| K+ IC | 142 ± 3 | 147 ± 5 | 141 ± 6 | 175 ± 1 | 229 ± 2 | 153 ± 5 |
| Cl− EC | 127 | 127 | 127 | 103 ± 1 | 95.4 ± 1 | 108 ± 1 |
| Cl− IC | 47.9 ± 3.6 | 29.4 ± 5.5 | 36.1 ± 11 | 36.7 ± 2.3 | 30.8 ± 2.2 | 83.4 ± 2.9 |
| HCO3− EC | 25 | 25 | 25 | 26.7 ± 0.5 | 36.5 ± 1.4 | 26.7 ± 0.5 |
| HCO3− IC | 14.3 ± 0.2 | 14.4 ± 0.5 | 12 ± 0.4 | 15.1 ± 1.1 | 19.0 ± 1.6 | 22 ± 0.7 |
| H2PO4− EC | 0.18 | 0.19 | 0.19 | 0.22 ± 0.01 | 0.11 ± 0.01 | 0.39 ± 0.01 |
| H2PO4− IC | 2.43 ± 0.2 | 1.8 ± 0.2 | 2.9 ± 0.2 | 0.356 ± 0.08 | 0.48 ± 0.01 | 0.27 ± 0.02 |
| HPO42− EC | 0.91 | 0.90 | 0.91 | 0.95 ± 0.03 | 0.67 ± 0.04 | 1.9 ± 0.1 |
| HPO42− IC | 5.4 ± 0.4 | 4.03 ± 0.3 | 6.26 ± 0.4 | 0.91 ± 0.2 | 1.55 ± 0.45 | 1.0 ± 0.1 |
The values are given as means ± SEM in units of micromoles per milliliter. H2O free intracellular [Ca2+] was assigned as 0.2 μM in all tissues (11). EC, extracellular; IC, intracellular.
IS THERE AN EQUATION THAT CAN RELATE THE GIBBS FREE ENERGY OF THE ACTIVE TRANSPORT DRIVEN BY ATP TO THE DISTRIBUTION OF ALL 9 MAJOR INORGANIC IONS IN EQUILIBRIUM?
Knowledge of the ΔG′ ATP has allowed for an estimate of the extent and direction of the gradient of Na+ between the extra- and intracellular phases of perfused heart, with a resting membrane potential of −83 mV that was found to be in near-equilibrium with the reaction of the Na+ pump in the presence of an open K+ channel in Eq. 3: following statement (3):
 |
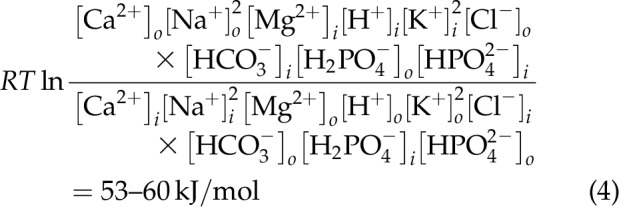
However, this electroneutral osmoneutral statement cannot be written for tissues where there is no open K+ channel. The gradients of the 9 major inorganic ions defined in Krebs and Henseleit (14) and the initial hemodialysis fluids were therefore also examined (15). The energy of the 9 ions between intra- and extracellular phases was found to vary between 53 and 60 kJ/mol as stated in Eq. 4:
 |
The energy of the 9 ion gradients was then compared with the independently determined ΔG′ of ATP hydrolysis in the same 3 tissues. The results of the comparison are given in Table 2.
TABLE 2.
The values of ΔG′ ATP of hydrolysis measured compared with the calculated ΔG′ from the 9 ion empirical equations
| ΔG′ (kJ/mol) | Perfused beating heart |
Liver |
Red blood cell, control | |||
|---|---|---|---|---|---|---|
| Glucose | G + insulin | G + R-3-hydroxybutyrate | Control | +Na acetate | ||
| ATP | −54.2 ± 0.6 | −58.0 ± 0.2 | −57.0 ± 0.3 | −56.5 ± 0.4 | −56.1 ± 0.7 | −57.1 ± 0.4 |
| 9 ions | 53.3 ± 0.1 | 57.0 ± 2.5 | 59.0 ± 1.8 | 54.0 ± 0.7 | 60.3 ± 1.1 | 53.0 ± 0.6 |
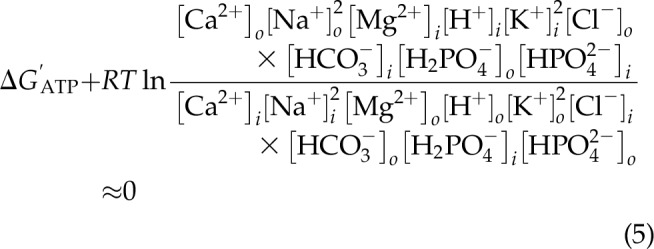
The energy of the distribution of the 9 ions between the intra- and extracellular spaces were linked to one another, to the ΔG′ of ATP, and to the resting membrane potential in an osmoneutral and electroneutral manner as shown in Eq. 5, where the energy of Na+ transport is linked to the transport of the other 9 ions. The driving forces are established by the excess intracellular impermeant anions that set up the Gibbs-Donnan system (16, 17).
 |
The finding that the energy of the 9 major inorganic ions is essentially the same as that of the ΔG′ of ATP demonstrates that this ionic distribution is in near-equilibrium with the energy of ATP hydrolysis.
RECENT FINDINGS
The equation shown in Eq. 5 was selected by a computer search to give an electroneutral osmoneutral reaction, which was equivalent to the ΔG′ of ATP. In the time since the empirical equation was matched to the data, there has been much progress in identifying and characterizing many plasma membrane ion transporters. It is therefore of interest to determine why [Na+] and [K+] are present in the equation as second-order (squared) terms while the other 7 major ions are present as first-order terms.
The transport reaction of the 3 Na+-2 K+ ATPase is seen in Eq. 6:
 |
The order of Na+ is 2 in Eq. 5, although at first glance it might be predicted to be 3. If 1 writes a mass action equation for the 3 Na+-2 K+ ATPase, the Na+ term would be cubed and the K+ term would be squared. The Na+ is transported from in to out, so the product  appears in the numerator.
If a secondary active transporter is present, such as a Na+-dependent ion cotransporter, then:
In this reaction, the  is the reactant and so it is placed in the denominator. Thus, when combining Eq. 6 and Eq. 7,
  . Therefore, the ability of the Na+ gradient to drive the transport of other ions likely leads to the factoring out of 1 order in the Na+ term, bringing the total order to 2.
MATTERS OF CONTROVERSY AND UNANSWERED QUESTIONS
It is widely thought that the origin of the resting negative membrane potential of nerve and muscle cells (18) resulted from the diffusion of a small fraction of the excess intracellular K+ ions to the extracellular phase, creating a “diffusion potential.” This concept formed a basic premise that has been taught in neuroscience classes for over 50 yr (1, 19). The action potential of the axon is thought to result from a reversal of membrane permeability in which the Na+ ion becomes transiently much more permeant than K+ (20). The Goldman–Hodgkin–Katz equation is essentially a kinetic equation based on the relative permeance of the 3 ions K+, Na+, and Cl−. This equation as reported in 1949 is shown in Eq. 8:
 |
where E represents the resting membrane potential of the squid axon where the relative permeability of the 3 ions considered was taken to be: PK = 1, PNa = 0.04, and PCl = 0.45 (19).
We propose that in high-voltage tissue, such as nerve and muscle, the K+ is the permeant ion as represented in the Goldman–Hodgkin–Katz equation. However, K+ is not permeant in other tissues, such as liver or red cell, so the Goldman–Hodgkin–Katz equation does not apply. Rather, the most permeant ion has a permeance of 1 and determines the measured resting membrane potential. The distribution of the 9 major inorganic ions form a Gibbs-Donnan near-equilibrium system in which the energies of the ion distribution are related to one another in near-equilibrium with the energy of ATP hydrolysis as stated in Eq. 5.
PROSPECTS AND PREDICTIONS
The finding that the gradients of the 9 major inorganic ions are dependent upon each other and to the energy of ATP hydrolysis provides new insights into the use of intravenous (IV) therapy. For example, a decrease in cellular phosphorylation potential is then expected to alter the gradients of the 9 major inorganic ions. Therefore, IV fluids that contain an energy substrate to restore the phosphorylation potential as well as a balanced ionic composition to prevent activation of the Na+-K+ ATPase will likely be of therapeutic benefit.
ACKNOWLEDGMENTS
The authors gratefully acknowledge the unique measurement of resting membrane potentials in liver by the late Dr. Robert Wondergem (Department of Biomedical Sciences, East Tennessee State University College of Medicine, Johnson City, TN, USA). Denise Ne (Laboratory of Metabolic Control, U.S. National Institutes of Health, National Institute on Alcohol Abuse and Alcoholism) wrote the search program that matched the data to find the mass action ratio form of equation 5. The authors declare no conflicts of interest.
AUTHOR CONTRIBUTIONS
R. L. Veech wrote the first draft; M. T. King performed much of the research cited, contributed content, and validated the math and data; R. Pawlosky contributed content; P. C. Bradshaw contributed content and edited for comprehension; and W. Curtis made the graphics, initial outline, and contributed content.
REFERENCES
- 1.Alvarez O., Latorre R. (2017) The enduring legacy of the “constant-field equation” in membrane ion transport. J. Gen. Physiol. 149, 911–920 [DOI] [PMC free article] [PubMed] [Google Scholar]
- 2.Veech R. L. (1986) The toxic impact of parenteral solutions on the metabolism of cells: a hypothesis for physiological parenteral therapy. Am. J. Clin. Nutr. 44, 519–551 [DOI] [PubMed] [Google Scholar]
- 3.Masuda T., Dobson G. P., Veech R. L. (1990) The Gibbs-Donnan near-equilibrium system of heart. J. Biol. Chem. 265, 20321–20334 [PubMed] [Google Scholar]
- 4.Veech R. L., King M. T., Pawlosky R., Kashiwaya Y., Bradshaw P. C., Curtis W. (2019) The “great” controlling nucleotide coenzymes. IUBMB Life 71, 565–579 [DOI] [PMC free article] [PubMed] [Google Scholar]
- 5.Veech R. L., Kashiwaya Y., King M. T. (1995) The resting membrane potential of cells are measures of electrical work, not of ionic currents. Integr. Physiol. Behav. Sci. 30, 283–307 [DOI] [PubMed] [Google Scholar]
- 6.Veech R. L., Lawson J. W. R., Cornell N. W., Krebs H. A. (1979) Cytosolic phosphorylation potential. J. Biol. Chem. 254, 6538–6547 [PubMed] [Google Scholar]
- 7.Skou J. C. (1965) Enzymatic basis for active transport of Na+ and K+ across cell membrane. Physiol. Rev. 45, 596–617 [DOI] [PubMed] [Google Scholar]
- 8.Veech R. L., Todd King M., Pawlosky R., Kashiwaya Y., Bradshaw P. C., Curtis W. (2019) The “great” controlling nucleotide coenzymes. IUBMB Life 71, 565–579 [DOI] [PMC free article] [PubMed] [Google Scholar]
- 9.Kléber A. G. (1983) Resting membrane potential, extracellular potassium activity, and intracellular sodium activity during acute global ischemia in isolated perfused guinea pig hearts. Circ. Res. 52, 442–450 [DOI] [PubMed] [Google Scholar]
- 10.Wondergem R., Harder D. R. (1980) Membrane potential measurements during rat liver regeneration. J. Cell. Physiol. 102, 193–197 [DOI] [PubMed] [Google Scholar]
- 11.Veech R. L., Kashiwaya Y., Gates D. N., King M. T., Clarke K. (2002) The energetics of ion distribution: the origin of the resting electric potential of cells. IUBMB Life 54, 241–252 [DOI] [PubMed] [Google Scholar]
- 12.Veech R. L., Gates D. N., Crutchfield C., Gitomer W. L., Kashiwaya Y., King M. T., Wondergem R. (1994) Metabolic hyperpolarization of liver by ethanol: the importance of Mg2+ and H+ in determining impermeant intracellular anionic charge and energy of metabolic reactions. Alcohol. Clin. Exp. Res. 18, 1040–1056 [DOI] [PubMed] [Google Scholar]
- 13.Nernst W. H. (1888) Zur Kinetik der Lösung befindlichen Körper: theorie der Diffusion. Z. Phys. Chem. 3, 613–637 [Google Scholar]
- 14.Krebs H. A., Henseleit K. (1932) Untersuchunger über die harnstoffbildung im tierhörper. Hoppe Seyler’s Z. Physiol. Chem. 210, 33–66 [Google Scholar]
- 15.Murphy J. P., Swan R. C., Walter W. C., Weller J. M., Merrill J. P. (1952) Use of the artificial kidney III Current procedures in clinical hemodialysis. J. Lab. Clin. Med. 40, 436–445 [PubMed] [Google Scholar]
- 16.Gibbs J. W. (1875) On the equilibrium of heterogeneous substances. Trans. Conn. Acad. Arts Sci. 3, 108–248, 343–524 [Google Scholar]
- 17.Donnan F. G. (1924) The theory of membrane equilibria. Chem. Rev. 1, 73–90 [Google Scholar]
- 18.Hodgkin A. L. (1951) The ionic basis of electrical activity in nerve and muscle. Biol. Rev. Camb. Philos. Soc. 26, 339–409 [Google Scholar]
- 19.Hodgkin A. L., Katz B. (1949) The effect of sodium ions on the electrical activity of giant axon of the squid. J. Physiol. 108, 37–77 [DOI] [PMC free article] [PubMed] [Google Scholar]
- 20.Hodgkin A. L., Huxley A. F. (1939) Action potentials recorded from inside a nerve fibre. Nature 144, 710–711 [Google Scholar]


