Abstract
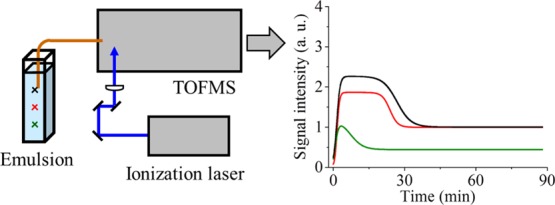
In this study, we used a quantitative analytical method to indicate creaming behavior in an emulsion. An oil-in-water emulsion was directly measured by resonance-enhanced multiphoton ionization time-of-flight mass spectrometry, and the time profiles of the peak areas of an oil component, styrene, were obtained at heights of 1, 2, and 3 cm from the bottom of a sample that had a height of 4 cm. All time profiles roughly indicated that the signal intensity increased once, then decreased, and finally settled. Moreover, we proposed a fitting equation for the time profiles by subtracting two sigmoid functions, whereby the degree of the signal increases at the initial stage, the degree of the signal decreases after the increase, and the times for continuing the higher signal intensities were all longer as the monitoring positions were raised. This method would surely provide useful information about emulsions that undergo creaming behavior.
Introduction
An emulsion is a system where one of two immiscible liquids is dispersed into the other as a small droplet; an oil-in-water (O/W) emulsion occurs when oil is dispersed into water, and dispersing water into oil creates a water-in-oil (W/O) emulsion. Emulsion products include cosmetics, inks, and paints, and the stability of these products is very important. Creaming is one of the main phenomena of the collapse processes of an emulsion1,2 where dispersed droplets move to the top or the bottom (sedimentation) according to the differences in the density between the droplets and the medium in a continuous phase. Creaming behavior is completely different according to the preparation conditions, for example, concentrations of oils and surfactants, which are normally used as emulsifiers, and the stirring conditions. An analytical method that could accurately evaluate the collapse behaviors would help optimize the preparation conditions and more consistently produce a stable emulsion. The creaming rate of an isolated rigid spherical particle in an ideal liquid is given by Stokes’ law.3,4 In a practical setting, the creaming behavior of an emulsion is visually monitored5 or can be measured using one of several analytical methods4 such as transmittance measurement, use of a back-scattering technique,6−8 nuclear magnetic resonance,9 and ultrasound velocity scanning.10 Several reports have discussed the creaming stability of emulsions by measuring at different heights.7,11−13
Resonance-enhanced multiphoton ionization time-of-flight mass spectrometry (REMPI-TOFMS) using an ultraviolet laser as the ionization source is a selective analytical method that can selectively ionize target analytes via resonance transition.14−21 This method is normally applied to the measurement of gas samples. On the other hand, we recently reported the REMPI-TOFMS results of a direct mass analysis of oil in an emulsion, that is, without any pretreatment and separation procedures.22−29 A series of mass spectra can be obtained via the continuous measurement of an O/W emulsion. During the measurement, when oil droplets are introduced into REMPI-TOFMS, the signal intensity arising from the constituent instantly increases. Intense spikes appear on a time profile plotted by the peak area of the component, which reveals the existence of oil droplets in the emulsion.29 Moreover, an averaged time profile of the peak areas provides valuable information concerning the change in the concentration of an oil component.28 We recently used REMPI-TOFMS to measure an O/W emulsion in the process of creaming and also employed ultraviolet–visible spectrophotometry (UV–vis) to measure transmittance. These techniques offer information of the changes in concentration and turbidity, respectively, and we reported the differences between the two time profiles.30 Although a highly turbid emulsion cannot be measured using UV–vis, REMPI-TOFMS is applicable even to such an emulsion. Therefore, this technique is a novel analytical method that could be used to evaluate the stability of an emulsion.
In the present study, to quantitatively evaluate creaming behavior, REMPI-TOFMS was used to continuously measure an O/W emulsion at different monitoring positions in terms of height, and the differences in the time profiles of an oil component were confirmed. Moreover, a fitting equation for the time profiles was proposed, and the kinetics of the creaming of the present emulsion was discussed.
Experimental Section
Reagents and Sample Preparation
Styrene (density 0.902–0.910 g/mL) and sodium dodecyl sulfate (SDS), which were used as an oil phase and an emulsifier, respectively, were purchased from Wako Pure Chemical Industries (Osaka, Japan) and were used without further purification. Distilled water was prepared in our laboratory.
Sample preparation procedures are as follows. First, 0.06 g of SDS was dissolved in 20 mL of water in a 30 mL vial container. Then, 44 μL of styrene was added and homogenized using a homogenizer (AHG-160D, AS ONE, Osaka) fitted with a shaft generator (HT1010, AS ONE) operated at 5000 rpm for 10 min. The concentration of styrene was 2 g/L. Finally, 4 mL of the prepared emulsion was transferred to a cuvette, resulting in a sample with a height of 4 cm.
Apparatus and Data Acquisition/Analysis
The experimental setup is shown in Figure 1. A linear-type TOFMS was used, which was previously described in detail,22 and is briefly described herein.
Figure 1.
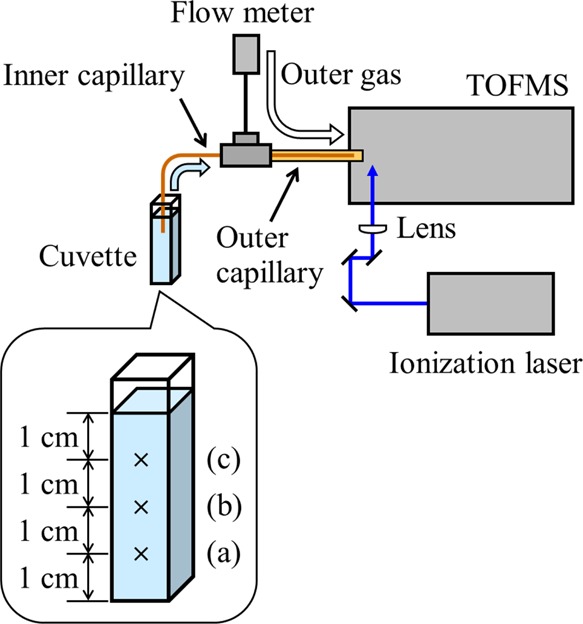
Experimental apparatus. Heights of the monitoring position at (a) 1, (b) 2, and (c) 3 cm from the bottom are also indicated.
A pair of concentric capillary columns was constructed for sample introduction, both of which were deactivated fused-silica capillary columns (GL Sciences, Tokyo, Japan). The tip of the inner capillary was set 2 mm inward from the tip of the outer capillary. An emulsion sample flowed through an inner capillary (inner diameter 25 μm, outer diameter 150 μm, and 60 cm in length), while ambient air flowed through an outer capillary (inner diameter 320 μm, outer diameter 450 μm, 40 cm in length). The flow rate of air was adjusted to 2 mL/min using a flowmeter.
The fourth harmonic of a Nd:YAG laser (GAIA II, wavelength 266 nm, pulse width 4 ns, repetition rate 10 Hz, Rayture Systems, Tokyo, Japan) was used as the ionization laser. The pulse energy was adjusted to 20 μJ. The pulses were focused using a plano-convex lens with a focal length of 200 mm and were aligned 2 mm away from the tip of the outer capillary column.
A series of mass spectra was recorded using a digitizer (AP240, bandwidth 1 GHz, sampling rate 1 GS/s, Acqiris/Agilent Technologies, Tokyo, Japan). The recording was simultaneously started when an inner capillary column was inserted into a cuvette containing a sample. The monitoring positions were set 1, 2, and 3 cm from the bottom of a cuvette (Figure 1). From the series of mass spectra, a molecular ion peak of styrene (m/z 104) was selected and the peak areas were extracted in order to construct a time profile. As will be described later, Figure 3 shows the time profiles of the peak areas measured at each monitoring position, which were plotted without averaging. On the other hand, Figure 4 shows the averaged time profiles, which were obtained by processing as follows. First, the data of the peak area at each monitoring position, as shown in Figure 3, were averaged for every 2 min (120 plots) in each experiment, and then, the averaged time profiles were divided by the sum of the entire peak area for standardization. Next, the time profiles of three measurements obtained at each monitoring position were averaged. Finally, the sum of the entire area obtained at each monitoring position was calculated, and the specific values according to the ratios of all areas, 1:2.4:2.7, were calculated from 1, 2, and 3 cm, respectively, and were then multiplied to give the respective time profiles. The fit of the averaged time profiles was accomplished using data-analysis software (Origin, LightStone, Tokyo, Japan).
Figure 3.
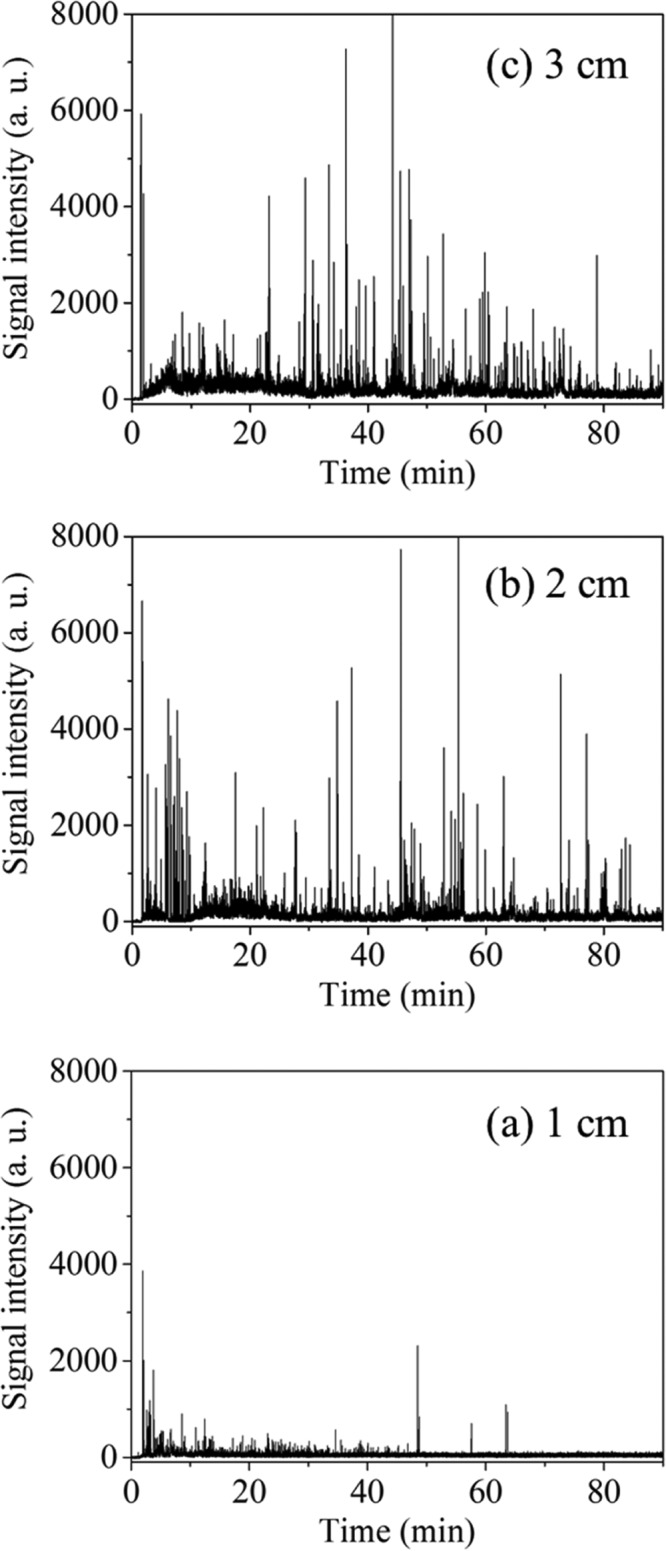
Time profiles of the peak areas of styrene in an O/W emulsion. Heights of the monitoring positions from the bottom: (a) 1, (b) 2, and (c) 3 cm.
Figure 4.
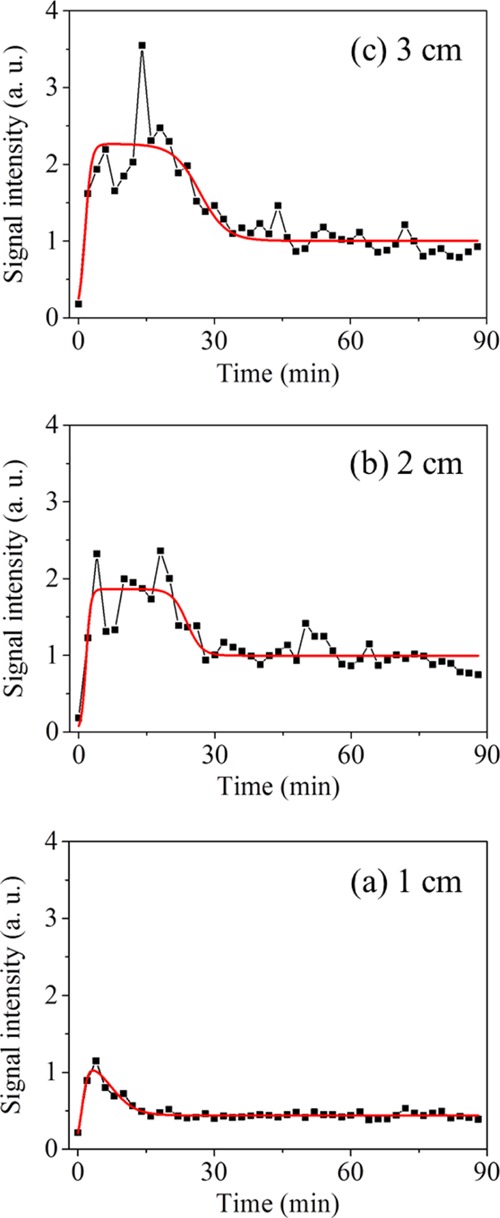
Averaged time profiles of the peak areas of styrene in an O/W emulsion (black plots and lines). Heights of the monitoring positions from the bottom: (a) 1, (b) 2, and (c) 3 cm. Fit results are also shown (red lines).
Results and Discussion
Features of an Emulsion
Figure 2 shows the features of an emulsion transferred to a cuvette after preparation in a vial container, and an emulsion that remained in its vial container following preparation. The emulsion had a white turbidity just after preparation. In the case of the sample that remained in the vial container, the turbidity just after the preparation was higher than that of the other sample, and the lower portion of this sample turned transparent with time. Therefore, the creaming surely occurred toward the upper side in this emulsion. However, the change in the turbidity of the emulsion in the cuvette was often difficult to confirm by time using only eyesight. Therefore, an evaluation of the creaming behavior is still necessary because it differs depending on the conditions—as with this case where the samples were exactly the same.
Figure 2.
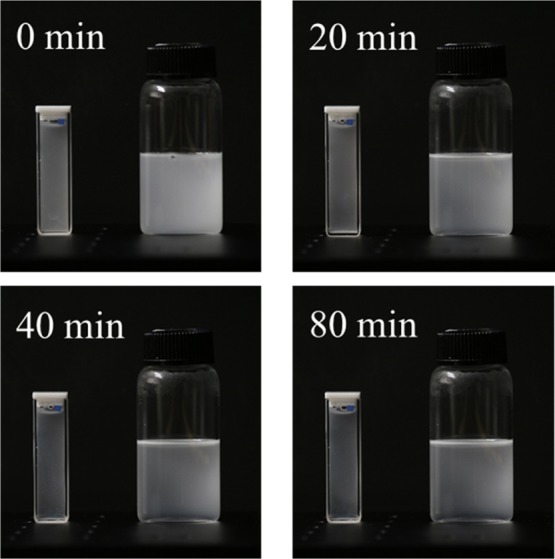
Photos of the emulsion transferred to a cuvette taken at different times. Photos of the emulsion remained in the vial container are also indicated.
Time Profiles Obtained from Different Positions in Terms of Height
In the present study, the changes with time in the peak areas of styrene in an O/W emulsion in a cuvette were investigated at each monitoring position during the creaming process.
Figure 3 shows the time profiles of the peak areas for styrene obtained at monitoring positions 1, 2, and 3 cm from the bottom of a cuvette. In all cases, a signal for styrene was first detected at ca. 2 min after the recording had begun, which was then followed by many spikes. The appearance of intense spikes indicates that relatively large styrene droplets have flowed and were then vaporized into the TOFMS. Among the measurements, the spike intensities, as shown in Figure 3a, mostly decreased with time. These results suggest that the abundance of large styrene droplets gradually decreased with time at the monitoring positions because of creaming. Similar decreases in signal behaviors have previously been reported.22,29,30 On the other hand, as shown in Figure 3b,c, the spike intensities were not necessarily confirmed to have decreased with time. The changes in the size and number of styrene droplets seem complicated and particularly so at higher positions; other collapse processes such as flocculation and coalescence should be considered.
In order to detail the differences in the time profiles obtained at each monitoring position, each time profile was averaged for every 2 min. The averaged time profiles of the peak areas of styrene obtained at the monitoring positions 1, 2, and 3 cm from the bottom of the cuvette are shown in Figure 4. The fit results are also shown in this figure; the fitting equation and kinetics will be discussed later.
As shown in Figure 4a, the signal intensity of styrene 1 cm from the bottom increased once and then gradually decreased and settled at ca. 20 min. In the averaged time profiles at 2 and 3 cm from the bottom, as shown in Figure 4b,c, the signal intensities were also roughly increased and then decreased, but the times that maintained strong signal intensities continued for a while. These results suggest that a floating phenomenon of the emulsion prepared in the present study surely occurred, although the change in the turbidity was not necessarily clear by the naked eye. A possible reason for the signal increase followed by a decrease could be the creaming of flocculated droplets. Robins has reported schematic diagrams of oil volume fraction profiles during creaming.1 In the review, we can see that the fraction increases at once and then decreases at a certain height range in the case of emulsions where creaming of flocculated droplets occurs.
Interestingly, the averaged time profile at 1 cm from the bottom (Figure 4a) fluctuated less than the averaged time profiles at 2 and 3 cm from the bottom (Figure 4b,c). At higher monitoring positions, the styrene droplets were rising from the lower portion of the monitoring area. Therefore, the raw time profiles, as shown in Figure 3b,c, show many intense spikes at all times. As a result, the averaged time profiles were accompanied by relatively large fluctuations, although they represent the average of three measurements.
Fitting Equation and Kinetics
Next, we devised a fitting equation for the time profiles by applying two sigmoid functions. A sigmoid function is a monotonous increasing function with finite limits at negative infinity and infinity. In the present study, this function was expected to fit a signal behavior at the position just beneath the surface of a sample where the concentration of styrene increased with time and finally settled at a certain value. In addition, a monotonous decreasing function can be produced when a sigmoid function is subtracted from a certain constant. This function also has finite limits at negative infinity and infinity. In the present study, this function was assumed to fit the signal behavior monitored near the bottom of a sample where the concentration of styrene had decreased with time and finally settled at a certain value.
In the present study, the fit of the signal behavior that had increased once and then decreased with time was attempted by the subtraction of two sigmoid functions. The signal intensity of styrene, I, in time, t, is expressed by the following equation.
In that equation, A1 and A2 are the amplitudes of each sigmoid function, a1 and a2 are the slopes by the inflection point of each sigmoid function, and γ1 and γ2 are the times of the inflection points of each sigmoid function.
The results of the fit for the time profiles of the signal intensity are also shown in Figure 4, and the calculated coefficients are indicated in Table 1. The software automatically performed the calculations for fitting, with the exception of the value of A1 for the monitoring position 1 cm from the bottom of the cuvette; a value of 1.2 was manually substituted; otherwise, the fit did not accurately reflect the experimentally obtained time profile.
Table 1. Calculated Coefficients in the Fit Equation for the Time Profiles Shown in Figure 4.
| distance from the bottom (cm) | A1 | a1 | γ1 | A2 | a2 | γ2 | R2 |
|---|---|---|---|---|---|---|---|
| 3 | 2.27 | 1.4 | 1.5 | 1.26 | 0.3 | 26.8 | 0.7707 |
| 2 | 1.86 | 1.9 | 1.6 | 0.87 | 0.6 | 23.8 | 0.7323 |
| 1 | 1.2a | 1.5 | 0.9 | 0.76 | 0.4 | 7.2 | 0.9034 |
A1 at 1 cm from the bottom was manually substituted.
The fit was well expressed for the time profile at the monitoring position 1 cm from the bottom (a coefficient of determination: R2 = 0.9034). On the other hand, the values of R2 calculated from the monitoring positions of 2 and 3 cm were not necessarily high (0.7323 and 0.7707, respectively). The fit was considered reasonable, however, and it should be noted that there were many intense spikes on the raw time profiles, as shown in Figure 3. These spikes were particularly prominent at higher monitoring positions, which resulted in large fluctuations in the averaged time profiles.
In Table 1, the amplitudes A1 and A2 increased as the monitoring positions became higher. The amplitude A1 in the first term of the proposed fitting equation concerns the increase in the signal intensity of styrene at a certain monitoring position assuming that its concentration had not decreased. Thus, the concentration of styrene should be higher as the monitoring position was higher. Therefore, the tendency of the coefficient A1 with respect to the monitoring position was considered appropriate.
The amplitude A2 in the second term of the fitting equation concerns the decrease in the signal intensity of styrene at a certain monitoring position. As with coefficient A1, the A2 obtained in the present study increased as the monitoring position became higher. These results suggest that the degrees of both the increase and decrease in the signal intensity were larger as the monitoring position became higher in the present study. Interestingly, the value of A1 – A2, which indicates the signal intensity at which a sufficient amount of time has elapsed, showed little difference between the results obtained at both 2 and 3 cm from the bottom. These results indicate that, though the change in the degrees of the increase and the decrease was rather large at the position 3 cm from the bottom, the final concentrations were almost the same at both 2 and 3 cm. Incidentally, the value of A2 should decrease at a higher monitoring position because once the concentration of styrene has increased, it is not easily decreased.
In addition, the characteristic feature of the coefficient γ2 is notable because it increased as the monitoring position was raised. The value of γ2 reflects the time of the inflection point of the sigmoid function of the second term of the fitting equation. The obtained tendency of γ2 indicates that the time needed for decreasing the signal intensity of styrene should be prolonged as the sampling position is raised. Incidentally, γ1 was also expected to show the same tendency as γ2. However, the obtained values of γ1 were inaccurate because they were small compared with the time interval between the plots (2 min) and, even further, because the signal was first detected 2 min after the recording. In other words, the rate of creaming at the point of an increase in the signal intensity was considered to be too fast against the present experimental conditions, which should be verified in future studies. For the same reasons, the slope of a1 was also inappropriate for evaluating the creaming behavior in the present study.
The slope of a2 was the highest at the monitoring position 2 cm from the bottom, that is, the middle position in height. This tendency could be acceptable for the following reasons. At a lower position of the sample, the concentration of styrene should decrease without much of an increase. Therefore, there is the possibility that the rate of decrease was smaller than that at the middle position. In addition, the higher positions of the sample may require more time to allow for a decrease in the concentration of styrene. It is helpful to consider the highest position, that is, the position just beneath the surface of a sample where the concentration of styrene increases once, but then does not decrease at all. Such behavior was apparent in the oil concentration profiles in the previous review.1 Therefore, at higher positions, it was assumed that the rate of the decrease would be small compared with that at the middle position. Of course, the understood tendency for a2 could be easily changed by any of several factors that would include the ratio of oil and water. In addition, a2 would be relative to the dispersivity of the emulsion to be measured; polydispersed emulsions probably indicate smaller values because the oil concentrations continuously (gradually) change around the boundary between the upper and lower layers, which is different from monodispersed emulsions where the oil concentrations sharply change at the boundary.1 Particularly in polydispersed emulsions, the boundary is ambiguous during creaming, and because of the turbidity, the boundary is difficult either to visually confirm or be detected using UV–vis. On the other hand, the present method using REMPI-TOFMS could surely provide useful information about emulsions that undergo creaming behavior.
Conclusions
In the present study, different heights of an emulsion displaying the creaming phenomenon were directly measured by REMPI-TOFMS, and a fitting of the time profiles of styrene peak areas was performed. Using a fitting equation that consisted of subtracting two sigmoid functions, we quantitatively evaluated the creaming behavior by indicating coefficients such as the times for the continuance of high signal intensities, which increased as the monitoring positions were raised to higher levels. The creaming behavior changes easily, and the changes are dependent on the characteristics of the individual samples and on factors such as convection and vaporization. Therefore, it is important to quantitatively evaluate the creaming phenomenon, and the method proposed in the present study would be helpful for such an endeavor.
Acknowledgments
This work was supported by a research grant provided by the TAKEUCHI Scholarship Foundation (takeuchi2019-J-2). The authors thank Akihiro Chino and Tomonobu Sugiyama for excellent technical assistance.
The authors declare no competing financial interest.
References
- Robins M. M. Emulsions—creaming phenomena. Curr. Opin. Colloid Interface Sci. 2000, 5, 265–272. 10.1016/s1359-0294(00)00065-0. [DOI] [Google Scholar]
- Capek I. Degradation of kinetically-stable o/w emulsions. Adv. Colloid Interface Sci. 2004, 107, 125–155. 10.1016/s0001-8686(03)00115-5. [DOI] [PubMed] [Google Scholar]
- Batchelor G. K. Sedimentation in a dilute dispersion of spheres. J. Fluid Mech. 1972, 52, 245–268. 10.1017/s0022112072001399. [DOI] [Google Scholar]
- McClements D. J. Critical review of techniques and methodologies for characterization of emulsion stability. Crit. Rev. Food Sci. Nutr. 2007, 47, 611–649. 10.1080/10408390701289292. [DOI] [PubMed] [Google Scholar]
- Vélez G.; Fernández M. A.; Muñoz J.; Williams P. A.; English R. J. Role of hydrocolloids in the creaming of oil in water emulsions. J. Agric. Food Chem. 2003, 51, 265–269. 10.1021/jf020664n. [DOI] [PubMed] [Google Scholar]
- Mengual O.; Meunier G.; Cayré I.; Puech K.; Snabre P. TURBISCAN MA 2000: multiple light scattering measurement for concentrated emulsion and suspension instability analysis. Talanta 1999, 50, 445–456. 10.1016/s0039-9140(99)00129-0. [DOI] [PubMed] [Google Scholar]
- Chanamai R.; McClements D. J. Dependence of creaming and rheology of monodisperse oil-in-water emulsions on droplet size and concentration. Colloids Surf., A 2000, 172, 79–86. 10.1016/s0927-7757(00)00551-3. [DOI] [Google Scholar]
- Sęk J.; Jóźwiak B. Application of the continuity theory for the prediction of creaming phenomena in emulsions. J. Dispersion Sci. Technol. 2015, 36, 991–999. 10.1080/01932691.2014.944979. [DOI] [Google Scholar]
- McDonald P. J.; Ciampi E.; Keddie J. L.; Heidenreich M.; Kimmich R. Magnetic-resonance determination of the spatial dependence of the droplet size distribution in the cream layer of oil-in-water emulsions: Evidence for the effects of depletion flocculation. Phys. Rev. E: Stat. Phys., Plasmas, Fluids, Relat. Interdiscip. Top. 1999, 59, 874–884. 10.1103/physreve.59.874. [DOI] [Google Scholar]
- Dickinson E.; Golding M.; Povey M. J. W. Creaming and flocculation of oil-in-water emulsions containing sodium caseinate. J. Colloid Interface Sci. 1997, 185, 515–529. 10.1006/jcis.1996.4605. [DOI] [PubMed] [Google Scholar]
- Bury M.; Gerhards J.; Erni W.; Stamm A. Application of a new method based on conductivity measurements to determine the creaming stability of o/w emulsions. Int. J. Pharm. 1995, 124, 183–194. 10.1016/0378-5173(95)00075-t. [DOI] [Google Scholar]
- Newling B.; Glover P. M.; Keddie J. L.; Lane D. M.; McDonald P. J. Concentration profiles in creaming oil-in-water emulsion layers determined with stray field magnetic resonance imaging. Langmuir 1997, 13, 3621–3626. 10.1021/la9610056. [DOI] [Google Scholar]
- Oliczewski S.; Daniels R. A novel fiber-optic photometer for in situ stability assessment of concentrated oil-in-water emulsions. AAPS PharmSciTech 2007, 8, E145 10.1208/pt0803070. [DOI] [PMC free article] [PubMed] [Google Scholar]
- Lubman D. M. Optically selective molecular mass spectrometry. Anal. Chem. 1987, 59, 31A–40A. 10.1021/ac00128a001. [DOI] [Google Scholar]
- Lin C.-H.; Murata Y.; Imasaka T. Analysis of photoablation products resulting from polymer materials by supersonic beam/multiphoton ionization/time-of-flight mass spectrometry. Anal. Chem. 1996, 68, 1153–1157. 10.1021/ac951045z. [DOI] [PubMed] [Google Scholar]
- Haefliger O. P.; Zenobi R. Laser mass spectrometric analysis of polycyclic aromatic hydrocarbons with wide wavelength range laser multiphoton ionization spectroscopy. Anal. Chem. 1998, 70, 2660–2665. 10.1021/ac971264f. [DOI] [PubMed] [Google Scholar]
- Elsila J. E.; de Leon N. P.; Zare R. N. Factors affecting quantitative analysis in laser desorption/laser ionization mass spectrometry. Anal. Chem. 2004, 76, 2430–2437. 10.1021/ac0354140. [DOI] [PubMed] [Google Scholar]
- Mühlberger F.; Hafner K.; Kaesdorf S.; Ferge T.; Zimmermann R. Comprehensive on-line characterization of complex gas mixtures by quasi-simultaneous resonance-enhanced multiphoton ionization, vacuum-UV single-photon ionization, and electron impact ionization in a time-of-flight mass spectrometer: setup and instrument characterization. Anal. Chem. 2004, 76, 6753–6764. 10.1021/ac049535r. [DOI] [PubMed] [Google Scholar]
- Kruth C.; Czech H.; Sklorz M.; Passig J.; Ehlert S.; Cappiello A.; Zimmermann R. Direct infusion resonance-enhanced multiphoton ionization mass spectrometry of liquid samples under vacuum conditions. Anal. Chem. 2017, 89, 10917–10923. 10.1021/acs.analchem.7b02633. [DOI] [PubMed] [Google Scholar]
- Boesl U. Time-of-flight mass spectrometry: Introduction to the basics. Mass Spectrom. Rev. 2017, 36, 86–109. 10.1002/mas.21520. [DOI] [PubMed] [Google Scholar]
- Tang Y.; Yamamoto S.; Imasaka T. Determination of nitrated polycyclic aromatic hydrocarbons in particulate matter 2.5 by laser ionization mass spectrometry using an on-line chemical-reduction system. Analyst 2019, 144, 2909–2913. 10.1039/c9an00308h. [DOI] [PubMed] [Google Scholar]
- Ishigami H.; Tsuda Y.; Uchimura T. Laser ionization/time-of-flight mass spectrometry for the direct analysis of emulsions. Anal. Methods 2014, 6, 5615–5619. 10.1039/c4ay00633j. [DOI] [Google Scholar]
- Fukaya H.; Tsuda Y.; Uchimura T. Laser ionization time-of-flight mass spectrometry for the evaluation of a local microenvironment in an emulsion. Anal. Methods 2016, 8, 270–274. 10.1039/c5ay01490e. [DOI] [Google Scholar]
- Tsuda Y.; Uchimura T. Evaluating the aging of multiple emulsions using resonance-enhanced multiphoton ionization time-of-flight mass spectrometry. Anal. Sci. 2016, 32, 789–795. 10.2116/analsci.32.789. [DOI] [PubMed] [Google Scholar]
- Yamamoto H.; Ishigami H.; Uchimura T. Online monitoring of a styrene monomer and a dimer in an emulsion via laser ionization time-of-flight mass spectrometry. Anal. Sci. 2017, 33, 731–733. 10.2116/analsci.33.731. [DOI] [PubMed] [Google Scholar]
- Fujita C.; Sugimura Y.; Uchimura T. Development of multiphoton ionization time-of-flight mass spectrometry for the detection of small emulsion droplets. Appl. Sci. 2018, 8, 413. 10.3390/app8030413. [DOI] [Google Scholar]
- Iwata M.; Uchimura T. Resonance-enhanced multiphoton ionization time-of-flight mass spectrometry for evaluating emulsion inversion via temperature change. Anal. Sci. 2019, 35, 19P272.in press 10.2116/analsci.19P272. [DOI] [PubMed] [Google Scholar]
- Fukaya H.; Uchimura T. A quantitative analysis of an oil component in an emulsion by multiphoton ionization mass spectrometry. Anal. Sci. 2017, 33, 1067–1070. 10.2116/analsci.33.1067. [DOI] [PubMed] [Google Scholar]
- Shimo Y.; Uchimura T. Time-profile measurement of an emulsion using multiphoton ionization time-of-flight mass spectrometry in combination with a microscope. Anal. Sci. 2016, 32, 1059–1063. 10.2116/analsci.32.1059. [DOI] [PubMed] [Google Scholar]
- Shinoda R.; Uchimura T. Evaluating the creaming of an emulsion via mass spectrometry and uv–vis spectrophotometry. ACS Omega 2018, 3, 13752–13756. 10.1021/acsomega.8b02283. [DOI] [PMC free article] [PubMed] [Google Scholar]


