Abstract
11C-UCB-J is a new PET tracer for synaptic density imaging. Recently, we conducted 11C-UCB-J PET on patients with mild cognitive impairment or early Alzheimer disease (AD) and found a 41% decrease in specific binding in the hippocampus compared with healthy subjects. We hypothesized that 11C-UCB-J may have potential to be a general biomarker for evaluating AD treatment effects via monitoring of synaptic density changes. In this study, we performed longitudinal 11C-UCB-J PET on AD mice to measure the treatment effects of saracatinib, which previously demonstrated synaptic changes with postmortem methods. Methods: Nine wild-type (WT) mice and 9 amyloid precursor protein and presenilin 1 double-transgenic (APPswe/PS1ΔE9 [APP/PS1]) mice underwent 3 11C-UCB-J PET measurements: at baseline, after treatment, and during drug washout. After baseline measurements, saracatinib, a Fyn kinase inhibitor currently in clinical development for AD treatment, was administered by oral gavage for 41 ± 11 d. Treatment-phase measurements were performed on the last day of treatment, and washout-phase measurements occurred more than 27 d after the end of treatment. SUVs from 30 to 60 min after injection of 11C-UCB-J were calculated and normalized by the whole-brain (WB) or brain stem (BS) average values as SUV ratio (SUVR(WB) or SUVR-1(BS)). Results: Hippocampal SUVR(WB) at baseline was significantly lower in APP/PS1 than WT mice (APP/PS1: 1.11 ± 0.04, WT: 1.15 ± 0.02, P = 0.033, unpaired t test). Using SUVR-1(BS) in the hippocampus, there was also a significant difference at baseline (APP/PS1: 0.48 ± 0.13, WT: 0.65 ± 0.10, P = 0.017, unpaired t test). After treatment with saracatinib, hippocampal SUVR(WB) in APP/PS1 mice was significantly increased (P = 0.037, paired t test). A trend-level treatment effect was seen with hippocampal SUVR-1(BS). Saracatinib treatment effects may persist, as there were no significant differences between WT and APP/PS1 mice after drug washout. Conclusion: On the basis of the 11C-UCB-J PET results, hippocampal synaptic density was lower in APP/PS1 mice than in WT mice at baseline, and this deficit was normalized by treatment with saracatinib. These results support the use of 11C-UCB-J PET to identify disease-specific synaptic deficits and to monitor treatment effects in AD.
Keywords: SV2A, 11C-UCB-J PET, synaptic density, Alzheimer disease, saracatinib (AZD0530)
Alzheimer disease (AD), the most common cause of dementia, features aggregated amyloid-β and hyperphosphorylated tau with symptoms correlated to synaptic loss in the brain. There are no disease-modifying drugs approved for the treatment of AD (1). A challenge is that use of cognition as a primary endpoint can require enrolling thousands of subjects. In this context, in vivo biomarkers of synaptic density have the potential to be extremely beneficial for monitoring treatment effects in proof-of-concept trials.
The PET agent (R)-1-((3-(11C-methyl-11C)pyridin-4-yl)methyl)-4-(3,4,5-trifluorophenyl)pyrrolidin-2-one (11C-UCB-J) targets synaptic vesicle glycoprotein 2A (SV2A) and can be used for synaptic density imaging. SV2A is one of the membrane proteins located on presynaptic vesicles. We showed that 11C-UCB-J PET intensity correlates well with in vitro histopathologic synaptic markers and allows an evaluation of synaptic density in vivo (2). Recently, we conducted 11C-UCB-J PET on patients with mild cognitive impairment or early AD, revealing a 41% mean decrease in specific binding in the hippocampus compared with healthy subjects (3). Those results demonstrate that disease-specific synaptic loss can be detected with 11C-UCB-J PET and suggest that this tracer may be suitable as a new biomarker for AD. In addition, this tracer may also have the potential to be a general biomarker for evaluating drug treatment effects via monitoring synaptic density changes in vivo. Thus, the demonstration of the utility of an SV2A PET imaging paradigm for assessment of in vivo longitudinal changes in synaptic density after AD drug treatment would be an important advancement.
The tyrosine kinase Fyn plays an important role in AD pathogenesis. Fyn activation is increased in the brain of AD patients and in cultured neurons exposed to oligomeric amyloid-β (4–6). A complex of tau with Fyn shuttles into the postsynaptic terminal, enhancing proximity to the Fyn substrate, the N-methyl-d-aspartate receptor subunit 2B, and facilitating excitotoxicity and synapse loss (7,8). Therapeutic Fyn inhibition using saracatinib reversed memory deficits in AD model mice and reversed synaptic loss, as measured by postmortem SV2A and postsynaptic density protein 95 immunoreactivity (9). This ex vivo study reported 30% lower SV2A immunoreactivity in the hippocampi of AD model mice than in wild-type (WT) mice. Moreover, the saracatinib benefit persisted after treatment discontinuation (10).
Here, we evaluated saracatinib treatment effects in an AD mouse model by in vivo 11C-UCB-J PET. We hypothesized that we can use in vivo imaging to document dynamic changes in synaptic density, previously measurable only after death.
MATERIALS AND METHODS
Mouse Strains and Care
All animal experiments were approved by the Yale Institutional Animal Care and Use Committee for compliance with National Institutes of Health requirements on the use of laboratory animals or the equivalent. WT C57/B6J mice and amyloid precursor protein and presenilin 1 double-transgenic (APPswe/PS1ΔE9 [APP/PS1]) mice (11) were purchased from Jackson Laboratories. APP/PS1 display abundant amyloid-β plaque depositions and cognitive deficits in late adulthood (12). After purchase, the mice were maintained at Yale as described for previous related studies (10,13). Group characteristics at the time of baseline scans were matched for sex (4 male and 5 female mice in both groups), age (APP/PS1: 65.4 ± 1.3 wk, WT: 66.4 ± 1.8 wk, P = 0.213, unpaired 2-tailed t test), and body weight (APP/PS1: 34.3 ± 9.7 g, WT: 31.6 ± 6.5 g, P = 0.484, unpaired 2-tailed t test). Over the course of the study, 2 animals were lost to follow-up. One animal did not recover from anesthesia, and the second was inadvertently euthanized by lab staff. The animals appeared normal at their last observation.
Treatment
Following protocols previously used (9,10), saracatinib (5 mg/kg orally every 12 h) was administered to WT and APP/PS1 mice for 40.7 ± 11.3 d after baseline PET measurements were acquired. Saracatinib difumarate was dissolved in a vehicle of 0.5% w/v hydroxypropyl methylcellulose and 0.1% w/v polysorbate 80 at a concentration of 1 mg of active ingredient per 1 mL of vehicle. Saracatinib was administered by oral gavage using a 20-gauge plastic feeding tube (FTP-20-30; Instech).
11C-UCB-J PET Measurements
Nine littermate mice of each genotype underwent 3 11C-UCB-J PET measurements: at baseline, after treatment, and during drug washout. All WT mice and 7 of 9 APP/PS1 mice completed all 3 measurements. Age at baseline measurements was 66 ± 1.8 wk for WT mice and 65 ± 1.4 wk for APP/PS1 mice. Treatment-phase measurements were performed on the last day of drug treatment, and washout-phase measurements occurred 37 ± 17 d (range, 27–81 d) after the end of treatment.
Imaging was performed on a dedicated rodent Inveon PET/CT system (Siemens Medical Solutions). CT scans were acquired on the Inveon.
The mice were maintained on isoflurane anesthesia (1.5%–2.5%) for the duration of each experiment. Anesthesia levels were adjusted for individual mice to minimize movement. Body temperature was maintained with a water-circulating heating pad or heat lamp. 11C-UCB-J was administered via retroorbital injection. The radioactivity dose was 6.1 ± 2.4 MBq (APP/PS1: 6.0 ± 2.0 MBq, WT: 6.3 ± 2.6 MBq), and the mass dose was 0.026 ± 0.022 μg (APP/PS1: 0.022 ± 0.016 μg, WT: 0.027 ± 0.024 μg). Comparison between groups and study phases showed that the radioactivity dose was significantly different between the baseline and treatment phases in the APP/PS1 group (baseline: 6.9 ± 2.2 MBq, treatment: 4.8 ± 1.2 MBq, P = 0.03). The mass doses in the WT group in the baseline and treatment phases were also different (baseline: 0.017 ± 0.008 μg, treatment: 0.043 ± 0.032 μg, P = 0.04). However, we consider these statistical differences to have no effect on the results since we saw no mass effects. Arterial blood sampling was avoided to minimize the invasiveness of the procedures. Mean activity in either whole brain (WB) or a brain stem (BS) region of interest (ROI) was used for normalization.
Images were reconstructed using 3-dimensional ordered-subset expectation maximization (2 iterations, 16 subsets) with a maximum a posteriori probability algorithm (25 iterations) and corrections for decay and randoms. No corrections were applied for attenuation or scatter because technical issues prevented the acquisition of CT images for several subjects. In nearly all cases, 2 animals were placed side by side on the scanner bed, and in most cases, 1 WT mouse and 1 APP/PS1 mouse were scanned together. Because of the small size of the mouse, attenuation and scatter errors are expected to be small. In addition, our outcome measure was normalized by a reference region value; thus, any quantification bias is likely to produce no error in the ratio.
Three mice of each genotype were measured in the first cohort. All underwent baseline, treatment, and washout-phase measurements. In this cohort, emission data were acquired from the time of injection to optimize the acquisition time. Using data from 0 to 90 min, nondisplaceable binding potential (BPND) in each ROI was estimated by the simplified reference tissue model (14) using BS as a reference region. BPND estimated with high fitting error (SE > 20%) was excluded. SUV (i.e., activity normalized to injected dose and body weight) images were created from 30 to 60 min, and SUV ratios (SUVRs) were calculated by normalization to the BS mean value (SUVR(BS)). SUV measurements for the time frame of 30–60 min after tracer injection was used for subsequent cohorts to accelerate throughput. Thus, the primary outcome measure used for analysis was SUV from 30 to 60 min, which was applied to the whole group, including the first cohort. SUVR(WB) was SUVR normalized by WB. The WB normalization was chosen to minimize variability. BS normalization was chosen because of the lower gray matter fraction of the BS (approximating a reference region), so that this value approximates BPND, after subtraction of 1 (SUVR-1(BS)). BPND in all ROIs was compared with SUVR-1(BS) and found to be well correlated. Preliminary results in rats showed minimum displacement in the pons with levetiracetam (data not shown).
Image Registration and Definition of ROIs
The T2-weighted image in the Ma–Benveniste–Mirrione mouse brain atlas (15,16) was manually aligned to an average PET image for each measurement (mean of all frames) via a rigid registration. ROIs were extracted from the atlas, and regional time–activity curves were obtained by applying the template ROIs to the PET dynamic images. The following ROIs were included: striatum, neocortex, basal forebrain plus septum, hypothalamus, central gray, superior colliculi, mid brain, internal capsule, hippocampus, thalamus, amygdala, BS, and cerebellum. A WB ROI was created by merging all ROIs. Time–activity curves were calculated in SUV units.
Statistical Analysis
The primary target region was the hippocampus. All variables are presented as mean ± SD. For longitudinal treatment-related results, paired t tests were applied. For group differences, unpaired t tests were applied. P values of less than 0.05 without correction for multiple comparisons were considered statistically significant.
RESULTS
Mouse 11C-UCB-J PET Imaging Shows Reversible Kinetics
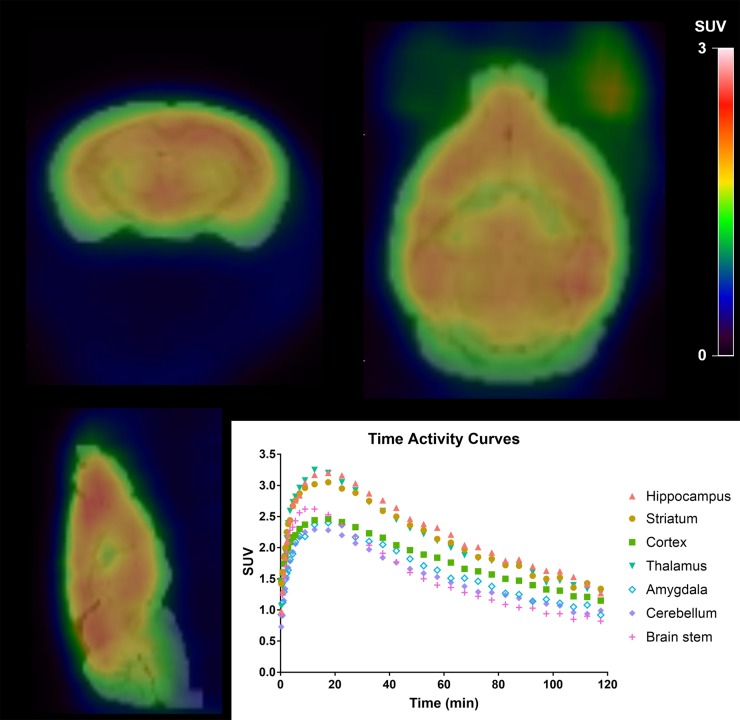
Figure 1 shows a static image of a single mouse collected from 30 to 60 min after injection overlaid on the brain MR atlas image with regional time–activity curves. After injection of 11C-UCB-J, all time–activity curves showed a rapid increase followed by clearance. The time–activity curves peaked earlier and cleared more quickly than previously observed time–activity curves for humans and monkeys (17,18). This finding suggests that tracer uptake was not limited by the route of administration, and this conclusion is similar to that from previous studies with other radiotracers (19). The SUV images demonstrated high uptake in gray matter regions (e.g., neocortex and hippocampus) and lower uptake in brain regions corresponding to white matter.
FIGURE 1.
Representative 11C-UCB-J PET image and time–activity curve in single mouse. Static SUV image (30–60 min after injection) is overlaid on atlas brain MR image.
BPND and SUVR-1(BS) Demonstrate Excellent Agreement
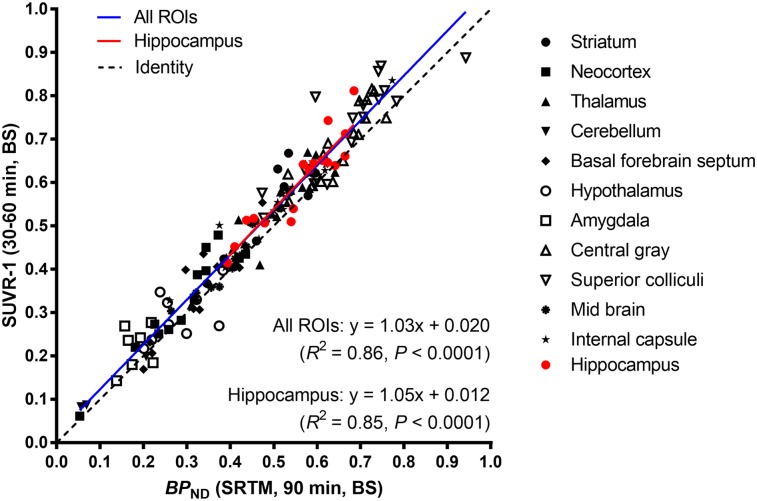
To shorten the acquisition time, we evaluated the correlation between BPND estimated from 90 min of PET data and SUVR-1(BS) calculated from 30 to 60 min across all brain ROIs (Fig. 2). BPND and SUVR-1(BS) were in excellent agreement in the hippocampus and all other ROIs (hippocampus: SUVR-1(BS) = 1.03 × BPND + 0.020, R2 = 0.86, P < 0.0001; all ROIs: SUVR-1(BS) = 1.05 × BPND + 0.012, R2 = 0.85, P < 0.0001). We also compared BPND with SUVR-1(BS) calculated at 40–70, 50–80, and 60–90 min, but those time windows did not show better agreement (as assessed by the Pearson correlation coefficient) than 30–60 min. Given these results in the first cohort, we acquired data only from 30 to 60 min in the subsequent cohorts. This allowed multiple animals to be measured from 1 tracer synthesis.
FIGURE 2.
Scatterplot of BPND (estimated by simplified reference tissue model [SRTM]) and SUVR-1(BS).
11C-UCB-J PET Detects Treatment Effects in Hippocampus
There was no significant difference between WT mice and APP/PS1 mice in mean SUVR(WB) and SUVR-1(BS) at 30–60 min (APP/PS1: 2.29 ± 0.61, WT: 2.10 ± 0.64, P = 0.30 for WB; APP/PS1: 1.72 ± 0.53, WT: 1.51 ± 0.48, P = 0.15 for BS), because of large interanimal variability in SUV. Thus, we normalized the SUV at 30–60 min to mean SUVR(WB) and SUVR-1(BS).
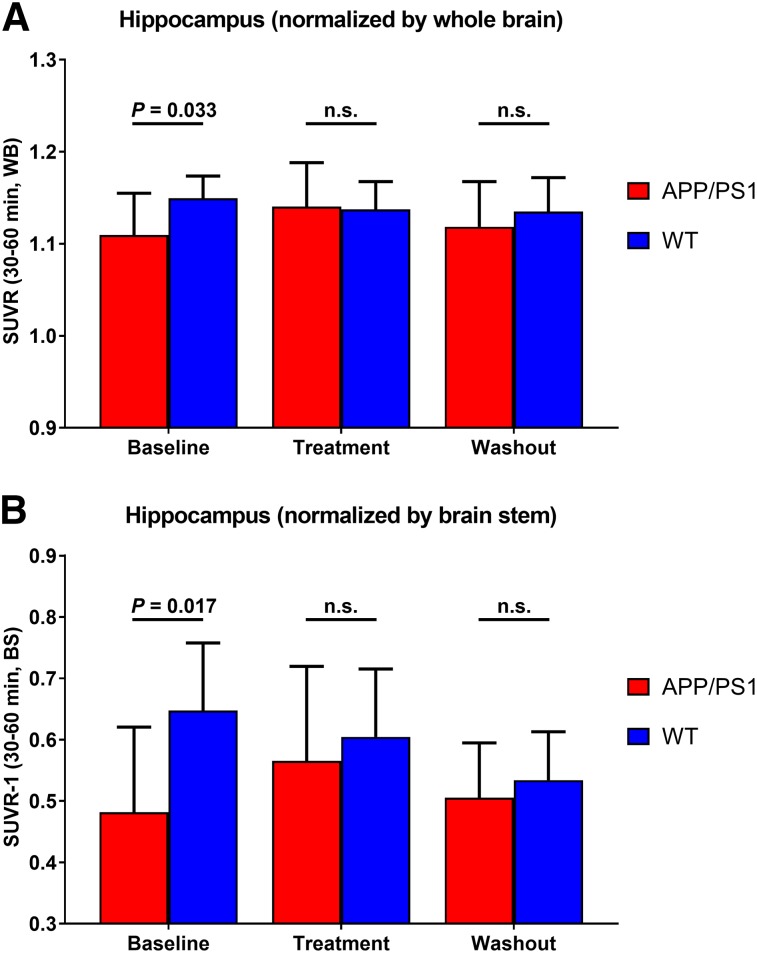
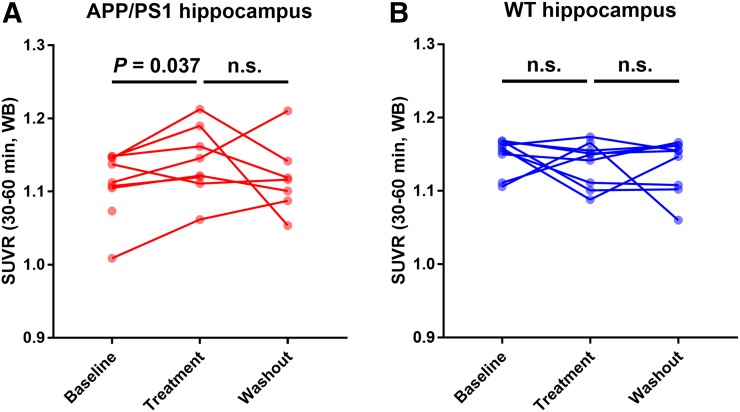
Hippocampal SUVR(WB) at baseline was 1.11 ± 0.04 for APP/PS1 mice and 1.15 ± 0.02 for WT mice. Figure 3A shows the intergroup comparison of hippocampal SUVR(WB) at baseline, after treatment, and during drug washout. Figure 4 shows the individual animal data at each time point. At baseline, SUVR(WB) was significantly lower in APP/PS1 than WT mice (P = 0.033, unpaired 2-tailed t test) (Fig. 3A). After 1 mo of treatment with saracatinib, hippocampal SUVR(WB) in APP/PS1 mice increased significantly (P = 0.037, paired 2-tailed t test) (Fig. 4A). After treatment, hippocampal SUVR(WB) was the same in APP/PS1 animals as in WT animals (APP/PS1: 1.14 ± 0.04, WT: 1.14 ± 0.03, P = 0.88, unpaired 2-tailed t test) (Fig. 3A). Saracatinib treatment effects may persist, as there were no significant differences between WT and APP/PS1 mice during drug washout (APP/PS1: 1.12 ± 0.05, WT: 1.14 ± 0.03, P = 0.45, unpaired 2-tailed t test) (Fig. 3A). This finding may reflect a lasting drug effect, based on previous immunohistochemical analysis; however, the PET data are not conclusive since there was also no significant difference between baseline and washout values in either the APP/PS1 group or the WT group.
FIGURE 3.
Hippocampal SUVRs in WT and APP/PS1 mice during baseline, treatment, and washout phases: SUVR(WB) (A) and SUVR-1(BS) (B).
FIGURE 4.
Line graphs of longitudinal SUVR(WB) in hippocampus for APP/PS1 (A) and WT (B) at each time point. Two data points at baseline and treatment in A are not connected with data point in next phase because of deaths between time points.
For SUVR-1(BS) in the hippocampus, there was also a significant deficit in the APP/PS1 mice at baseline compared with WT mice (APP/PS1: 0.48 ± 0.13, WT: 0.65 ± 0.10, P = 0.013, unpaired 2-tailed t test), which was restored by treatment (Fig. 3B). SUVR-1(BS) did not show a significant treatment effect in the APP/PS1 group; however, there was a trend toward an effect similar to SUVR(WB) (baseline: 0.48 ± 0.13, treatment: 0.57 ± 0.14, P = 0.073, paired 2-tailed t test). One animal was lost to follow-up after the baseline scan and a second after the posttreatment scan, and the analysis was repeated excluding these animals. Significance was retained for the treatment effect, as assessed with SUVR(WB) in the APP/PS1 group (baseline: 1.11 ± 0.05, treatment: 1.14 ± 0.05, P = 0.050, paired 2-tailed t test), as well as for the baseline group difference with SUVR-1(BS) (APP/PS1: 0.50 ± 0.14, WT: 0.65 ± 0.10, P = 0.040, unpaired 2-tailed t test). The significance of the baseline group difference with SUVR(WB) was reduced to trend level (APP/PS1: 1.11 ± 0.05, WT: 1.15 ± 0.02, P = 0.089, unpaired 2-tailed t test).
Other regions (striatum, neocortex, amygdala, thalamus, and cerebellum) were evaluated in an exploratory manner. SUVR(WB) did not differ among groups or phases. SUVR-1(BS) in the striatum, thalamus, and amygdala was significantly lower in the APP/PS1 mice at baseline than in WT mice. There were no significant differences between phases (Table 1).
TABLE 1.
SUVR(WB) and SUVR-1(BS) in Hippocampus and Exploratory Regions
| APP/PS1 |
WT |
|||||
| Region | Baseline | Treatment | Washout | Baseline | Treatment | Washout |
| SUVR(WB) | ||||||
| Hippocampus | 1.11 ± 0.04*† | 1.14 ± 0.04† | 1.12 ± 0.05 | 1.15 ± 0.02* | 1.14 ± 0.03 | 1.14 ± 0.03 |
| Striatum | 1.08 ± 0.04 | 1.08 ± 0.03 | 1.08 ± 0.03 | 1.10 ± 0.02 | 1.09 ± 0.01 | 1.06 ± 0.10 |
| Cortex | 0.91 ± 0.05 | 0.92 ± 0.04 | 0.96 ± 0.04 | 0.93 ± 0.05 | 0.89 ± 0.04 | 0.92 ± 0.07 |
| Thalamus | 1.07 ± 0.03 | 1.09 ± 0.03 | 1.04 ± 0.03 | 1.11 ± 0.04 | 1.10 ± 0.03 | 1.11 ± 0.04 |
| Amygdala | 0.82 ± 0.03 | 0.83 ± 0.04 | 0.86 ± 0.03 | 0.82 ± 0.05 | 0.83 ± 0.04 | 0.84 ± 0.04 |
| Cerebellum | 0.75 ± 0.05 | 0.72 ± 0.03 | 0.71 ± 0.06 | 0.74 ± 0.06 | 0.76 ± 0.05 | 0.76 ± 0.16 |
| SUVR-1(BS) | ||||||
| Hippocampus | 0.48 ± 0.13* | 0.57 ± 0.14 | 0.51 ± 0.08 | 0.65 ± 0.10* | 0.60 ± 0.10 | 0.53 ± 0.07 |
| Striatum | 0.44 ± 0.58* | 0.48 ± 0.54 | 0.45 ± 0.43 | 0.58 ± 0.11* | 0.54 ± 0.09 | 0.43 ± 0.14 |
| Cortex | 0.23 ± 0.14 | 0.26 ± 0.13 | 0.30 ± 0.08 | 0.33 ± 0.12 | 0.26 ± 0.11 | 0.25 ± 0.09 |
| Thalamus | 0.44 ± 0.13* | 0.50 ± 0.12 | 0.41 ± 0.11 | 0.59 ± 0.13* | 0.55 ± 0.10 | 0.50 ± 0.06 |
| Amygdala | 0.09 ± 0.08* | 0.14 ± 0.09 | 0.17 ± 0.07 | 0.17 ± 0.06* | 0.17 ± 0.06 | 0.14 ± 0.07 |
| Cerebellum | 0.01 ± 0.08 | −0.00 ± 0.03 | −0.03 ± 0.10 | 0.06 ± 0.10 | 0.07 ± 0.08 | 0.02 ± 0.20 |
P < 0.05, unpaired 2-tailed t test.
P = 0.037, paired 2-tailed t test.
Only hippocampus shows significant differences between groups or time points
DISCUSSION
Using in vivo PET imaging with 11C-UCB-J, this study replicated previous studies performed with ex vivo measurement and demonstrated lower hippocampal SV2A binding in APP/PS1 than WT mice and saracatinib treatment effects. These results were consistent with those previously reported using postmortem analysis (10).
Agreement with Ex Vivo and In Vivo Results
In terms of the magnitude of the group difference at baseline, using 2 different outcome measures, we found lower hippocampal uptake of 3% using WB normalization or 26% with BS normalization. Previous ex vivo studies reported 30% lower SV2A immunoreactivity in the hippocampi of APP/PS1 mice. This discrepancy in magnitude may be attributed to nondisplaceable activity of tracer, partial-volume effects, or differences in normalization.
In 11C-UCB-J PET studies to date, nondisplaceable binding (as measured by levetiracetam blockade in the human brain) accounts for approximately 20% of total tracer binding in gray matter regions. Alternatively, for ex vivo immunoreactivity data, nonspecific activity has typically already been removed by preblocking and washing procedures. Thus, without correction for nondisplaceable binding, the percentage difference in specific binding between groups will be underestimated by the SUVR PET outcome measures (assuming nonspecific binding is unchanged).
Second, the partial-volume effect can cause measured regional group differences to be smaller because of spill-in from nearby cortical uptake, again assuming no group differences in neighboring cortex.
Third, the choice of normalization affects the magnitude of the outcome measure. The test–retest variability for the hippocampus in WT mice was 4.7% for mean SUVR-1(BS) and 0.85% for mean SUVR(WB). Using SUVR-1(BS), we found no significant treatment effect, which we attribute to increased variability when normalizing to BS, because of the small size of this ROI. Using SUVR(WB), the treatment effect became significant, presumably due to lower variability. However, the magnitude of the group difference at baseline was greatly reduced. APP/PS1 mice do have amyloid-β plaque disease in the cortex at this age (10,20), and Gimbel et al. (13) showed about a 15% decrease in the frontal cortex. If there is loss of synaptic density in the cortex, then SUVR(WB) will underestimate the magnitude of between-group differences.
PET images were manually aligned to the MR atlas. To assess the quality of this registration, the right and left hippocampal SUVs were evaluated and found to be similar (2.46 ± 0.69 vs. 2.50 ± 0.72, a difference of −1.4% ± 5.0%).
Retroorbital Sinus Injection
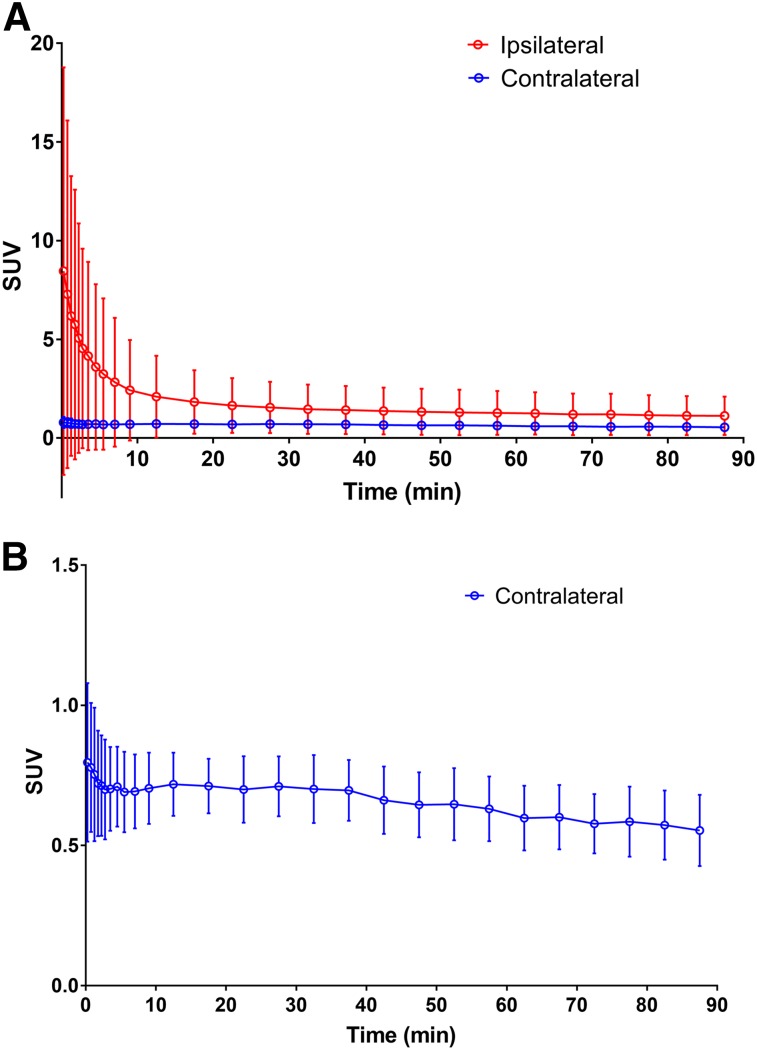
The retroorbital sinus was used for tracer injection to ensure reliability of dose delivery. The tracer was injected on the bench, and each mouse was quickly moved to the scanner bed. Since a pair of animals was scanned simultaneously, we chose this method to minimize the difference in scan start time between the 2 animals. Examination of the time–activity curve from an ROI in the ipsilateral and contralateral eye orbits showed quick tracer absorption from the injection site. The SUV at the injection site quickly decreased by 30 min after injection, the beginning of the time window used to determine SUV (Fig. 5). The averaged SUV from 30 to 60 min was lower in both eye orbits than in the WB (WB: 1.79 ± 0.34, ipsilateral eye: 1.36 ± 1.14, contralateral eye: 0.66 ± 0.11). Ipsilateral eye uptake at 30–60 min was significantly higher than contralateral eye uptake (P < 0.001, paired 2-tailed t test). However, the distance from the highest-uptake voxel of the eyes to the hippocampus is about 5–6 mm; thus, any activity in the eyes caused negligible bias in hippocampal measurements.
FIGURE 5.
Time–activity curves from ROIs in ipsilateral and contralateral eye orbit (A) and contralateral orbit with scale magnified (B). Average and SD are plotted for each time frame from 0 to 90 min after tracer injection.
Potential Injected Mass Dose Effect
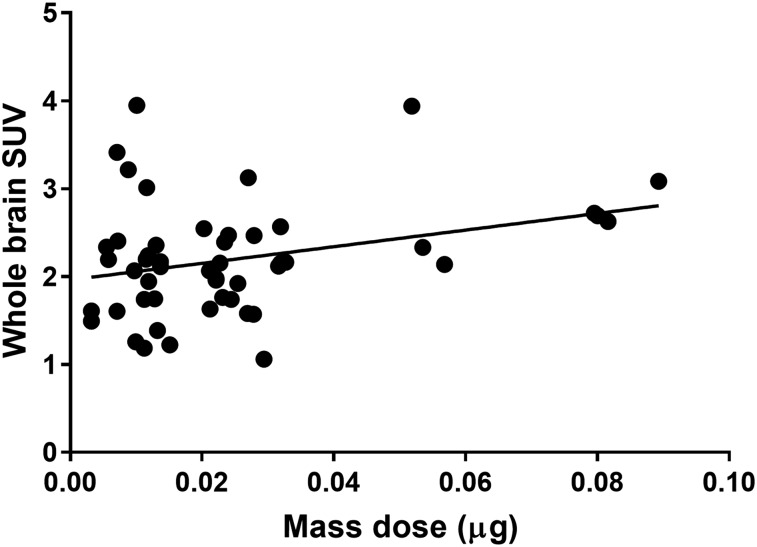
Because the injected mass dose varied from 0.003 to 0.089 μg, it is possible that there were mass effects at the higher mass doses. The mass dose in the WT group significantly differed between the baseline and treatment phases; there was no significant difference between other time points or groups. However, the scatterplot of the injected mass dose versus WB SUV showed no reduction in SUV at a higher injected mass (Fig. 6). Another assessment of potential mass effects can be made by comparing the uptake to the protein density, Bmax. In our previous baboon experiments, the regional SV2A Bmax in brain tissue ranged from 111 pmol/mL in the pons to 918 pmol/mL in the temporal cortex. If we assume that all activity at 30–60 min after injection in the brain was bound to SV2A, the mass concentration of UCB-J was 5.6 ± 6.3 pmol/mL (range, 0.4–27.2 pmol/mL), that is, 1–2 orders of magnitude lower than the Bmax. Furthermore, if there was a minor bias from the injected mass dose, normalization would tend to cancel out this effect. Normalization by a reference region is also useful to eliminate intermeasurement variability in tracer absorption efficiency from the retroorbital vein and in time from injection to acquisition start.
FIGURE 6.
Scatterplot of injected mass dose vs. mean SUV(WB).
Use of 11C-UCB-J PET to Assess Synaptic Density and Synapse-Restoring Treatments
To our knowledge, this is the first report demonstrating the in vivo detection of a synaptic deficit in an AD mouse model. 11C-UCB-J PET showed hippocampal synaptic density to be lower in APP/PS1 mice than in WT mice. This result is consistent with our recent human AD study with 11C-UCB-J. More significantly, this deficit was normalized by treatment with saracatinib, and the benefit of treatment might persist after drug discontinuation, consistent with previous reports (9,10). Treatment-induced increases of the in vivo SV2A data reflect SV2A in new synapses, but the increases could also be caused by higher SV2A density in existing synapses. This possibility suggests that the in vivo data show a combination of treatment-induced increase in synapse number or improvement in synaptic function. These results support the use of 11C-UCB-J PET not only to identify disease-specific synaptic deficits but also to monitor treatment effects in AD. A clinical trial with a treatment for AD is ongoing at our institution (NCT03493282). This study will use 11C-UCB-J to detect and monitor synaptic density changes in the human brain in response to treatment. Such trials will also be strengthened by the use of 18F-labeled SV2A tracers (21,22).
CONCLUSION
Longitudinal 11C-UCB-J PET in an AD mouse model showed lower SV2A in the hippocampus and increases in SV2A after treatment with saracatinib. These in vivo findings replicated previous ex vivo data and demonstrate the utility of 11C-UCB-J PET as a promising diagnostic tool and biomarker for monitoring AD treatment effects.
DISCLOSURE
Takuya Toyonaga was supported by the 2016–2018 Wagner–Torizuka fellowship from SNMMI, and Sjoerd J. Finnema was supported by an international postdoctoral grant from the Swedish Research Council. This study was also supported by the National Institutes of Health (grants R01AG034924, P50AG047270, U01AG058608, and 1S10OD010322-01) and the National Center for Advancing Translational Science, a component of the NIH (CTSA grant UL1 TR000142). No other potential conflict of interest relevant to this article was reported.
Acknowledgments
We thank the staff of the Yale PET Center for expert assistance. We also thank UCB Pharma for providing the radiolabeling precursor and reference standard.
KEY POINTS
QUESTION: Can we use in vivo 11C-UCB-J PET targeting of SV2A to document dynamic changes in synaptic density with AD treatment?
PERTINENT FINDINGS: Longitudinal 11C-UCB-J PET showed significantly lower hippocampal SUVR(WB) in APP/PS1 mice than in WT mice at baseline (APP/PS1: 1.11 ± 0.04, WT: 1.15 ± 0.02, P = 0.033, unpaired 2-tailed t test) and significant increases in hippocampal SUVR(WB) after AD treatment with saracatinib (treatment: 1.14 ± 0.04, P = 0.037, paired 2-tailed t test).
IMPLICATIONS FOR PATIENT CARE: These in vivo findings demonstrate the utility of 11C-UCB-J PET as a promising diagnostic tool and biomarker for monitoring AD treatment effects.
REFERENCES
- 1.Cummings JL, Morstorf T, Zhong K. Alzheimer’s disease drug-development pipeline: few candidates, frequent failures. Alzheimers Res Ther. 2014;6:37. [DOI] [PMC free article] [PubMed] [Google Scholar]
- 2.Finnema SJ, Nabulsi NB, Eid T, et al. Imaging synaptic density in the living human brain. Sci Transl Med. 2016;8:348ra96. [DOI] [PubMed] [Google Scholar]
- 3.Chen MK, Mecca AP, Naganawa M, et al. Assessing synaptic density in Alzheimer disease with synaptic vesicle glycoprotein 2A positron emission tomographic imaging. JAMA Neurol. 2018;75:1215–1224. [DOI] [PMC free article] [PubMed] [Google Scholar]
- 4.Larson M, Sherman MA, Amar F, et al. The complex PrPc-Fyn couples human oligomeric Aβ with pathological tau changes in Alzheimer’s disease. J Neurosci. 2012;32:16857–16871. [DOI] [PMC free article] [PubMed] [Google Scholar]
- 5.Laurén J, Gimbel DA, Nygaard HB, Gilbert JW, Strittmatter SM. Cellular prion protein mediates impairment of synaptic plasticity by amyloid-β oligomers. Nature. 2009;457:1128–1132. [DOI] [PMC free article] [PubMed] [Google Scholar]
- 6.Um JW, Nygaard HB, Heiss JK, et al. Alzheimer amyloid-β oligomer bound to postsynaptic prion protein activates Fyn to impair neurons. Nat Neurosci. 2012;15:1227–1235. [DOI] [PMC free article] [PubMed] [Google Scholar]
- 7.Ittner LM, Ke YD, Delerue F, et al. Dendritic function of tau mediates amyloid-β toxicity in Alzheimer’s disease mouse models. Cell. 2010;142:387–397. [DOI] [PubMed] [Google Scholar]
- 8.Salter MW, Kalia LV. Src kinases: a hub for NMDA receptor regulation. Nat Rev Neurosci. 2004;5:317–328. [DOI] [PubMed] [Google Scholar]
- 9.Kaufman AC, Salazar SV, Haas LT, et al. Fyn inhibition rescues established memory and synapse loss in Alzheimer mice. Ann Neurol. 2015;77:953–971. [DOI] [PMC free article] [PubMed] [Google Scholar]
- 10.Smith LM, Zhu R, Strittmatter SM. Disease-modifying benefit of Fyn blockade persists after washout in mouse Alzheimer’s model. Neuropharmacology. 2018;130:54–61. [DOI] [PMC free article] [PubMed] [Google Scholar]
- 11.Jankowsky JL, Fadale DJ, Anderson J, et al. Mutant presenilins specifically elevate the levels of the 42 residue β-amyloid peptide in vivo: evidence for augmentation of a 42-specific γ secretase. Hum Mol Genet. 2004;13:159–170. [DOI] [PubMed] [Google Scholar]
- 12.Jankowsky JL, Fadale DJ, Anderson J, et al. Mutant presenilins specifically elevate the levels of the 42 residue β-amyloid peptide in vivo: evidence for augmentation of a 42-specific gamma secretase. Hum Mol Genet. 2004;13:159–170. [DOI] [PubMed] [Google Scholar]
- 13.Gimbel DA, Nygaard HB, Coffey EE, et al. Memory impairment in transgenic Alzheimer mice requires cellular prion protein. J Neurosci. 2010;30:6367–6374. [DOI] [PMC free article] [PubMed] [Google Scholar]
- 14.Lammertsma AA, Hume SP. Simplified reference tissue model for PET receptor studies. Neuroimage. 1996;4:153–158. [DOI] [PubMed] [Google Scholar]
- 15.Ma Y, Hof PR, Grant SC, et al. A three-dimensional digital atlas database of the adult C57BL/6J mouse brain by magnetic resonance microscopy. Neuroscience. 2005;135:1203–1215. [DOI] [PubMed] [Google Scholar]
- 16.Mirrione MM, Schiffer WK, Fowler JS, Alexoff DL, Dewey SL, Tsirka SE. A novel approach for imaging brain-behavior relationships in mice reveals unexpected metabolic patterns during seizures in the absence of tissue plasminogen activator. Neuroimage. 2007;38:34–42. [DOI] [PMC free article] [PubMed] [Google Scholar]
- 17.Finnema SJ, Nabulsi NB, Mercier J, et al. Kinetic evaluation and test-retest reproducibility of [11C]UCB-J, a novel radioligand for positron emission tomography imaging of synaptic vesicle glycoprotein 2A in humans. J Cereb Blood Flow Metab. 2018;38:2041–2052. [DOI] [PMC free article] [PubMed] [Google Scholar]
- 18.Nabulsi NB, Mercier J, Holden D, et al. Synthesis and preclinical evaluation of 11C-UCB-J as a PET tracer for imaging the synaptic vesicle glycoprotein 2A in the brain. J Nucl Med. 2016;57:777–784. [DOI] [PubMed] [Google Scholar]
- 19.Nanni C, Pettinato C, Ambrosini V, et al. Retro-orbital injection is an effective route for radiopharmaceutical administration in mice during small-animal PET studies. Nucl Med Commun. 2007;28:547–553. [DOI] [PubMed] [Google Scholar]
- 20.Gunther EC, Smith LM, Kostylev MA, et al. Rescue of transgenic Alzheimer’s pathophysiology by polymeric cellular prion protein antagonists. Cell Reports. 2019;26:1368. [DOI] [PMC free article] [PubMed] [Google Scholar]
- 21.Cai Z, Li S, Matuskey D, Nabulsi N, Huang Y. PET imaging of synaptic density: a new tool for investigation of neuropsychiatric diseases. Neurosci Lett. 2019;691:44–50. [DOI] [PMC free article] [PubMed] [Google Scholar]
- 22.Li S, Cai Z, Wu X, et al. Synthesis and in vivo evaluation of a novel PET radiotracer for imaging of synaptic vesicle glycoprotein 2A (SV2A) in nonhuman primates. ACS Chem Neurosci. 2019;10:1544–1554. [DOI] [PMC free article] [PubMed] [Google Scholar]


