Abstract
Background:
Whole organ, noninvasive techniques for the detection and quantification of non-alcoholic fatty liver disease features have clinical and research applications. However, the effect of time of day, hydration status, and meals are unknown factors with potential to impact bias, precision, reproducibility, and repeatability of chemical shift encoded MRI (CSE-MRI) to quantify liver proton density fat fraction (PDFF).
Purpose:
To assess the effect of diurnal variation on PDFF using CSE-MRI, including the effect of time of day, the effect of meals and hydration status, as well as the day to day variability.
Study Type:
Prospective.
Subjects:
11 healthy subjects and 9 patients with observed hepatic steatosis.
Field Strength/Sequences:
A commercial quantitative confounder-corrected CSE-MRI sequence (IDEAL IQ) and a MR spectroscopy (MRS) sequence (multi-echo STEAM) were acquired at 1.5T.
Assessment:
MRI-PDFF and MRS-PDFF estimates were compared across six visits (before and after a controlled breakfast, before and after an uncontrolled lunch, at approximately 4PM, and then before breakfast on the following day) with three repeated measures for a total of 360 MRI-PDFF and MRS-PDFF measurements.
Statistical Tests:
Linear regression, Bland-Altman analysis, and mixed effect models were used to determine the bias, precision, and repeatability of PDFF measurements.
Results:
No statistically significant linear trend was observed across visits for either MRI-PDFF or MRS-PDFF (p-values=0.31 and 0.37, respectively). The repeatability was measured to be 0.86% for MRI-PDFF and 1.1% for MRS-PDFF over all six visits. For MRI-PDFF, the variability between all six visits (0.94%) was only slightly higher than within each visit (0.66%) with a p-value<0.001. For MRS-PDFF, the variability between all six visits was 1.29% compared to 0.87% within each visit (p-value<0.001).
Data Conclusion:
Our results may indicate that it is not necessary to control for the time of day or the fasting/fed state of the patient when measuring PDFF using CSE-MRI.
Keywords: Magnetic resonance imaging, chemical shift encoded MRI, proton density fat fraction, hepatic steatosis, diurnal variation, repeatability, reproducibility
INTRODUCTION
Non-alcoholic fatty liver disease (NAFLD) is the most common cause of chronic liver disease in the United States and the Western world (1). The earliest and hallmark feature of NAFLD is hepatic steatosis (2,3), which is the intracellular accumulation of triglycerides in the liver. In approximately 20% of patients with NAFLD, hepatic steatosis progresses to hepatocyte injury, inflammation and fibrosis (4), ie: nonalcoholic steatohepatitis (NASH). If left untreated, NASH can progress to end stage fibrosis (cirrhosis) and eventually liver failure and even hepatocellular carcinoma (5). Subsequently, NAFLD/NASH is expected to become the leading indication for liver transplantation in the Western world over the next decade (6). Currently, the most common procedure for the detection and grading of NAFLD is non-targeted liver biopsy (7,8). However, biopsy is limited by its invasive nature, cost, and perhaps most importantly, high variability due to the heterogeneous nature of diffuse liver disease on a microscopic level (9). For these reasons, development of whole organ, noninvasive techniques for the detection and staging of NAFLD disease features are of tremendous clinical and research interest, including drug discovery.
Over the last decade, emerging quantitative MRI biomarkers of hepatic steatosis such as proton density fat fraction (PDFF), have been developed, measured using confounder-corrected chemical shift encoded MRI (CSE-MRI). There has been a tremendous amount of work evaluating the bias, precision, reproducibility, and repeatability of CSE-MRI to quantify PDFF in the liver (10–16)(10–16). Despite this work there is a relative paucity of data investigating the variation of liver PDFF during the day, between days, as well as variation in liver PDFF resulting from hydration status and meals. It is well-known that portal blood flow as well as hydration status of patients can change dramatically during the day (17). For these reasons, it can be expected that fat or water content of the liver and therefore, liver PDFF may vary as a result. It is also possible that meals, particularly those containing fructose or fat, may lead to immediate changes or variations in liver fat content. Therefore, it is unknown whether the time of day and the effect of hydration and meals can impact the bias, precision, reproducibility, and repeatability of PDFF measurements made using CSE-MRI. For these reasons, the purpose of this work was to assess the effect of diurnal variation on PDFF quantification using CSE-MRI, including the effects of time of day, hydration, meals, and day to day variability.
MATERIALS AND METHODS
Research Subjects
This was a prospective HIPPA compliant study performed after obtaining approval from our local Institutional Review Board (IRB). Healthy adult volunteers and patients with known hepatic steatosis were recruited prospectively after obtaining informed consent. Healthy subjects were recruited from an IRB-approved database of research volunteers. Clinical patients who had undergone abdominal MRI for other reasons, but with incidentally observed hepatic steatosis on clinical liver MRI exams were also prospectively recruited. Patients with a known diagnosis of diffuse liver disease (including NAFLD/NASH), hepatitis, cirrhosis and/or liver malignancy were excluded from this study.
Study Design
Subjects were asked to come for a total of 6 identical MRI visits as outlined in Figure 1. The subjects arrived on the morning of Day 1 for the first MRI procedure at Visit 1, after fasting for at least 12 hours. This was followed by a controlled breakfast that consisted of two granola bars (Kind, New York, NY), 16 ounces of 2% milk, and 16 ounces of water. The subject was given 30 minutes to consume and digest breakfast, followed by the identical MRI procedure (Visit 2). Subjects were instructed to fast after the controlled breakfast and to return before lunch. Visit 3 commenced at noon and was followed by lunch at the hospital cafeteria. Subjects were asked to drink 16 ounces of water and were provided with a $10 food voucher for lunch of their own choosing. Subjects returned 30 minutes after lunch for imaging at Visit 4 at approximately 1pm. Next, the subjects were asked to return at approximately 4 PM for Visit 5 and were asked to avoid drinking or snacks during this interval. Finally, subjects were asked to return the following morning for Visit 6, approximately 24 hours after Visit 1 and after at least 12 hours of fasting and under conditions identical to Visit 1.
Figure 1:
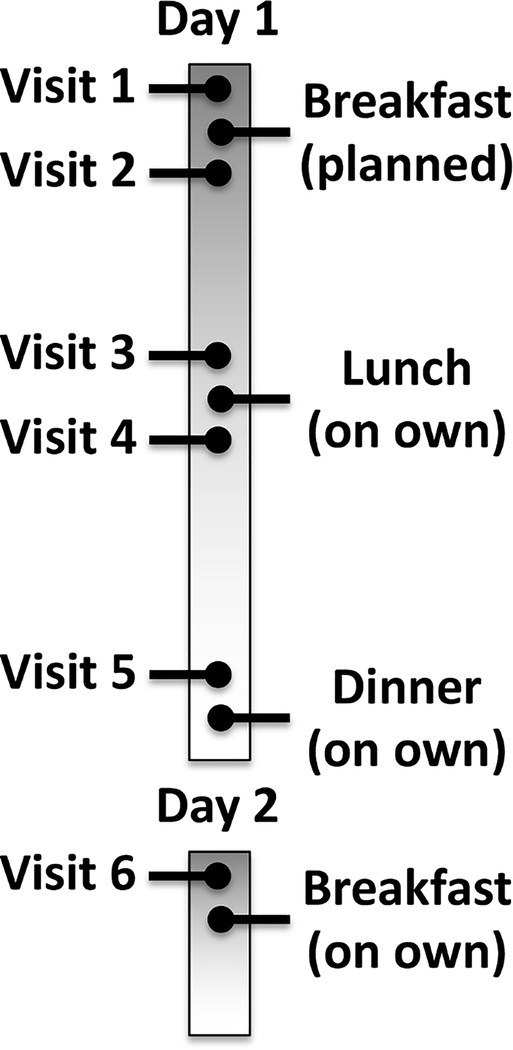
Schema for visit schedule over two days.
For each of the 6 visits, subjects were scanned on a 1.5T clinical MRI system (HDxt, GE Healthcare, Waukesha, WI) using an 8-channel torso coil (USA Instruments, Cleveland, OH). The clinical protocol included a commercial quantitative confounder-corrected CSE-MRI method (IDEAL IQ, GE Healthcare, Waukesha, WI) and a single voxel multi-echo STimulated Echo Acquisition Mode (STEAM)(18). The multi-echo STEAM voxel was placed in the right lobe of the liver avoiding large vessels, bile ducts, liver lesions and the dome of the liver. The multi-echo STEAM voxel was not co-localized between repeated scans since the patient moved between scans but the voxel was placed in the same region of the liver while avoiding any anatomical features seen in the repeated localizer. Specific acquisition parameters for both CSE-MRI and multi-echo MRS are provided in Table 1.
Table 1:
Imaging acquisition parameters for CSE-MRI and MRS
| CSE-MRI | MRS | |
|---|---|---|
| FOV (LR × AP × SI) [cm] | 40 × 36 × 25.6 | 3 × 3 × 3 |
| Acquisition matrix | 256 × 160 × 32 | NA |
| Resolution (mm) | 1.6 × 2.5 × 8 | NA |
| Flip angle | 5 | 90, 90, 90 |
| Receiver BW (±kHz) | 125 | 5 |
| Echo Times (ms) | 1.2, 3.3, 5.4,7.4, 9.5 11.5 | 10,15,20,25,30 |
| Mixing Time (ms) | NA | 5 |
| TR (ms) | 15.5 | 3500 |
| Parallel Imaging Acceleration Factors | 2 × 2 | NA |
| Imaging Time (s) | 21 | 18 |
The entire imaging procedure including localizers, CSE-MRI, and MRS was performed three times for each of the 6 visits, in order to assess intra-visit repeatability of PDFF measurements made using CSE-MRI and MRS. Between each of the three repeated acquisition, the subject was removed from the bore of the scanner and the anterior element of the coil was removed. The patient was asked to sit up and lie back down before repositioning the surface coil, followed by repeated localizers, CSE-MRI and MRS acquisitions.
Data Reconstruction and Analysis
For CSE-MRI, PDFF maps were reconstructed automatically on the scanner. Reconstruction includes correction for multiple confounding factors including T2* decay (19,20), multi-peak spectral modeling (19), noise bias (21), and the effects of eddy currents (22). Further, a low flip angle relative to the acquisition TR was used to minimize T1 bias (21). For MRS, T2-correction was performed by fitting the signal to a monoexponential decay. T1 bias was avoided by using a long TR in the acquisition as shown in Table 1.
CSE-MRI PDFF maps were analyzed using a standardized procedure described by Campo et al (23), where a regions of interest (ROI) was placed in each of the nine Couinaud segments. The largest elliptical ROI that would fit in each of the segments (with minimu area of 2 cm2) was chosen while avoiding large vessels and bile ducts. This strategy has been demonstrated to reduce both the intra-and inter-reader variability (23). The average of the nine liver ROI measurements was averaged together to provide a single MRI-PDFF estimate for each CSE-MRI acquisition.
MRS acquisitions were analyzed through a fully automated processing of the multi-echo STEAM sequence (24). Voigt line shapes were used to fit the water peak and six fat peaks and T2 decay was included to model the spectra at multiple echo times. The fat peaks were allowed to shift in relation to the water peak but the separation between fat peaks was kept constant. Relative amplitudes of the smaller fat peaks were also allowed to change within ±1% relative to the total fat signal. A non-linear least squares fitting was then used to estimate the minimum error fit.
Statistical Analysis
A linear mixed effect model was used to determine if a linear trend across time was observed in either MRI-PDFF or MRS-PDFF. The visit time, in hours since the first visit, and the subject’s initial PDFF were fixed effects and the intercept and visit times varied by subject. The change across time (in percent PDFF per hour) and its p-value was used to determine if a statistically significant linear change in PDFF occurred across time.
Linear regression and Bland-Altman analyses were used to compare the linearity and bias between MRS- and MRI-PDFF. The PDFF measurements, averaged over the three repeated measures, of MRI-PDFF was compared to MRS-PDFF for the 20 subjects and 6 visits (n=120).
The repeatability of the two techniques was assessed using a repeatability coefficient between the repeated scans (25). For a given technique, the repeatability coefficient was calculated as the 95% confidence interval of the difference between all 360 measurements (over 3 repeated scans, 6 visits, and 20 patients) and the corresponding per-visit average (averaged over the three repeated measures). This coefficient corresponds to the smallest measurable difference of each technique or the smallest measurement change that can be interpreted as a real difference (25).
An analysis was also performed to determine whether the variation across visits was statistically different from the within-visit variation (across the three repeated scans) for both MRS and MRI-PDFF. A random effects model was used, with the subject as a random effect and the visit as a fixed effect, to account for the within-subject correlation between the measurements. This is equivalent to a random effect (repeated measure) ANOVA test on the variation between visits. All statistical analyses were performed using R version 3.3.2 (R Core Team, 2014, R Foundation for Statistical Computing, Vienna, Austria; available at: http://www.R-project.org/)
RESULTS
Research Subjects
A total of 20 subjects were recruited for this study, 11 healthy subjects were recruited using an IRB-approved database and nine patients were recruited from the local radiology clinic. Thirteen women and seven men with an average age of 46 (range = 22 – 66) were recruited. Supplementary Table 1 lists the 20 subjects, including age, sex, BMI, and any diagnoses related to the clinical MRI exam.
MRI and MRS Results
A wide range of PDFF values was observed (0.5–32.3%), with an average PDFF value of 11.4%. An example PDFF map for a central liver slice of over all six visits for one of the subjects is shown in Figure 2. Note the expansion of the stomach before and after meals demonstrating the presence or lack of food within the stomach.
Figure 2:
Representative fat fraction images from all six visits for one patient. The arrow highlights the expansion and contraction of the stomach depending on the timing of meals.
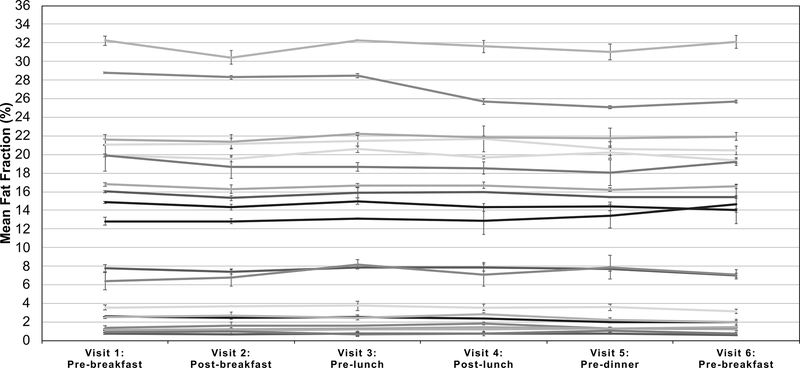
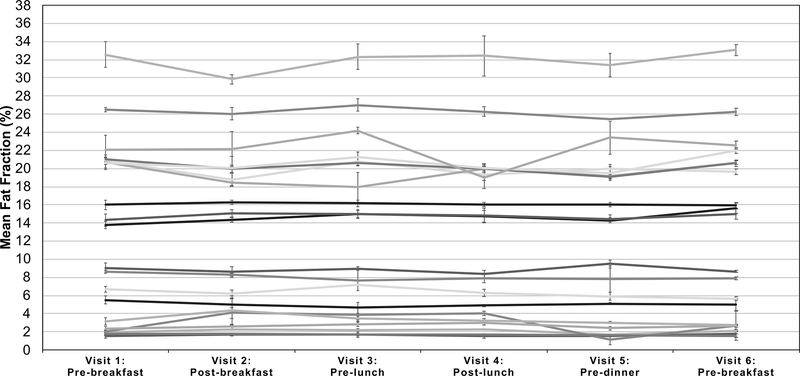
Figure 3 plots the MRI-PDFF measurements (averaged over the three repeated scans) for each of the six visits and all twenty subjects, where error bars represent the standard deviation of the value over the repeated scans. Similarly, Figure 4 plots the average MRS-PDFF value over each of the three repeated measurements, for each of the six visits for all twenty subjects. The linear mixed effect model predicted the rate of change of PDFF to be −0.008% per hour for MRI-PDFF and 0.009% per hour for MRS-PDFF but neither were statistically significant (p-values of 0.31 and 0.37, respectively).
Figure 3:
Minimal variation in the measured MRI-PDFF was observed throughout the six visits and had no obvious diurnal trends. The average across all Couinaud segments and repeated scans is shown for each time point spanning the two days and 20 subjects with each curve representing a different subject. Error bars represent the standard deviation of the measured fat fraction across the three repeated measurements at each visit.
Figure 4:
Measured MRS-PDFF throughout the six visits that had no obvious diurnal trends. The average across all Couinaud segments and repeated scans is shown for each time point spanning the two days and 20 subjects. Error bars represent the standard deviation of the measured fat fraction across the three repeated measurements at each visit.
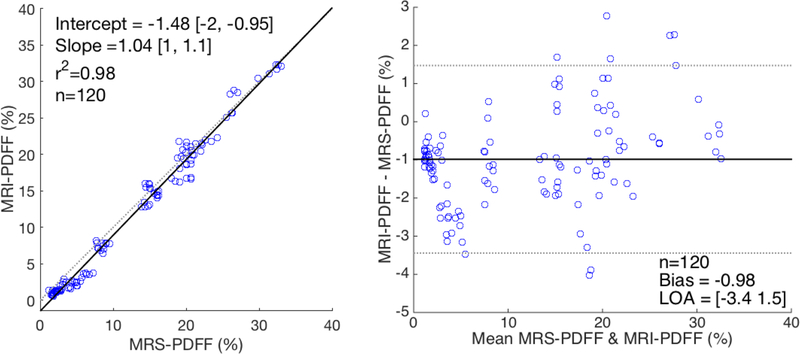
A comparison of the estimates from MRI-PDFF to MRS-PDFF are shown in Figure 5. The linearity between MRI-PDFF and MRS-PDFF and a Bland-Altman analysis are shown for all six visits and 20 subjects, where each measurement was averaged over the three repeated measures for both techniques. There was good agreement between MRI-PDFF and MRS-PDFF with only a small bias observed between the two techniques and a linear correlation coefficient of 0.99.
Figure 5:
Good agreement was seen between MRI-PDFF and MRS-PDFF. The linearity (left) and a Bland-Altman analysis (right) is shown for MRI-PDFF vs MRS-PDFF over all six visits and 20 subjects. Each data point represents the mean value (averaged over three repeated measures) for both techniques.
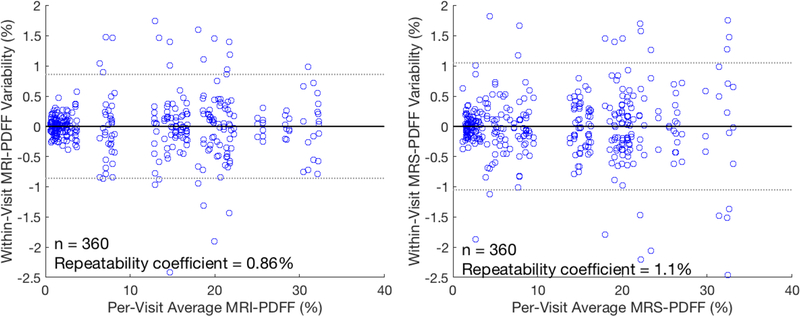
Repeatability coefficients for MRI-PDFF and MRS-PDFF are shown in Figure 6. A repeatability coefficient of roughly 1% PDFF over the 360 measurements was seen in both techniques.
Figure 6:
Repeatability coefficients of about 1–1.15% were seen for both MRI-PDFF and MRS-PDFF. The within-visit differences from the per-visit average PDFF (averaged over three repeated measurements) are shown as a function of the per-visit average for both MRI-PDFF (left) and MRS-PDFF (right).
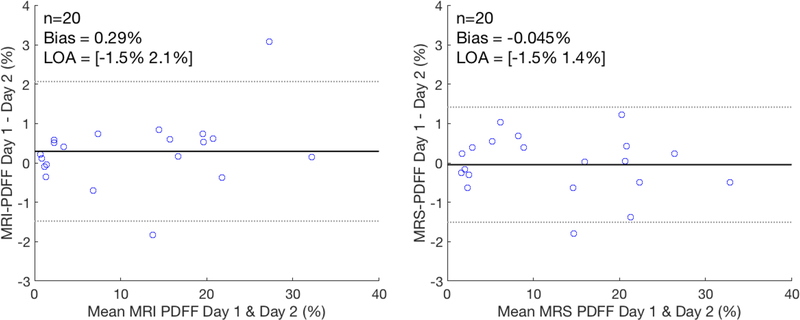
A Bland-Altman analysis of the two morning fasting visits, i.e. Visit 1 versus Visit 6, for both CSE-MRI and MRS-PDFF is shown in Figure 7. The day to day measurements demonstrated a small bias in both techniques but the limits of agreement were approximately 1.5% PDFF for both MRI-PDFF and MRS-PDFF.
Figure 7:
Bland-Altman analysis comparing the day to day repeatability of MRI-PDFF and MRS-PDFF demonstrates a small bias but limits of agreement around 1.5% PDFF. Each data point represents the MRI-PDFF and MRS-PDFF measurement averaged over the three repeated measures.
The variability for both MRI-PDFF and MRS-PDFF is summarized in Table 2. Over all 6 visits there was more variation and a higher standard deviation seen throughout the day(s) than seen within the visits for both MRI-PDFF and MRS-PDFF. Testing for equivalence of the overall per-visit and within-visit variation was highly significant (p-value < 0.001) for both MRI-PDFF and MRS-PDFF. This demonstrates that the within-visit variation is statistically different than the variation across visits. Similarly, a higher variability was seen before and after breakfast (Visit 1 vs Visit 2), before and after lunch (Visit 3 vs Visit 4), at the beginning of the Day 1 vs the end of Day 1 (Visit 1 vs Visit 5), and at beginning of Day 1 vs the beginning of Day 2 (Visit 1 vs Visit 6) than within each of the repeated measurements. However, all variations seen were small in scale and less than 1–1.5% PDFF for both techniques.
Table 2:
Within-visit and per-visit standard deviations of MRI-PDFF and MRS-PDFF with statistically significance (p < 0.05) indicated in bold
| Visits Compared | MRI-PDFF (%) | MRS-PDFF (%) | ||||
|---|---|---|---|---|---|---|
| Within-visit | Per-visit | p-value | Within-visit | Per-visit | p-value | |
| Overall | 0.66 | 0.94 | <0.001 | 0.87 | 1.29 | <0.001 |
| 1 vs 2(Breakfast) | 0.53 | 0.70 | 0.01 | 0.87 | 1.40 | 0.09 |
| 3 vs 4(Lunch) | 0.58 | 0.91 | 0.006 | 0.93 | 1.66 | 0.012 |
| 1 vs 5(Day 1) | 0.69 | 1.14 | 0.019 | 0.65 | 0.89 | 0.705 |
| 1 vs 6(Day 1 vs 2) | 0.77 | 1.31 | 0.018 | 0.71 | 1.07 | 0.001 |
DISCUSSION
In this work we have performed a prospective analysis in healthy subjects and subjects with documented hepatic steatosis to assess the effects of diurnal variation, i.e. time of day, and the effects of meals and hydration, on liver PDFF measurements made with CSE-MRI. The effects of measuring PDFF between two different days and the variability between repeated measurements (i.e. repeatability) was also analyzed. Our results demonstrate that there is no discernable bias as a result of meals or time of day. Specific degrees of variability introduced by time of day, between meals, and between day were also assessed. The observed variability are very similar in magnitude compared to past studies that have assessed PDFF repeatability (10,12,14–16).
Our comparison of MRI-PDFF to MRS-PDFF was also similar to past studies (10,15) with strong correlation between the two methods and only a small bias observed. In addition, we note that, as has been seen previously (10), PDFF as measured by CSE-MRI has consistently lower variability than MRS (i.e. higher precision than MRS). This is likely related to the fact that repeated placement of a single MRS voxel leads to intrinsic variability. CSE-MRI is able to quantify liver fat over the entire liver whereas MRS interrogates a relatively small portion of the liver, introducing potential sampling variability with repeated measurements.
Even though no discernable bias was measured, the variability of both techniques depended on fasting vs fed state and/or the time of day. The variability between all visits, before and after meals, and day to day were higher than the measured within-exam variability (with statistical significance p<0.05) for both MRI-PDFF and MRS-PDFF. However, all variations were very small (on the order of 1–1.5% absolute PDFF) and are comparable to previous studies (15,16). Further, the repeatability (assessed using a repeatability coefficient) was measured to be 0.86% for MRI-PDFF and 1.1% for MRS-PDFF over all six visits, which was smaller than previous studies, including a recent meta-analysis (15) that reported a repeatability coefficient of 3% for MRI-PDFF, although measured over a smaller patient population.
There are several limitations of this study. The number of subjects used in this study (n=20) seems relatively modest, although the overall number of independent CSE-MRI and MRS acquisitions was very high (n=360), which provided sufficient data to assess the variability with statistical significance. Further, this study has a relatively good range of clinically relevant PDFF values, ranging from relatively low liver fat content to relatively severe liver fat content. The overall range is very similar to that documented by Yokoo et al (15) in a meta-analysis (n=1679) demonstrating a very similar distribution of PDFF values compared to prior studies.
In addition, the clinical patients recruited for this study, although they had no known history of diffuse liver disease, were not assessed thoroughly including biopsy to document a definite diagnosis of NAFLD. Although it is unclear that the etiology of hepatic steatosis would have been contributory, more controlled documentation with biopsy proven NAFLD should be considered a limitation of this study.
Further, additional imaging into the evening, including a visit after dinner, may also have been contributory by providing a more rigorous evaluation of diurnal variation. However, for logistical purposes, including a limitation of resources, performing MRI visits in the evening was not feasible at our institution. However, the data suggest that additional time points may not have been contributory since our results already demonstrated only small variations due to the meals, throughout the day, and between days. Finally, the midday meal was not controlled, leading to an additional source of potential variability in the results, although this effect, if any is thought to be very small given that only very small differences were seen between the controlled meal (breakfast) and uncontrolled meal (lunch). Further, the small differences suggest that whether the meal was controlled or uncontrolled did not affect the variability. The number of subjects also led to the limitation that correlation with the type of food ingested with changes in PDFF was not possible.
In conclusion, in this work we have investigated the effects of meal, hydration, repeated test variability, and between day variability using both CSE-MRI and MRS to measure liver PDFF. Only small changes in PDFF variability was detected but no significant temporal bias was observed in either healthy subjects or patients with hepatic steatosis. These data indicate that it is not necessary to control for the time of day or the fasting/fed state when measuring PDFF using either CSE-MRI or MRS in patients with suspected hepatic steatosis. Further, these data confirm the superior precision of CSE-MRI to quantify PDFF, compared to MRS.
Supplementary Material
Table S1: Subject information including any preceding clinical exam
ACKNOWLEDGEMENTS
The authors wish to thank Gavin Hamilton, PhD, for his assistance in providing the multi-echo MRS STEAM pulse sequence. Further, we wish to thank the Departments of Radiology and Medical Physics at the University of Wisconsin who supported this project. The authors also wish to acknowledge support from GE Healthcare who provides research support to the University of Wisconsin. Samir Sharma contributed to this work while employed by UW-Madison but is now an employee of Canon Medical Research USA.
The authors also wish to acknowledge support from the NIH (R01 DK100651, K24 DK102595, R01 DK083380, T32 CA009206).
REFERENCES
- 1.Byrne CD. Dorothy Hodgkin Lecture 2012: non-alcoholic fatty liver disease, insulin resistance and ectopic fat: a new problem in diabetes management. Diabet Med 2012;29:1098–107 doi: 10.1111/j.1464-5491.2012.03732.x. [DOI] [PubMed] [Google Scholar]
- 2.Matteoni CA, Younossi ZM, Gramlich T, Boparai N, Liu YC, McCullough AJ. Nonalcoholic fatty liver disease: a spectrum of clinical and pathological severity. Gastroenterology 1999;116:1413–9. [DOI] [PubMed] [Google Scholar]
- 3.Gramlich T, Kleiner DE, McCullough AJ, Matteoni CA, Boparai N, Younossi ZM. Pathologic features associated with fibrosis in nonalcoholic fatty liver disease. Hum Pathol 2004;35:196–9. [DOI] [PubMed] [Google Scholar]
- 4.Spengler EK, Loomba R. Recommendations for Diagnosis, Referral for Liver Biopsy, and Treatment of Nonalcoholic Fatty Liver Disease and Nonalcoholic Steatohepatitis. Mayo Clin. Proc 2015;90:1233–1246 doi: 10.1016/j.mayocp.2015.06.013. [DOI] [PMC free article] [PubMed] [Google Scholar]
- 5.Younossi Z, Stepanova M, Ong JP, et al. Nonalcoholic Steatohepatitis Is the Fastest Growing Cause of Hepatocellular Carcinoma in Liver Transplant Candidates. Clin. Gastroenterol. Hepatol 2018. doi: 10.1016/j.cgh.2018.05.057. [DOI] [PubMed] [Google Scholar]
- 6.Charlton MR, Burns JM, Pedersen RA, Watt KD, Heimbach JK, Dierkhising RA. Frequency and Outcomes of Liver Transplantation for Nonalcoholic Steatohepatitis in the United States. Gastroenterology 2011;141:1249–1253 doi: 10.1053/j.gastro.2011.06.061. [DOI] [PubMed] [Google Scholar]
- 7.Kleiner DE, Brunt EM, Natta MV, et al. Design and validation of a histological scoring system for nonalcoholic fatty liver disease. Hepatology 2005;41:1313–1321 doi: 10.1002/hep.20701. [DOI] [PubMed] [Google Scholar]
- 8.Brunt EM, Janney CG, Di Bisceglie AM, Neuschwander-Tetri BA, Bacon BR. Nonalcoholic steatohepatitis: a proposal for grading and staging the histological lesions. Am. J. Gastroenterol 1999;94:2467–2474 doi: 10.1111/j.1572-0241.1999.01377.x. [DOI] [PubMed] [Google Scholar]
- 9.Ratziu V, Charlotte F, Heurtier A, et al. Sampling Variability of Liver Biopsy in Nonalcoholic Fatty Liver Disease. Gastroenterology 2005;128:1898–1906 doi: 10.1053/j.gastro.2005.03.084. [DOI] [PubMed] [Google Scholar]
- 10.Hines CD, Frydrychowicz A, Hamilton G, et al. T(1) independent, T(2) (*) corrected chemical shift based fat-water separation with multi-peak fat spectral modeling is an accurate and precise measure of hepatic steatosis. J Magn Reson Imaging 2011;33:873–81 doi: 10.1002/jmri.22514. [DOI] [PMC free article] [PubMed] [Google Scholar]
- 11.Meisamy S, Hines CD, Hamilton G, et al. Quantification of hepatic steatosis with T1-independent, T2-corrected MR imaging with spectral modeling of fat: blinded comparison with MR spectroscopy. Radiology 2011;258:767–75 doi: 10.1148/radiol.10100708. [DOI] [PMC free article] [PubMed] [Google Scholar]
- 12.Mashhood A, Railkar R, Yokoo T, et al. Reproducibility of hepatic fat fraction measurement by magnetic resonance imaging. J. Magn. Reson. Imaging JMRI 2013;37:1359–1370 doi: 10.1002/jmri.23928. [DOI] [PubMed] [Google Scholar]
- 13.Artz NS, Haufe WM, Hooker CA, et al. Reproducibility of MR-based liver fat quantification across field strength: Same-day comparison between 1.5T and 3T in obese subjects. J. Magn. Reson. Imaging 2015;42:811–817 doi: 10.1002/jmri.24842. [DOI] [PMC free article] [PubMed] [Google Scholar]
- 14.Bannas P, Kramer H, Hernando D, et al. Quantitative MR Imaging of Hepatic Steatosis: Validation in Ex Vivo Human Livers. Hepatol. Baltim. Md 2015;62:1444–1455 doi: 10.1002/hep.28012. [DOI] [PMC free article] [PubMed] [Google Scholar]
- 15.Yokoo T, Serai SD, Pirasteh A, et al. Linearity, Bias, and Precision of Hepatic Proton Density Fat Fraction Measurements by Using MR Imaging: A Meta-Analysis. Radiology 2017:170550 doi: 10.1148/radiol.2017170550. [DOI] [PMC free article] [PubMed] [Google Scholar]
- 16.Wu B, Han W, Li Z, et al. Reproducibility of Intra- and Inter-scanner Measurements of Liver Fat Using Complex Confounder-corrected Chemical Shift Encoded MRI at 3.0 Tesla. Sci. Rep 2016;6 doi: 10.1038/srep19339. [DOI] [PMC free article] [PubMed] [Google Scholar]
- 17.Lemmer B, Nold G. Circadian changes in estimated hepatic blood flow in healthy subjects. Br. J. Clin. Pharmacol 1991;32:627–629. [DOI] [PMC free article] [PubMed] [Google Scholar]
- 18.Hamilton G, Yokoo T, Bydder M, et al. In vivo characterization of the liver fat 1H MR spectrum. NMR Biomed. 2011;24 doi: 10.1002/nbm.1622. [DOI] [PMC free article] [PubMed] [Google Scholar]
- 19.Yu H, Shimakawa A, McKenzie CA, Brodsky E, Brittain JH, Reeder SB. Multiecho water-fat separation and simultaneous R2* estimation with multifrequency fat spectrum modeling. Magn Reson Med 2008;60:1122–34 doi: 10.1002/mrm.21737. [DOI] [PMC free article] [PubMed] [Google Scholar]
- 20.Yu H, McKenzie CA, Shimakawa A, et al. Multiecho reconstruction for simultaneous water-fat decomposition and T2* estimation. J Magn Reson Imaging 2007;26:1153–61 doi: 10.1002/jmri.21090. [DOI] [PubMed] [Google Scholar]
- 21.Liu CY, McKenzie CA, Yu H, Brittain JH, Reeder SB. Fat quantification with IDEAL gradient echo imaging: correction of bias from T(1) and noise. Magn Reson Med 2007;58:354–64 doi: 10.1002/mrm.21301. [DOI] [PubMed] [Google Scholar]
- 22.Yu H, Shimakawa A, Hines CD, et al. Combination of complex-based and magnitude-based multiecho water-fat separation for accurate quantification of fat-fraction. Magn Reson Med 2011;66:199–206 doi: 10.1002/mrm.22840. [DOI] [PMC free article] [PubMed] [Google Scholar]
- 23.Campo CA, Hernando D, Schubert T, Bookwalter CA, Pay AJV, Reeder SB. Standardized Approach for ROI-Based Measurements of Proton Density Fat Fraction and R2* in the Liver. AJR Am J Roentgenol 2017;209:592–603 doi: 10.2214/AJR.17.17812. [DOI] [PMC free article] [PubMed] [Google Scholar]
- 24.Hernando D, Artz NS, Hamilton G, Roldan A, Reeder SB. Fully automated processing of multi-echo spectroscopy data for liver fat quantification In: Proceedings of the 22nd Annual Meeting of the International Society of Magnetic Resonance in Medicine. Milan, Italy; 2014. [Google Scholar]
- 25.Beckerman H, Roebroeck ME, Lankhorst GJ, Becher JG, Bezemer PD, Verbeek AL. Smallest real difference, a link between reproducibility and responsiveness. Qual. Life Res. Int. J. Qual. Life Asp. Treat. Care Rehabil 2001;10:571–578. [DOI] [PubMed] [Google Scholar]
Associated Data
This section collects any data citations, data availability statements, or supplementary materials included in this article.
Supplementary Materials
Table S1: Subject information including any preceding clinical exam


