Abstract
Tendon injuries cause prolonged disability and never recover completely. Current mechanistic understanding of tendon regeneration is limited. Here we use single cell transcriptomics to identify a tubulin polymerization-promoting protein family member 3-expressing (Tppp3+) cell population as potential tendon stem cells. Through inducible lineage tracing, we demonstrated that these cells can generate new tenocytes and self-renew upon injury. A fraction of Tppp3+ cells expresses platelet-derived growth factor receptor alpha (Pdfgra). Ectopic platelet-derived growth factor-AA (PDGF-AA) protein induces new tenocyte production while inactivation of Pdgfra in Tppp3+ cells blocks tendon regeneration. These results support Tppp3+Pdgfra+ cells as tendon stem cells. Unexpectedly, Tppp3−Pdgfra+ fibro-adipogenic progenitors coexist in tendon stem cell niche and give rise to fibrotic cells, revealing a clandestine origin of fibrotic scars in healing tendons. Our results explain why fibrosis occurs in injured tendons and present clinical challenges to enhance tendon regeneration without a concurrent increase in fibrosis by PDGF application.
Tendons are dense connective tissues tethering skeletal muscles to bones that act as force transmission conduits for locomotion1. They bear enormous mechanical load owing to longitudinal alignment of specialized extracellular matrix deposited by tenocytes in the tendon midsubstance. Injuries to tendons represent the worst clinical outcome within the musculoskeletal system, as healed tendons rarely attain the integrity of undamaged state. A culprit for the inferiority of healed tendons is fibrotic scarring that disrupts tendon matrix continuity. As such, re-rupture is common, often necessitating reconstructive surgery and resulting in chronic pain and impaired mobility2,3. Injury models have been developed in rodents to study tendon healing, ranging from complete failure after transection of the Achilles4,5, fibrotic adhesions and scarring of flexor tendons6–10, to robust regeneration after biopsy punch-injury of the Patellar tendon11. Extensive histological data for tendon healing and fibrosis exist2, but the underlying cellular and molecular mechanisms remain elusive.
Tentative tendon stem/progenitors (TSPCs) have been studied in vitro4. Cells dissociated from tendon midsubstance form colonies in specifically formulated media12. These colonies give rise to fat, bone, and tendon-like structures after engraftment together with bone matrix. However, in vivo correspondence of these cells is unknown4, 12, 13. For in vivo stem cell identification, the tamoxifen-inducible Cre-ERT2 mediated lineage tracing14, 15 has gained recognition as a definitive approach. Past attempts to identify adult tendon stem cells by this approach made no firm conclusions thus far. A transgenic αSMA-CreERT2 labeled multiple cell types around Patellar tendon, but they were unlikely stem cells as they did not give rise to tenocytes with longitudinally aligned collagen matrix second harmonic generation (SHG) signals16. On the other hand, tenocytes labeled by the Scleraxis (Scx)-CreERT2 were able to regenerate transected Achilles in neonates but not in adults, indicating that tenocytes have regenerative potential limited to the perinatal period17. In these studies, either the Cre drivers did not mark tendon stem cells or the chosen injury paradigms prevented stem cells to regenerate. To better the odds of uncovering adult tendon stem cells, here we chose to use the regeneration-competent Patellar tendon punch-injury model11, 18, 19. We took a logical approach to characterize cell types in the adult Patellar tendon, followed by making Cre-ERT2 drivers to define Tppp3+ paratenon sheath cells20, 21 as tendon stem cells. By exploiting heterogeneity within the Tppp3+ tendon stem cell population, we determined the cellular and molecular mechanisms that inextricably link tendon stem cell-mediated regeneration and fibrosis via shared usage of PDGF signalling. Tools and results provided here for studying the Patellar tendon regeneration should facilitate future studies in other paratenon sheathed tendons and help inform translational strategies.
Results
Single cell analysis reveals heterogeneous composition in the Patellar tendon
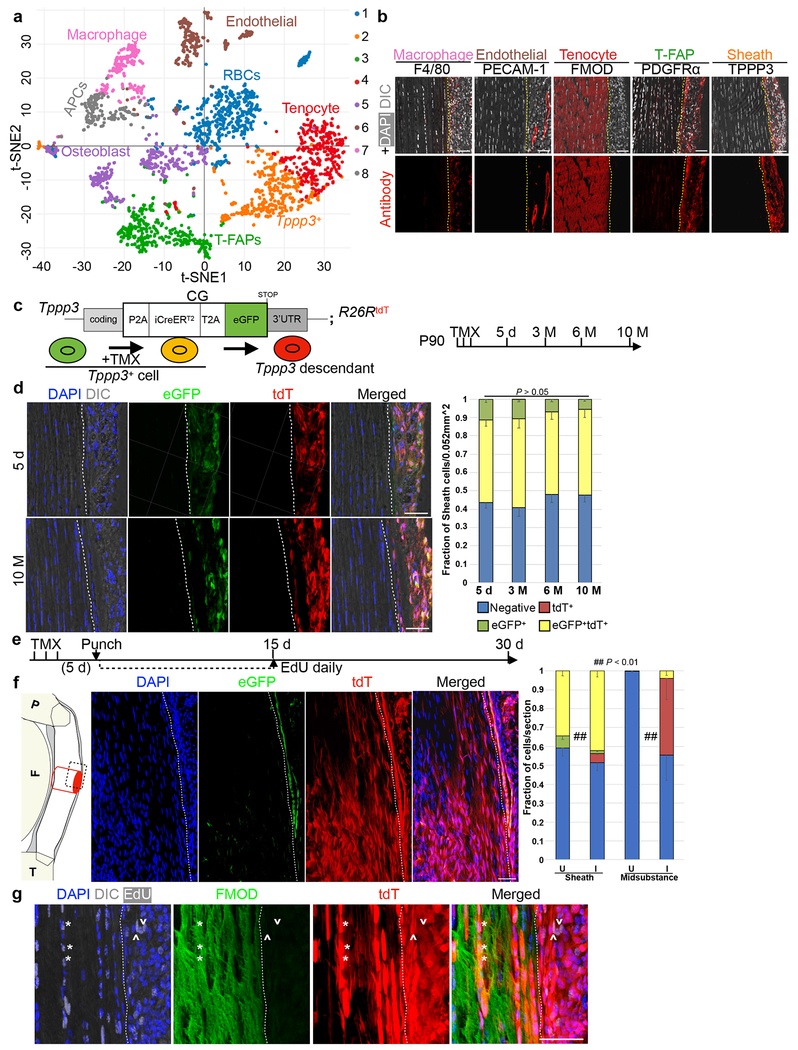
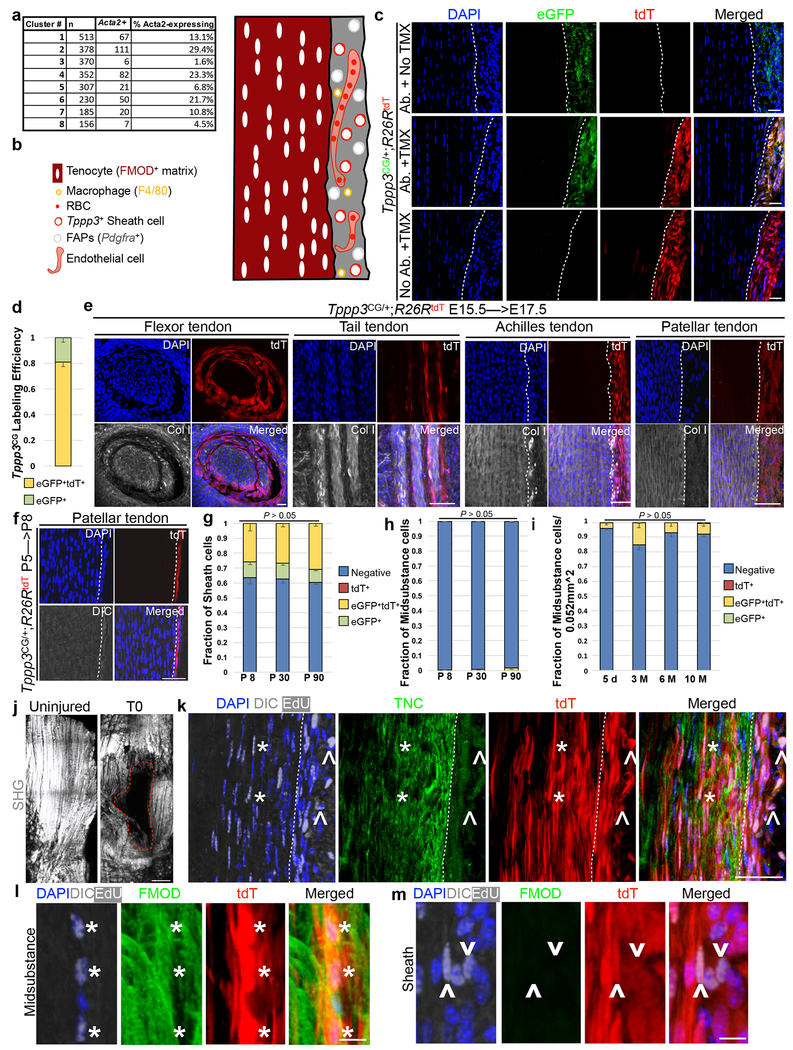
Until now, a lack of a complete molecular cell atlas for adult tendon hampered our ability to identify tendon stem cells. To this end, we categorized the cells present in adult (~ 3 month (M) old) Patellar tendons by single cell RNA-sequencing (scRNA-seq)22. Whole tendons were enzymatically dissociated for scRNA-seq. Of 2491 cells surveyed, 8 cell clusters were delineated by Cell Ranger (Fig. 1a; Supplementary Table 1). By Satija lab’s estimate (see Methods) of our scRNA-seq data, we have uncovered cell types present at 1% in the tendon. These datasets were compared to NCBI deposited datasets and single cell mouse cell atlas for cell type assignment. Clusters 1, 5, 6, 7, and 8 represent red blood cells (RBCs), osteoblasts, endothelial cells, macrophages, and antigen-presenting cells (APCs), respectively. Cluster 3 cells showed corresponding expression (“overlap”) of ~90% of the top 500 genes (GSE89633) expressed by fibro-adipogenic progenitors (FAPs) found in skeletal muscle23, 24; genes encoding positive (e.g. Pdgfra and Ly6a) and negative (e.g. Cd45, Cd31, and Itga7) markers used to define FAPs showed corresponding expression. Thus, we tentatively named them tendon-FAPs (T-FAPs). Cluster 4 cells are tenocytes as they express tendon-specific genes such as Fibromodulin (Fmod; ranked 3 of top 100 genes, P =1.43E-13)12, 25, 26, Tenomodulin (Tnmd; ranked 15 of top 100 genes, P = 5.63E-14) 27, and Thrombospondin 4 (Thbs4; ranked 6 of top 100 genes, P = 5.63E-12)28. Cluster 2 is enriched for Tppp3 (ranked 14 of top 100 genes, P = 1.46E-08) and expresses Lubricin (Prg4), which are reported to be expressed in tendon sheath cells20, 21, 29. The αSMA-lineage was reported to include several cell types around the Patellar tendon16, and indeed Acta2 (encoding αSMA) is expressed in many cell clusters (Extended Data 1a). We performed immunofluorescence for representative markers for these cell clusters. Of the five markers examined, FMOD is in the midsubstance as expected. The others showed different patterns in the sheath, highlighting its complexity (Fig. 1b; Extended Data 1b).
Fig. 1 |. Tendon harbors a self-renewing stem cell population.
a, tSNE plot for 2491 cells. Unsupervised clustering by Cell Ranger: keys to the clustering number to the right and cell type assignments on the plot. b, Immunofluorescence for indicated markers. Dashed lines indicate midsubstance-sheath boundary. c, Diagrams for Tppp3CG driver and experimental regimen: at P90, cells were marked by TMX for 3 d and chased to 5 d, and 3, 6, 10 M. d, Immunofluorescence images at 5 d and 10 M, and quantified cell fractions (keys at bottom); dashed line, midsubstance-sheath boundary; n=3 animals/condition; all ns by Chi-Square test; mean for (Negative, eGFP+, tdT+, and eGFP+tdT+) at specified time as follows: (5 d; 0.436, 0.113, 0, 0.451), (3 M; 0.410, 0.104, 0.0002, 0.104), (6 M; 0.479, 0.070, 0, 0.451), (10 M; 0.479, 0.057, 0, 0.465). e, Schema for tendon regeneration assay: same cell marking regimen as in (c), punch injury 5 d later and chased to 30 d; daily EdU for first 15 d. f, Diagram (left) of Patellar tendon at sagittal plane: P, patella; F, femur; T, tibia; midsubstance in white; sheath in gray; site of punch, red cylinder; imaged area, dashed box. Images in the middle and quantification to the right: U, uninjured; I, injured; examined cell groups same as (d); Chi-square test, ## p < 0.01; n=3 animals/condition; mean for (Negative, eGFP+, tdT+, and eGFP+tdT+) for specified condition as follows: (Sheath U; 0.608, 0, 0.051, 0.341), (Sheath I; 0.513, 0.015, 0.048, 0.424), (Midsubstance U; 1, 0, 0, 0), (Midsubstance I; 0.542, 0, 0.420, 0.038). g, High magnification of FMOD staining of 30 d regenerated tendons: *, proliferated Tppp3-descendant; ^, self-renewed Tppp3 lineage in sheath; 3 independent repeats; also see Extended Data 1k–m. Scale bars = 30 (a), 50 (d, f, g) μm.
Tppp3+ tendon sheath cells are found in the embryo to adulthood
Gene module similarity between the cluster 2 Tppp3+ cells and the cluster 4 tenocytes may be inferred by their proximity on the t-SNE plot. To explore whether a relationship exists between them, we re-engineered the Gal4 technique for real-time and clonal expression (G-TRACE) design30 in mice: a CreERT2 and an eGFP reporter are inserted in the Tppp3 locus (Tppp3CG) to identify Tppp3+ (eGFP+) cells and to indelibly mark the Tppp3-lineage with a Cre-reporter R26Rtandem-Tomato (R26RtdT)15 by tamoxifen (TMX) in 3 M old adult mice (Fig. 1c, Extended Data 1c). eGFP was detected by antibody (not detectable without) in sheath cells next to the midsubstance. No tdT was detected without TMX. With TMX, 79.5 % of eGFP+ cells were labeled with tdT (eGFP+tdT+; Extended Data 1d). While we focused on adult Patellar tendon regeneration in this study, we documented the presence of TMX-induced tdT+ cells in several paratenon sheathed tendons (Patellar, Achilles and tail) and a synovial sheathed tendon (flexor)31 at embryonic day 17.5 (Extended Data 1e), and in Patellar tendon sheath at post-natal day 8 (P8) (Extended Data 1f). When we lineage-traced them from perinatal stage to adulthood (P5 to P8, P30 and P90), they remain in the sheath (Extended Data 1g) and minimally incorporate into the midsubstance during tendon growth period (Extended Data 1h). Finally, we assessed how these cells behave in the adult Patellar tendon when marked at P90 and chased up to 10 M (Fig. 1d), and found no changes in the proportion of labeled cells in sheath and midsubstance (Fig. 1d, Extended Data 1i). Daily 5-Ethynyl-2’-deoxyuridine (EdU) to record proliferation for 1 M following labeling resulted in 5.4 ± 0.4 % (mean±SEM, n=4) tdT+EdU+ cells. These data indicate that Tppp3+ cells are present in embryonic and persist to adult Patellar tendon sheath where they are largely quiescent, and do not contribute to the midsubstance during homeostatic state.
Tppp3+ population harbors tendon stem cells
To determine whether Tppp3+ cells respond to injury, we used a biopsy punch11, 18, 19 to injure the Patellar tendon for reliable regenerative outcome (Fig. 1e, f; Extended Data 1j), and analyzed tendons 30 days post injury (dpi); EdU was administered for the first 15 d (Fig. 1e). Most eGFP−tdT+ (Tppp3-off) cells infiltrated the midsubstance, aligned longitudinally (Fig. 1f), proliferated (EdU+), and embedded in FMOD and TENASCIN-C (TNC) matrix proteins (Fig. 1g, Extended Data 1k–m); few eGFP−tdT+ cells were found in the sheath. Thus, replicative descendants of eGFP+tdT+ sheath cells can assume tenocyte-like properties; uninjured controls showed minimal infiltration of eGFP−tdT+ cells to the midsubstance. Most eGFP+tdT+ cells overlying the regenerated midsubstance had proliferated and expressed no FMOD and TNC, indicating they were renewed stem cells. Together, Tppp3+ cells act as injury-responsive tendon stem cells for paratenon sheathed tendons.
Tppp3+ stem cell-mediated regeneration occurs largely in the first month
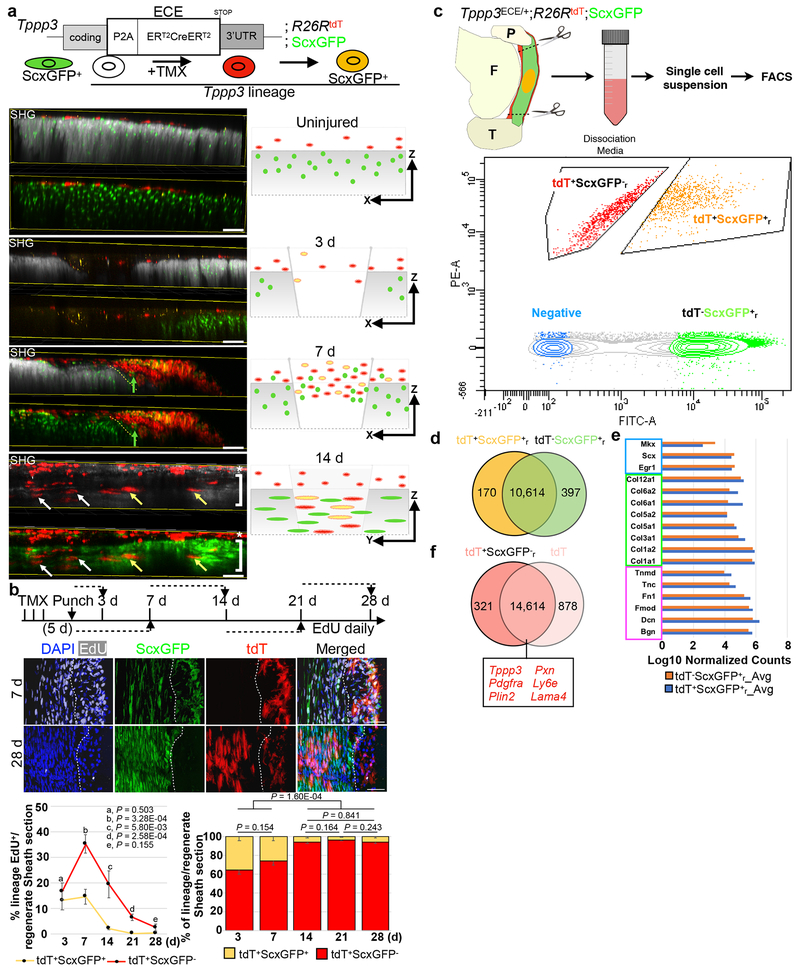
We next sought to understand the cellular dynamics of how Tppp3+ stem cells orchestrate regeneration. To allow simultaneous monitoring of Scx expression (for tenocytes) in Tppp3-lineage, we generated Tppp3ECE, a knock-in allele with ERT2-flanked Cre driven by Tppp3, for lineage-marking with R26RtdT that can be used in combination with a ScxGFP reporter31 expressed in the midsubstance (Fig. 2a, Extended Data 2a). We subjected the Patellar tendon to fluorescent multiphoton imaging for 3D-reconstruction at cellular resolution; in parallel, second harmonic generation (SHG) was recorded to visualize the midsubstance collagen matrix. Without injury, ScxGFP+ cells localized deep within the SHG+ domain while Tppp3-tdT+ cells, superficially (Fig. 2a). Upon injury, tdT+ScxGFP+ and tdT+ScxGFP− cells over the injured region increased dramatically from 3 to 7 dpi (Fig. 2a). At 14 dpi, tdT+ScxGFP+ cells were seen deep within SHG+ domain and aligned with the longitudinal axis, whereas most tdT+ScxGFP− cells were superficial (Fig. 2a).
Fig. 2 |. Tppp3 stem cells amplify early and generate tenocytes by second week.
Diagrams for experimental design (a), and time course (b); daily EdU staggered in time windows (dashed line with arrow in b). Left bottom panels in (a) are whole mount 100 μm maximal projections at specified times in transverse views (except for 14 d, longitudinal view); 3-4 independent repeats: yellow arrows, tdT+ScxGFP+ cells; asterisks, tdT+ScxGFP− sheath cells; white arrows, entrant tdT+ScxGFP−; green arrows, entrant ScxGFP+ cells; dashed line, injury boundary; bracket, ScxGFP+ cells in SHG+ domain. Right bottom panels: cartoon summaries, axes indicated. Mid-panels in (b) are selected images at 7 d and 28 d; dashed lines, midsubstance-sheath boundary; n=3 animals/time point. Bottom left: line graph for % of EdU+ cells in specified population. Mean (%) per time stated for tdT+ScxGFP+ and tdT+ScxGFP−. Bottom right: bar graph for the % of specified lineage in the total labeled population in the sheath; two-way ANOVA for interaction, df = 4, P = 7.602E-20; each population is also subjected to unpaired Student’s t-test in parentheses following specified lineage fraction in paired order of indicated time points for tdT+ScxGFP− and tdT+ScxGFP+ (n=3 animals). Error bars = SEM. c, Schema for FACS isolation of marked cell population: sorted by FITC-A for tdT−ScxGFPr+ (tenocytes in regeneration environment) and by PE-A for tdTr+ScxGFP− (renewed Tppp3 lineage); tdTr+ScxGFPr− and tdT+ScxGFPr+ populations gated by population separation. d, Venn diagram from DESeq comparison between tdT+ScxGFPr+ and tdTr−ScxGFPr cells: # of transcripts labeled; 94.9% transcripts not differentially enriched (overlap region, q-value > 0.05 for cutoff). e, Averaged, normalized log10 counts of selected canonical tendon genes of the overlapped group in (d): blue box for transcription factors, green for collagens, and magenta for proteoglycans/glycoproteins. f, Venn diagram from DESeq comparison between tdT+ScxGFP−r and tdT (quiescent Tppp3 cells): # of transcripts labeled; transcripts not differentially enriched (overlap region, q-value > 0.05 for cutoff); boxed genes represent genes found in overlap, sheath markers in red. Scale bars = 50 μm (a), 100 μm (b). Statistical analysis provided in source data for Figure 2.
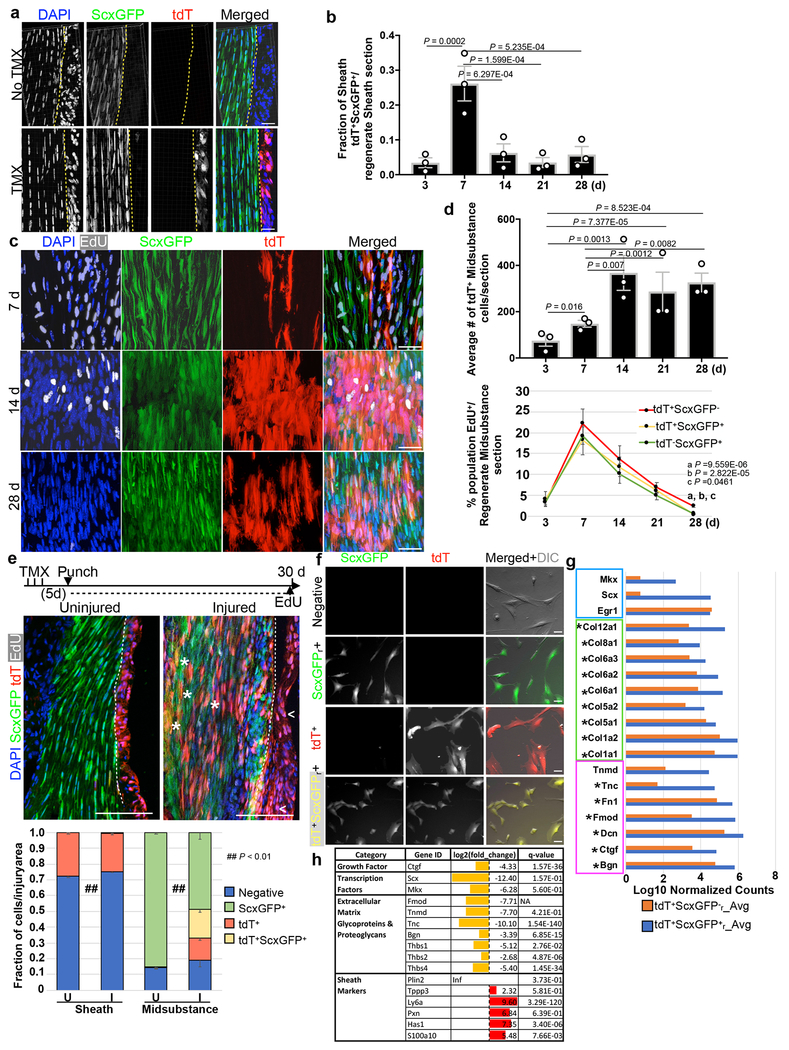
To monitor proliferation kinetics, we administered EdU in timed windows during regeneration (Fig. 2b). Cell proliferation occurred primarily within the first 14 d (peaking at 7 dpi) and minimally at 28 dpi for both the sheath (Fig. 2b, Extended Data 2b) and midsubstance (Extended Data 2c, d) in the regenerated region. Accumulation of tdT+ cells in sheath and midsubstance followed the proliferation pattern. Transient high density of EdU+tdT+ScxGFP+ cells in the sheath at 7 dpi and the presence of EdU+tdT+ScxGFP− and EdU+tdT−ScxGFP+ cells in the midsubstance were found (Extended Data 2c, d). Given the labeling efficiency of Tppp3ECE (Extended Data legends 1c, 2a), EdU+tdT−ScxGFP+ cells might be derived from unmarked Tppp3+ cells; however, it is possible that some midsubstance tdT−ScxGFP+ cells can proliferate, as suggested by prior studies32, 33. Together with the 3D data, we surmise that proliferative Tppp3-tdT+ cells either turn on ScxGFP prior to entering the midsubstance or enter the midsubstance without turning on ScxGFP, and that some tdT−ScxGFP+ cells also migrate to and proliferate in the damaged region for repair (Fig. 2a, b). By 14 dpi, compartmental boundaries are re-established: tdT+ScxGFP−EdU+ (renewed stem cells) in the sheath and tdT+ScxGFP+EdU+ (de novo tenocytes) in the midsubstance (Fig. 2b; Extended Data 2c, d).
When we administered EdU after injury for 30 d, EdU+tdT+ScxGFP− cells were found in the sheath (Extended Data 2e). Given that proliferation ceased by 28 dpi (Fig. 2b), they were renewed stem cells, consistent with the results by G-TRACE (Fig. 1g). G-TRACE mice with EdU administered for only the first 15 d showed EdU retention in eGFP+tdT+ sheath cells at 30 dpi , indicating that self-renewal coincides with the major proliferation period (7-14 dpi). To determine whether tdT+ScxGFPr+ (along with tdT+ScxGFP−r and tdT−ScxGFPr+; r, for regenerated) cells are tenocytes, we isolated them at 30 dpi by fluorescent activated cell sorting (FACS) for RNA-seq (Fig. 2c, Extended Data 2f). Indeed, tdT+ScxGFPr+ cells shared 95% of their transcriptome with unmarked tdT−ScxGFPr+ tenocytes (Fig. 2d). Expectedly, they express tendon-specific transcription factors and matrix genes at equivalent levels (Fig. 2e), but at higher levels than tdT+ScxGFPr− cells (Extended Data 2g). The transcriptomes of tdT+ScxGFP−r and uninjured tdT+ (Tppp3+) cells are highly similar (Fig. 2f), indicative of self-renewal of the former. Additionally, tdT+ScxGFPr+ cells are distinct from uninjured tdT+ (Tppp3+) cells, indicating these tenogenic Tppp3-descendants no longer bear a stem cell signature (Extended Data 2h). Taken together, the Tppp3-lineage can proliferate, give rise to tenocytes in the midsubstance and self-renew in the sheath.
Comparison of tendon subpopulations unveils a potential role for PDGF signalling
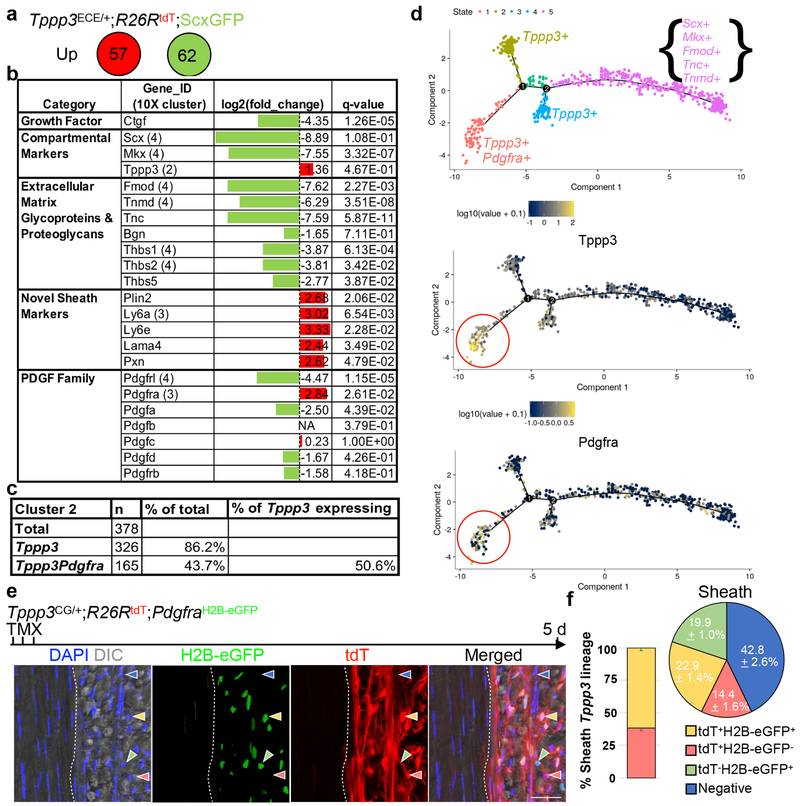
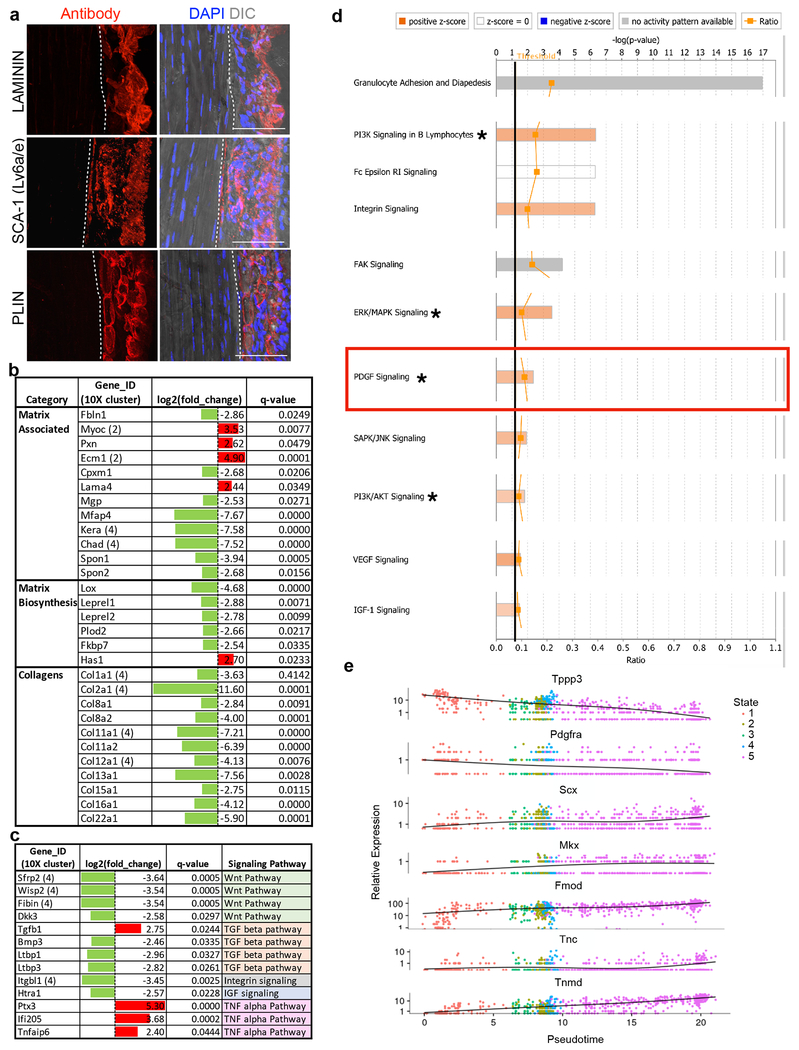
We analyzed the transcriptomes of tdT(Tppp3)+ScxGFP− and tdT−ScxGFP+ cells for differentially enriched genes and pathways (Fig. 3a). We uncovered markers such as Lama4, Ly6a/e, and Plin2 for tdT+ScxGFP− stem cells (Fig. 3b; Extended Data 3a), but a recently reported sheath marker, Osteocalcin21, was not detected, nor in any cell cluster from scRNA-seq. We also found additional matrix biosynthesis and collagen genes in tdT−ScxGFP+ tenocytes not previously reported26, 27 (Extended Data 3b). We next searched for a signalling pathway enriched in Tppp3-tdT+ScxGFP− stem cells for further investigation. Through Gene Ontology (GO)-term analysis, we identified several signalling pathway components, some implicated in tenogenesis. Signalling components of Wnt34, IGF, Integrin are enriched in tenocytes; of TNF in stem cells; of TGFβ35 in both; of Hedgehog in either28, 35–37 (Extended Data 3c). However, no receptors of these pathways were enriched in stem cells. Ingenuity Pathway Analysis (IPA; Extended Data 3d) identified additional enriched signalling pathways. In particular, Pdgfra for PDGF signalling is enriched in stem cells, whereas Pdgfa and the decoy PDGF receptor, Pdgfrl, are enriched in tenocytes (Fig. 3b). Although Erk, PI3K, and Akt signalling is downstream of many pathways, their enrichment is consistent with PDGF signalling38. The differential expression of Pdgfa, Pdgfrl, and Pdgfra suggests a cross-compartmental regulation of tendon stem cell biology.
Fig. 3 |. Molecular characterization of tendon sub-populations.
a, Numbers of up-regulated genes by Cufflinks in uninjured FACS-isolated Tppp3+ (tdT+ScxGFP−) and tenocyte (tdT−ScxGFP+) cells (duplicate); 5 FPKM cutoff in at least one population; false discovery rate (FDR) adjusted q-value < 0.05. b, Table for selected gene categories: log2(fold-change) directionality of enrichment in ScxGFP+ (green) versus Tppp3+ (red) cells (a): gene ID is followed by scRNA-seq cluster assignment in parentheses; n=2 replicates, pooled from 14 tendons; FDR adjusted q-values by Cufflinks package are shown. c, Table for number and % of cluster 2 cells in total, expressing Tppp3, and expressing both Tppp3 and Pdgfra; 1 UMI for cutoff. d, Top panel: Pseudotime trajectory of cluster 2 and 4 cells from scRNA-seq (Fig. 1a) re-plotted using top 1,000 genes by smallest q-value for ordering. Three Tppp3+ states were delineated with state 1 enriched for Pdgfra; keys to cell states at the top. Log10 expression level of Tppp3 (middle) and Pdgfra (bottom) per individual cell plotted in pseudotime trajectory of cluster 2 and 4 cells from scRNA-seq; their enrichment in state 1 is noted by red circles. e, Images of Tppp3CG/+;R26RtdT;PdgfraH2B-eGFP tendon, Images representative of 3 samples. TMX for 3 d and harvested 5 d later; dashed line, midsubstance-sheath boundary; yellow arrowheads, tdT+ H2B-eGFP+ cells; red arrowheads, tdT+H2B-eGFP−; green arrowheads, tdT−H2B-eGFP+; blue arrowheads, negative; direct fluorescent imaging to visualize GFP signal from PdgfraH2B-eGFP but not eGFP from Tppp3CG allele requiring antibody; scale bar = 30 μm. f, Relative cell fractions (keys at bottom) within Tppp3+(tdT+) population (left bar graph; mean (%) (tdT+H2B-eGFP+, 61.4), (tdT+H2B-eGFP−, 38.6)) and within the sheath (right pie chart) from (e); n=3 animals. SEM = error bars or labeled.
Yet, Pdgfra is one of the enriched genes used to assign cluster 3 T-FAPs by scRNA-seq (Fig 1a; Supplementary Table 1). We re-examined the cluster 2 dataset and found that 50.6% of Tppp3+ cells co-express Pdgfra (Fig. 3c). Knowing that cluster 2 Tppp3+ population contains stem cells for cluster 4 tenocytes, we used Monocle 2 unsupervised pseudotime39 to model the relationship between these two clusters, which revealed 5 states (Fig. 3d). There exist 3 Tppp3+ states (states 1, 2, 4) linked to tenocyte fate (state 5). State 1 represents Tppp3+Pdgfra+ cells and expresses higher levels of Tppp3 than states 2 and 4. States 2 and 4 Tppp3+Pdgfra− cells do not display notable gene expression composite (see RNA-seq data for Tppp3+Pdgfra− cells below). Conversely, state 1 cells express high levels of sheath markers which show a downward trend via the intermediate state 3 towards state 5 (Fig. 3d, Extended Data 3e, 4a). Pseudotime projection from state 1 to 5 hints that Tppp3+Pdgfra+ is the tendon stem cell state.
Tppp3+Pdgfra+ cells are tenogenically predisposed and partially resemble T-FAPs
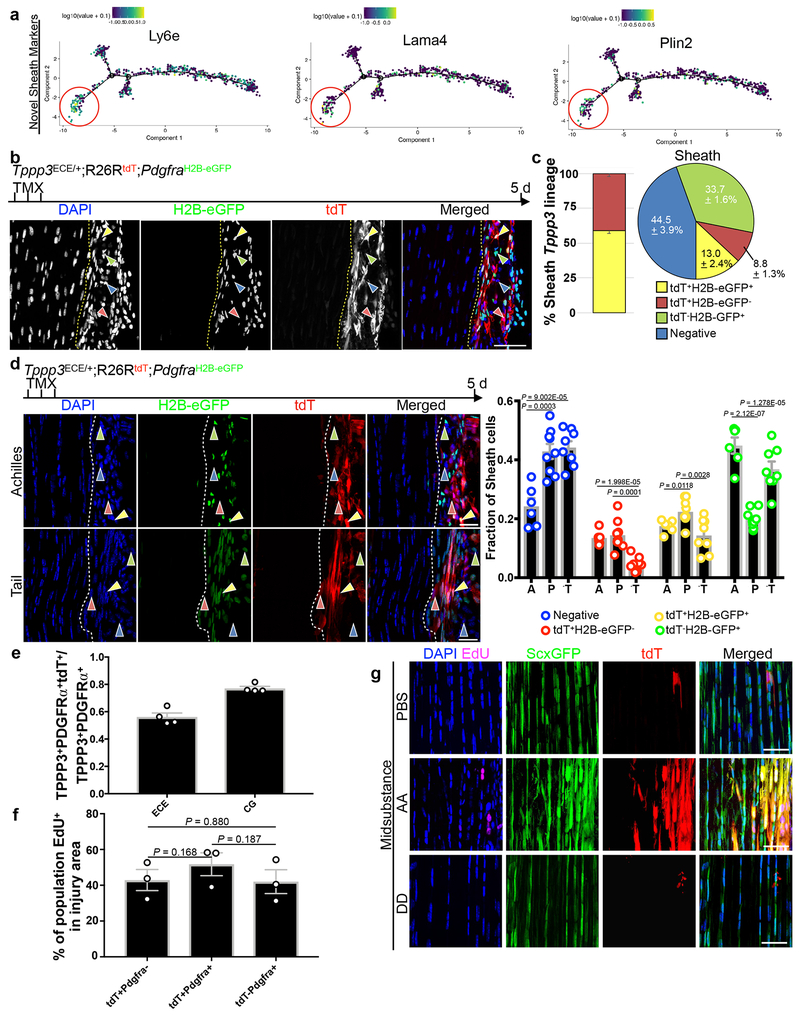
To confirm Tppp3+Pdgfra−, Tppp3−Pdgfra+ and Tppp3+Pdgfra+ subpopulations in the sheath, we combined PdgfraH2B-eGFP (ref. 40) and Tppp3CG;R26RtdT alleles (referred to as Tppp3CG;PdgfraH2B-eGFP; see Methods) to delineate them. tdT−H2B-eGFP+and tdT+H2B-eGFP− cells were indeed present. Furthermore, we found 61% of tdT+ cells were H2B-eGFP+ (i.e. Tppp3+Pdgfra+) in the Patellar tendon sheath (Fig. 3e, 3f); minimal H2B-eGFP signal was found in midsubstance cells. tdT−H2B-eGFP+ and tdT+H2B-eGFP− cells were present. Similar results were found by using Tppp3ECE;R26RtdT combined with PdgfraH2B-eGFP(Tppp3ECE;PdgfraH2B-eGFP) (Extended Data 4b, c). These 3 subpopulations exist in different proportions in the paratenon sheath of Achilles and tail tendons (Extended Data 4d). Labeling efficiencies of tdT within the TPPP3+H2B-eGFP+ population by Tppp3ECE and Tppp3CG drivers were determined at 56.1% and 77.0%, respectively (Extended Data 4e).
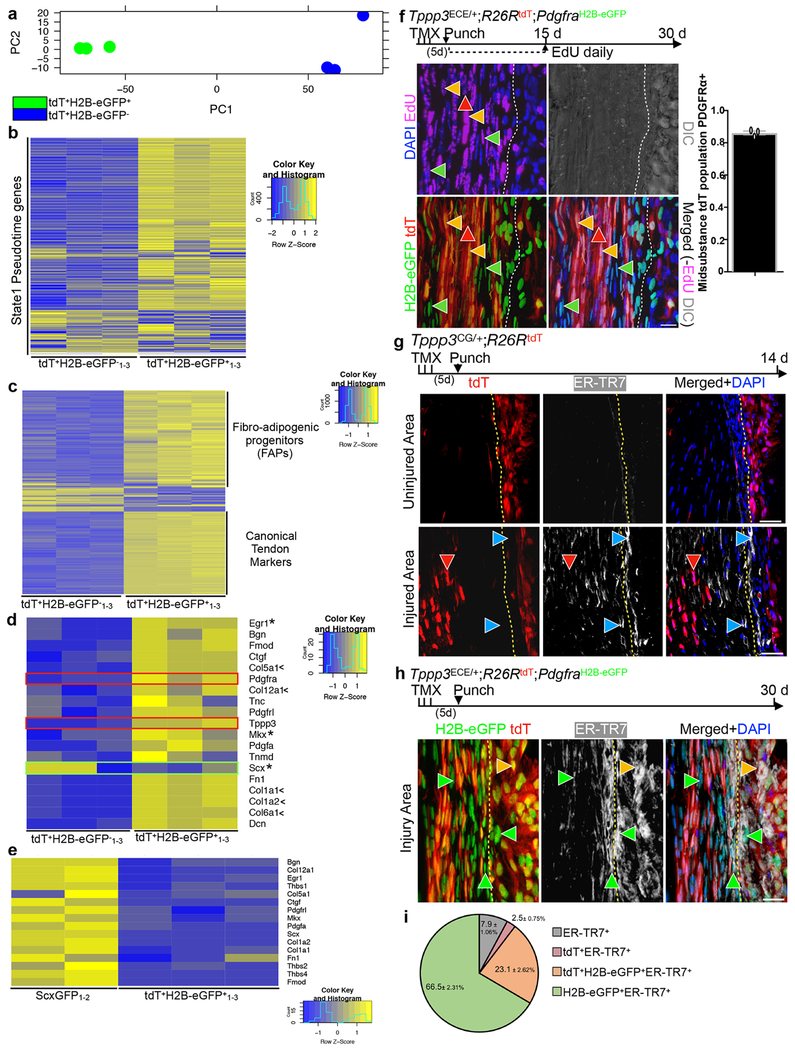
To assess differences between Tppp3+Pdgfra− and Tppp3+Pdgfra+ subpopulations, we performed RNA-seq on FACS-isolated tdT+H2B-eGFP− and tdT+H2B-eGFP+ cells, respectively (Fig. 4a). tdT+H2B-eGFP− cells (i.e. cells in states 2 and 4 combined, in Fig. 3d) bear no resemblance to FAPs nor tenogenic markers except for Scx. Their Scx expression level is considerably lower than that of tenocytes; we are unable to assign them to a known cell type to date. By contrast, tdT+H2B-eGFP+ cells expressed the majority of genes in state 1 (Figs. 4b and 3d), showing the consistency between scRNA-seq and RNA-seq. Surprisingly, tdT+H2B-eGFP+ cells express markers for both FAPs and tenocytes (Fig. 4c). Compared to tdT−ScxGFP+ tenocytes, tenogenic gene expression is lower in tdT+H2B-eGFP+ cells (Fig. 4d, e), likely reflecting an early activation state during cell dissociation and FACS isolation. Thus, we propose that tdT+H2B-eGFP+, i.e. Tppp3+Pdgfra+, cells are tendon stem cells.
Fig. 4 |. Tppp3+Pdgfra+ cell gene signature and contribution during regeneration.
a, PCA plot from RNA-seq data of tdT+Pdgfra− (tdT+H2B-eGFP−1-3) and tdT+Pdgfra+ (tdT+H2B-eGFP+1-3) tendon cells from Tppp3CG/+;R26RtdT;PdgfraH2B-eGFP tendons; 3 samples. b, Heatmap of state 1 (from Fig. 3d)-enriched ordering genes (586 genes) used to generate pseudotime trajectory using tdT+Pdgfra− (tdT+H2B-eGFP−1-3) and tdT+Pdgfra+ (tdT+H2B-eGFP+1-3) cells (from a). c, Heatmap of top 1000 genes from triplicate RNA-seq of tdT+Pdgfra− (tdT+H2B-eGFP−1-3) and tdT+Pdgfra+ (tdT+H2B-eGFP+1-3) tendon cells with the genotype in (a); 47% of tdT+Pdgfra+ and 0.4% tdT+Pdgfra− expressed genes overlap with top 500 FAP genes (GSE89633). d, Heatmap of canonical tendon markers from (b); asterisks, transcription factors; <, collagens; Pdgfra and Tppp3 (red boxes); Scx (green box). e, Heatmap of midsubstance markers in quiescent tenocyte (ScxGFP1-2) and tdT+Pdgfra+ (tdT+H2B-eGFP+1-3) cells. f, 30 dpi of Tppp3ECE/+;R26RtdT;PdgfraH2B-eGFP tendon; EdU daily for the first 15 d; yellow arrowheads, tdT+H2B-eGFP+; red arrowhead, tdT+H2B-eGFP−; green arrowheads, tdT−H2B-eGFP+; dashed line, midsubstance-sheath boundary; n=3 animals; bar graph for the fraction of midsubstance tdT population that is PDGFRα+, mean=86.2%. g, 14 dpi of Tppp3CG/+;R26RtdT tendon; 3 samples; upper panels, uninjured area; lower panels, injured area; blue arrowheads, ER-TR7+-only; red arrowheads, ER-TR7−tdT+; dashed lined, midsubstance-sheath boundary. h, 30 dpi of Tppp3ECE/+;R26RtdT;PdgfraH2B-eGFP tendon; 3 samples; green arrowheads, ER-TR7+tdT−H2B-eGFP+; yellow arrowhead, ER-TR7+tdT+H2B-eGFP+; dashed line, midsubstance-sheath boundary. i, Pie chart distribution of ER-TR7+ cells in injury area from h; n=3; key to the right. Error bars = SEM (f, i); scale bars = 20 (f, h), 40 (g) μm.
Tppp3−Pdgfra+ (T-FAP) cells underlie tendon injury-associated fibrosis
To test whether Tppp3+Pdgfra+ cells are indeed tendon stem cells, we examined their contribution to regeneration in Tppp3ECE;PdgfraH2B-eGFP mice. In this setting, H2B-eGFP was presumed lineage-inherited from Pdgfra+ cells. Following injury, 85% of the regenerated Tppp3-lineage in the midsubstance was tdT+H2B-eGFP+, incorporated EdU, and oriented in linear arrays, indicative of new tenocytes (Fig. 4f). Tppp3−Pdgfra+ T-FAPs and Tppp3+Pdgfra− cells also proliferated and entered the regenerated region. Proliferation indices of these 3 subpopulations indicate that they have similar kinetics (Extended Data 4f). We suspected that T-FAPs gave rise to fibroblasts. To test this, we stained injured Tppp3CG;R26RtdT tendon with ER-TR7, an antibody against reticular fibroblasts. A large proportion of ER-TR7+ fibroblasts were non-tdT-marked cells in both sheath and midsubstance in the injured area compared to uninjured area (Fig. 4g), indicating that fibrotic cells rarely arise from the Tppp3-lineage. By contrast, in the injured Tppp3ECE;PdgfraH2B-eGFP tendon (Fig. 4h), most ER-TR7+ cells in the injury area were tdT−H2B-eGFP+ (Fig. 4i), supporting that T-FAPs contribute to tendon fibrosis. A subset of ER-TR7+ cells were also Tppp3+Pdgfra+, indicating that some of them assumed fibrogenic fate. By contrast, Tppp3+Pdgfra− (i.e. tdT+H2B-eGFP−) cells rarely became fibroblasts or tenocytes.
PDGF-AA drives both tenogenesis and fibrosis
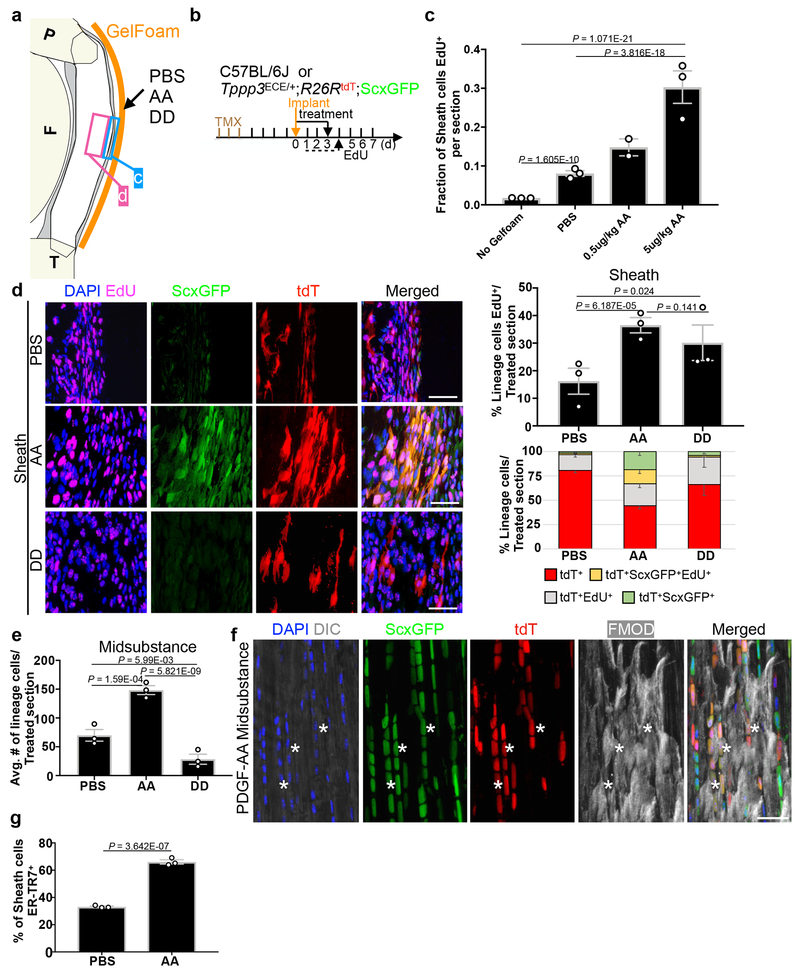
To test whether PDGFRα signalling plays a role in generating tenocytes, we applied PDGF-AA, which only activates PDGFRα38, to the Patellar tendon via GelFoam implants (Fig. 5a, b). Sheath cells showed an increase of EdU incorporation by PDGF-AA, relative to PBS and no GelFoam controls (Fig. 5c). We next used the Tppp3ECE/+;R26RtdT;ScxGFP mice to compare the effects of PDGF-AA and PDGF-DD (which activates PDGFRβ40) (Fig 5b, d, e). PDGF-AA and -DD, relative to PBS, increased EdU incorporation of Tppp3-lineage (Fig. 5d), but only PDGF-AA induced ScxGFP expression in the sheath (Fig. 5d) and deposition of tdT+ScxGFP+ cells in the midsubstance (Fig. 5e, Extended Data 4g), where they expressed FMOD (Fig. 5f). Thus, ectopic PDGF-AA direct Tppp3+ cells to replicate and generate tenocytes. PDGF-AA also caused a concomitant increase in unmarked ER-TR7+ sheath cells compared to PBS control (Fig. 5g). Thus, PDGFRα signalling directs both tenocyte generation and fibrosis.
Fig. 5 |. PDGF-AA drives Tppp3-lineage towards tenogenesis.
a, Diagram for PDGF-AA (AA), PDGF-DD (DD) and PBS treatment to tendon sheath via GelFoam (orange line); arrow, treatment site; blue ‘D’ and magenta ‘E’ boxes, sheath and midsubstance regions, respectively, for quantification in (d) and (e). b, Experimental scheme for (a): annotation same as previous schemes, plus GelFoam implant and protein treatment (solid line with arrow). c, Bar graph for fraction of sheath cells proliferated with two PDGF-AA concentrations using wildtype C57BL/6J mice; n=2 (0.5ug/kg) or n=3 (No Gelfoam, PBS, 5ug/kg) animals/condition; 15 samples/condition; No GelFoam and PBS, controls. d, Fluorescent images of sheath compartment with specified treatment on Tppp3ECE/+;R26RtdT;ScxGFP tendon; bar graph (upper right) for % of Tppp3-lineage proliferated in sheath per treatment; n=3 animals/condition; with 2 (PBS) or 3 (AA, DD) samples/condition. Percentages of various tdT+-lineage fractions (keys at bottom) in sheath (lower right): Distribution comparisons between PBS-AA, PBS-DD, and AA-DD pairs by Chi-square tests, all ## P < 0.01. Each cell fraction is also subjected to Student’s t-test in parentheses following specified cell fractions in paired order of (PBS-AA, PBS-DD, and AA-DD): tdT+ (P=1.01E-05, P=1.51E-02, P=1.1E-03), tdT+EdU+ (P=0.264, P=0.021, P=0.233), tdT+ScxGFP+ (P=5.26E-03, P=0.161, P=2.73E-03), and tdT+ScxGFP+EDU+ (P=8.95E-03, P=0.951, P=1.59E-03). e, Bar graph for average number of lineage cells in midsubstance; n=3 animals/condition. f, Zoomed in fluorescent images of PDGF-AA treated midsubstance (from e) stained for FMOD; asterisks, FMOD+tdT+ScxGFP+ cells; 3 independent repeats. g, Bar graph of percentage of ER-TR7+ sheath cells per treatment; n=3 animals/condition; 3 samples/n. Unpaired two-tailed Student’s t-test (c, d, e, f), error bars = SEM; scale bar = 30 (d, f) μm.
PDGFRα signalling is required in Tppp3+ cells for tendon regeneration
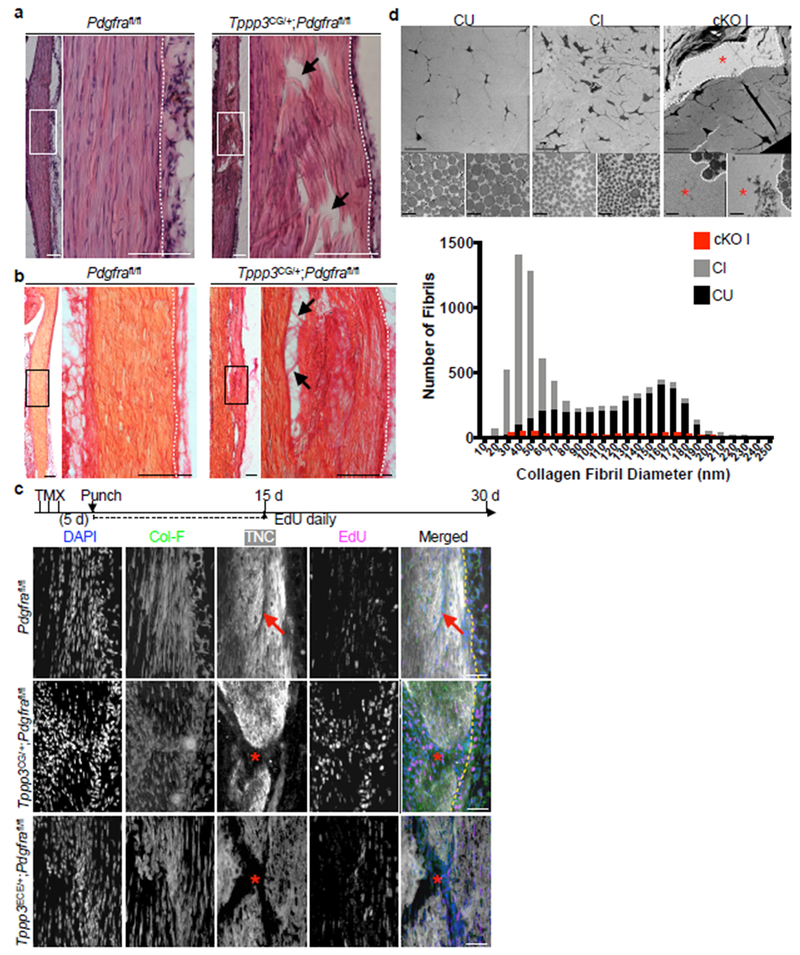
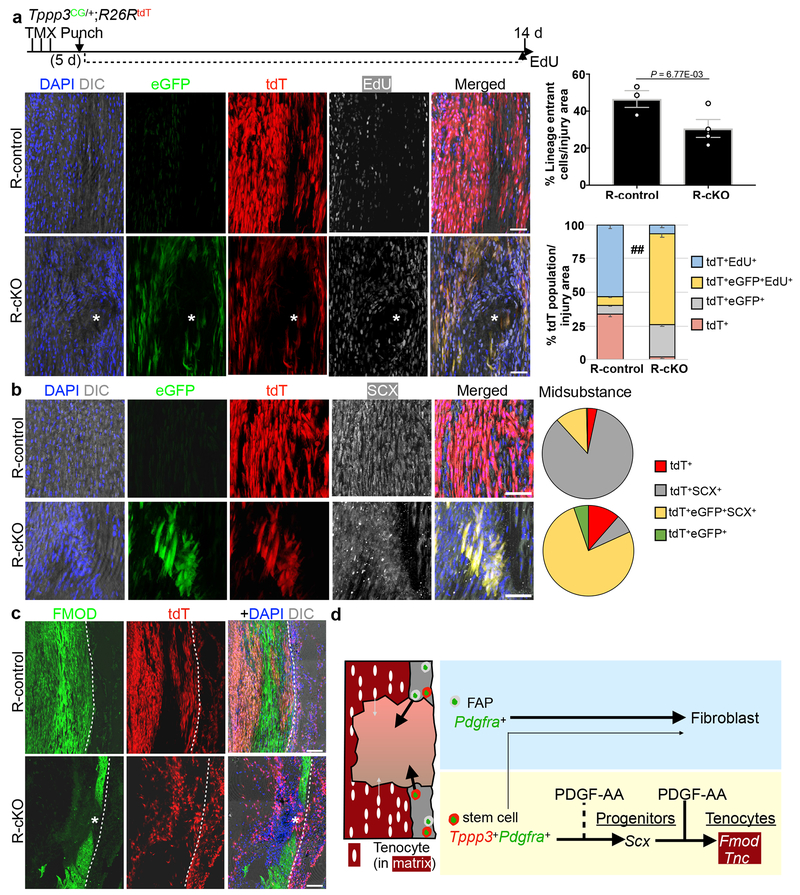
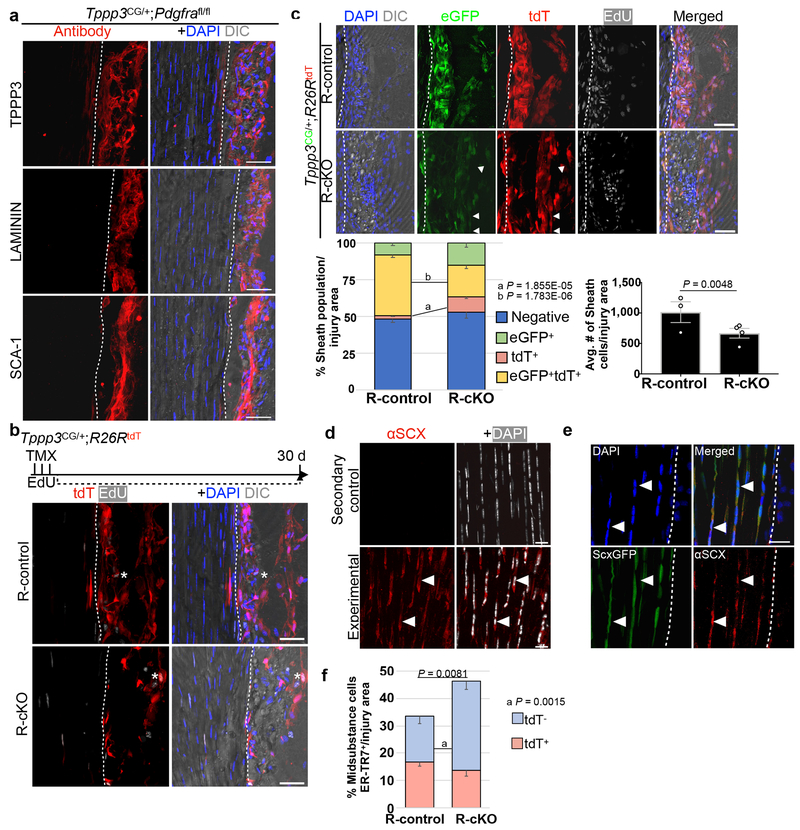
While Tppp3+Pdgfra+ cells can respond to exogenous PDGF-AA, whether they depend on PDGFRα signalling for homeostasis or regeneration is unclear. To test this, we used adult Tppp3CG;Pdgfrafl/fl mice to inactivate Pdgfra (conditional Knock Out, cKO; Fig. 6a). Without injury, cKO sheath cells did not show changes in marker expression up to 30 d (Extended Data 5a). We then subjected them to injury and assessed regeneration at 30 dpi. At 30dpi, injured cKO tendon displayed gaps in matrix continuity and nuclear alignment (Fig. 6a), mis-aligned collagen fibrils (Fig. 6b) and gaps in TNC deposition (Fig. 6c), compared to controls. By transmission electron microscopy (Fig. 6d), we found that injured controls (CI) contained collagen fibrils with a shifted distribution towards sizes < 70 nM in diameter compared to uninjured controls (CU). Injured cKO (cKO I) showed a structural gap devoid of fibrils, and a few fibrils adjacent to the gap of small diameter. Tppp3ECE/+;Pdgfrafl/fl mice phenocopied Tppp3CG;Pdgfrafl/fl mice (Fig. 6c). To trace cKO cells, we included the R26RtdT reporter (R-cKO); Tppp3CG;R26RtdT mice were used as reporter-controls (R-control). As expected, R-cKO sheath cells were present without injury (Extended Data 5b) and failed to regenerate following injury (Fig. 7a). In the injured area, fewer R-cKO cells were found in sheath and midsubstance compared to R-control (Fig. 7a; Extended Data 5c). No programmed cell death was detected in R-cKO (see Methods), indicating that the reduction of cells is mainly due to a proliferation defect. We delineated cell fractions according to proliferation history (EdU), and eGFP (Tppp3) and tdT (lineage) expression, and found that, relative to the R-control, a larger fraction of R-cKO cells were EdU+ and the majority of them, eGFP+tdT+. We suggest that Tppp3+Pdgfra− and mutant cells stall at a progenitor state but are less robust to make new cells. In line with this, the majority of eGFP+tdT+ R-cKO cells are SCX+, while most R-control SCX+eGFP−tdT+ cells had turned off eGFP (i.e. Tppp3) as they differentiated into tenocytes (Fig. 7b; Extended Data 5d, 5e). Midsubstance R-cKO cells did not express FMOD (Fig. 7c), indicating a defect in tenocyte differentiation. Additionally, R-cKO cells in the sheath were deficient in self-renewal as indicated by decreased eGFP+tdT+ cells. We conclude that Pdgfra is dispensable for SCX expression, potentiates proliferative capacity of tendon stem cells, and is essential for tenocyte differentiation (summarized in Fig. 7d). We found an increase of unmarked ER-TR7+ cells in R-cKO compared to R-control (Extended Data 5f), but no change in the tdT+ER-TR7+ cells between R-cKO and R-control. This suggests T-FAPs (Tppp3−Pdgfra+, hence unmarked) dominate in the regeneration-failure context of R-cKO, providing an explanation for extensive fibrosis in failed tendon regeneration.
Fig. 6 |. PDGFRα signaling is required in Tppp3+ cells for regeneration.
a, H & E histology of Pdgfrafl/fl (control) and Tppp3CG/+;Pdgfrafl/fl (cKO) at 30 dpi; white box, area of zoom in panels displayed to the right; arrows, matrix defects; dashed line, midsubstance-sheath boundary; 2 independent repeats. b, Picrosirius red histology of Pdgfrafl/fl (control) and Tppp3CG/+;Pdgfrafl/fl (cKO) at 14 dpi; black box, area of zoom in panels displayed on the right; arrows, matrix defects; 2 independent repeats. c, Experimental scheme and fluorescent images of Pdgfrafl/fl (control), Tppp3CG/+;Pdgfrafl/fl, and Tppp3ECE/+;Pdgfrafl/fl tendons at 30 dpi; 3 (control) and 4 (mutants) animals/condition; EdU for first 15 d; Col-F, collagen; TNC, antibody stained; dashed line, midsubstance-sheath boundary; arrow, regenerated tendon; asterisk, failed regeneration. d, TEM images of control uninjured (CU), control injured (CI), and cKO injured (cKO I) adult, tendon cross-sections of equivalent area. Upper panels are low magnifications of matrix architecture. Red asterisk indicates hole in matrix. White dashed line indicates the border of the injury where fibrils were counted for cKO I. Lower panels represent two images of fibrils per condition. Bar graph, aggregated distribution of collagen fibril diameters, using high magnification TEM images above from n = 4 mice/group (1000 fibrils/tendon for CU and CI, and at least 150 fibrils/tendon for cKO I on the edge of the injury hole). Average minimum feret fibril diameter across tendon types are as follows: 124.7±0.7 (CU), 55.3±0.5 (CI), and 110.6±2.2 (cKO I) (Mean±SEM) nm. Scale bars = 0.2 (d lower panels), 10 (d upper panels), 50 (a, b, c zoomed in panels on left) and 100 (a, b zoomed out panels on right) μm.
Fig. 7 |. Tppp3+ mutant cells fail to differentiate following injury.
a, Pdgfra gene inactivation: Same TMX and injury scheme as before and harvested at 14 dpi; EdU daily throughout. Upper panels, images for Tppp3CG/+;R26RtdT (R-control) and lower panels for Tppp3CG/+;R26RtdT;Pdgfrafl/fl (R-cKO); asterisk, area of failed regeneration. GFP was detected by immunofluorescence. n=3 (R-control) and n=4 (R-cKO) animals/condition; 3 samples/n. To the upper right, quantification for lineage cells per injury area (unpaired two-tail Student’s t-test); mean(%)=(R-control, 46.6; R-cKO, 30.7). To the lower right, tdT lineage composition at bottom (Chi-square test ## p <0.01). Each cell fraction is also subjected to unpaired two-tail Student’s t-test in parentheses between R-control and R-cKO groups: tdT+ (P=8.00E-13), tdT+GFP+ (P=2.54E-08), tdT+GFP+EdU+ (P=3.59E-15), tdT+EdU+ (P=1.27E-12); mean(%) per cell fraction across groups (R-control, R-cKO) as follows: tdT+(33.8, 1.7), tdT+GFP+ (6.8, 24.6), tdT+GFP+EdU+ (6.5, 66.9), tdT+EdU+ (53.0, 6.8). b, SCX immunofluorescence organized as in (a); to the right, pie charts for lineage composition; two-way ANOVA, df = 3, P = 6.5776E-20; n=3 samples; 3 independent repeats. c, FMOD immunofluorescence organized as in (a); dashed line, midsubstance-sheath boundary; 3 independent repeats. d, Model: T-FAPs and stem cells reside in the sheath (gray) and tenocytes in the midsubstance (red). Following injury, PDGF signalling directs T-FAPs to elicit fibrosis and stem cells to produce new tenocytes. Tenocytes have limited repair (gray small arrow) and do not compensate without functional stem cells (R-cKO). Error bars = SEM (a); scale bar = 50 (a, b), 100 (c) μm.
Sheath subpopulations have stable and distinct properties in vitro
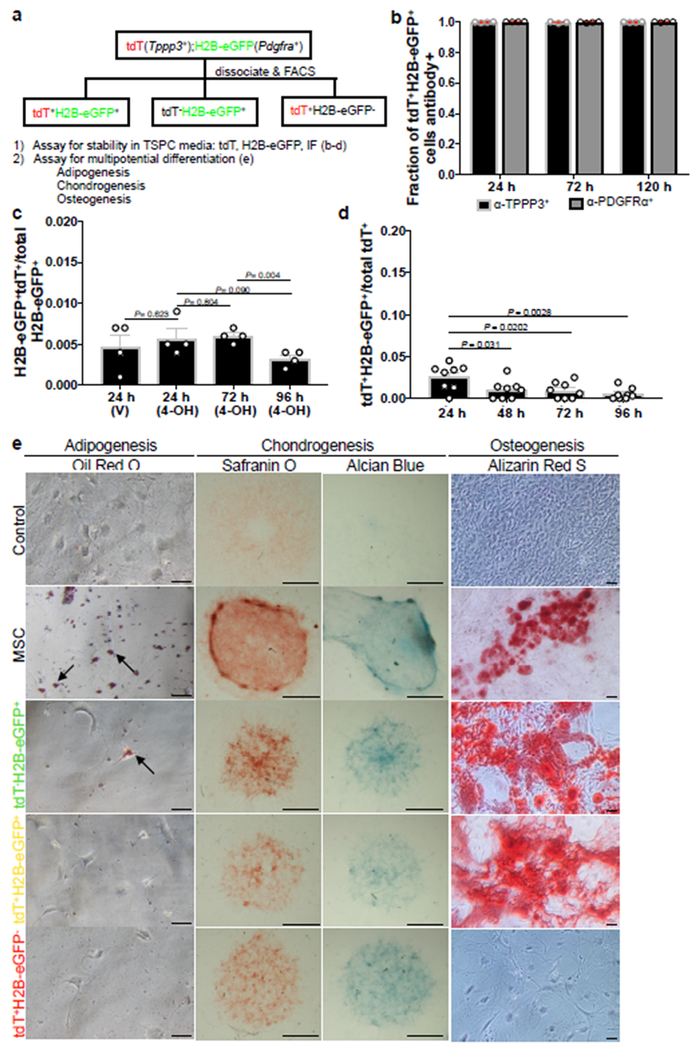
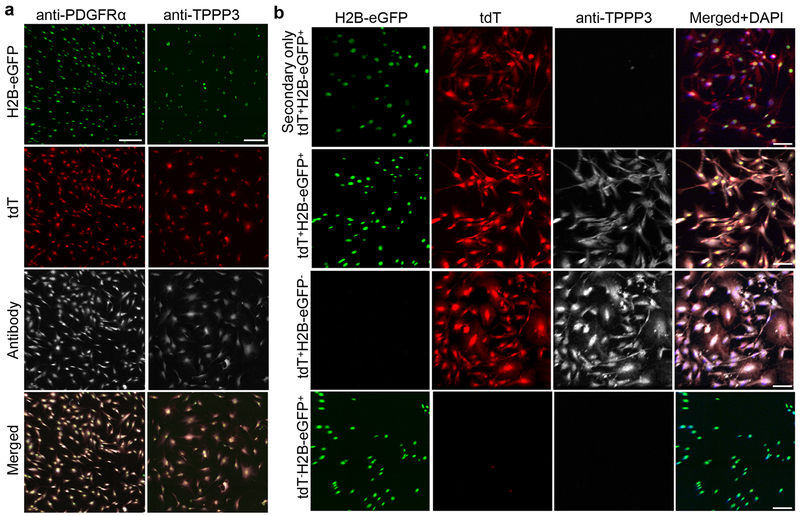
Next, we examined Tppp3+Pdgfra+, Tppp3+Pdgfra−, and Tppp3−Pdgfra+ cells in vitro in TSPC media using FACS-isolated tdT+H2B-eGFP+, tdT+H2B-eGFP−, and tdT−H2B-eGFP+ subpopulations, respectively, sorted to ≥ 98% purity (Fig. 8a). Each subpopulation was sorted to > 98% purity and cultured in TSPC media12; tdT and H2B-eGFP signals were monitored, and TPPP3 and PDGFRα expression was determined (Extended Data 6a, b). tdT+H2B-eGFP+ subpopulation displayed no measurable changes in marker expression over time (Fig. 8b). The tdT−H2B-eGFP+ (Fig. 8c) and tdT+H2B-eGFP− (Fig. 8d) subpopulations did not decrease their proportions, and appeared to outcompete the contaminating tdT+H2B-eGFP+ cells over time. Thus, each subpopulation is stable in the condition used. We subjected each subpopulation to multipotential differentiation assays per mesenchymal stem cells (MSCs)41–43 (Fig. 8a, e). Like MSCs, tdT−H2B-eGFP+ (Tppp3−Pdgfra+) cells differentiated into adipogenic, chondrogenic, and osteogenic cells, whereas tdT+H2B-eGFP+ (Tppp3+Pdgfra+) gave rise to the latter two fates and tdT+H2B-eGFP− (Tppp3+Pdgfra−) cells was only capable of chondrogenic fate (Fig. 8e). Importantly, Tppp3+Pdgfra+ stem cells do not have adipogenic potential as TSPCs12. Tppp3−Pdgfra+ T-FAPs indeed have the same potentials as FAPs23, 24. As T-FAPs do not turn on TPPP3 in vitro, their switch to tendon stem cells in vivo is unlikely. As Tppp3+Pdgfra− cells do not gain PDGFRα expression in vitro, they also may not become tendon stem cells in vivo. Implications of Tppp3+Pdgfra− cells, Tppp3−Pdgfra+ T-FAPs, and Tppp3+Pdgfra+ tendon stem cells co-existing in the same niche are discussed below.
Fig. 8 |. Sheath subpopulations do not have identical properties in vitro.
a, Schemes for in vitro experiments using cell subpopulations purified from Tppp3CG/+;R26RtdT;PdgfraH2B-eGFP Patellar tendon. b, Fractions of tdT+H2B-eGFP+ subpopulation that were TPPP3+ or PDGFRα+ at specified time intervals in TSPC culture; n=4 samples per time point; Mean per time point (24 h, 72 h, 120 h) indicated fractions of positive marker staining (TPPP3+; 0.997, 0.995, 0.997), (PDGFRα+, 0.999, 0.996, 0.998). c, tdT−H2B-eGFP+ subpopulation at specified time intervals in TSPC culture; n=4 samples per time point; unpaired two-tail Student’s t-test p-values displayed on chart; mean per condition (24 h V, 24 h 4-OH, 72 h 4-OH, 96 h 4-OH) as follows: (0.005, 0.006, 0.006, 0.003). d, tdT+H2B-eGFP− subpopulation at specified time intervals in TSPC culture; n=8 samples per time point; unpaired two-tail Student’s t-test significant p-values displayed on chart, all other comparisons are non-significant, p > 0.05; Mean per time (24 h, 48 h, 72, 96 h) as follows: (0.026, 0.010, 0.010, 0.005). e, Multipotent differentiation assay: control, non-differentiated murine mesenchymal stem cells (MSCs); scale bars = 50 μm (adipogenesis and osteogenesis), 1000 μm (chondrogenesis). 3 independent repeats. Error bars = SEM (b-d).
DISCUSSION
Here we present a logic-based approach to define adult tendon stem cells. We used paratenon sheathed Patellar tendon as a model for its well-established regenerative outcome11, 18, 19. scRNA-seq data support the complexity of tendon tissue noted previously44–47. From the data, we targeted the Tppp3 gene to define tendon stem cells by lineage tracing, 3D imaging, and marker and histological analyses. RNA-seq data further provide evidence that Tppp3-lineage derived tdT+ScxGFP+ cells are de novo tenocytes. Tenocytes can also contribute to repair, albeit only in neonates17, which explains the derivation of Scx+CD34− TSPCs from the midsubstance of young mice12. Contrasting to TSPCs, adult Tppp3+ tendon stem cells described herein express no Scx and high levels of Cd34 (FPKM >4000, based on RNA-seq) and are not in the midsubstance. The transcriptome of Tppp3+ cells may be exploited for prospective cell isolation via surface markers and further characterization. Importantly, we have defined a distinct tendon stem cell population in vivo.
By pseudotime39, we delineated Tppp3+Pdgfra+ andTppp3+Pdgfra− subpopulations. PDGFRα signalling is necessary and sufficient for Tppp3-lineage to produce new tenocytes, supporting Tppp3+Pdgfra+ as tendon stem cells. By contrast, the Tppp3+Pdgfra− subpopulation rarely produce tenocytes, and their descendants are likely the tdT+ScxGFP− cells found in the healing tendon. These 2 subpopulations were not resolved by Cell Ranger clustering using gene modules, but they showed differentially expressed genes by RNA-seq. This would indicate that they express similar gene modules to be clustered together but they are not the same, which explains their overlapping but not identical differentiation potential in vitro. Although we find no evidence that Tppp3+Pdgfra− cells turn on Pdgfra to become tendon stem cells, we cannot exclude this possibility. Even if they were able to convert to tendon stem cells, their Pdgfra gene should be inactivated in R-cKO mice, and the indispensable role of PDGFRα for tenocyte differentiation still stands.
The existence of T-FAPs in tendon stem cell niche has a direct implication to the perennial problem of fibrosis in tendon healing. T-FAPs are the primary contributor to ER-TR7+ fibroblasts. T-FAPs and tendon stem cells display similar proliferation kinetics as during regeneration, explaining why fibrosis accompanies tendon healing. Without PDGFRα signalling in tendon stem cells to support tendon regeneration, increased ER-TR7+ fibroblasts were observed and reflected a dominance of T-FAPs in this context (see model in Fig. 7d). It is possible that T-FAPs act as a conduit for fibrosis-assisted tendon healing process6–10. While tenocytes may possess a limited regenerative property17, and if other undefined tendon stem cell populations exist, they are not sufficient to compensate for regeneration.
The dual role of Pdgfra in tendon stem cells and T-FAPs highlights the challenge to enhance tendon regeneration while reducing fibrosis via manipulating PDGFRα signalling. Based on labeling efficiencies of our Cre drivers, Pdgfra inactivation in stem cells was unlikely complete. We suggest that when functional stem cells are substantially decreased, other subpopulations become dominant to prevent regeneration. Alternatively, Pdfgra-inactivated stem cells act in a dominant negative fashion to prevent remaining non-inactivated stem cells from compensation. Thus, the relative ratio among these 3 subpopulations may be critical for regenerative outcome. Co-existence of these subpopulations in Achilles and tail tendons suggests that the same difficulty of regeneration exists across paratenon sheathed tendons; the differences in relative proportions of these subpopulations in these tendons may underlie differences in their regeneration2, 19. Increased fibrosis by ectopic PDGF-AA confirms this complication and helps explain the variable successes using PDGF-BB to enhance tendon regeneration48, 49, considering that PDGF-BB can also bind PDGFRβ to stimulates a non-tenogenic response as PDGF-DD. If PDGF signalling is used by other tissue-specific stem cells in the presence of FAP-like cells, fibrosis, either micro-lesions or large scars, during natural tissue regeneration is unavoidable. Collectively, our results frame the conceptual principle to advance the basic understanding of tendon regeneration. The approaches and resources described open the doors to future studies in different tendon types and injury paradigm and should facilitate efforts to create better therapeutic strategies for injured tendons.
Methods
Mice
All animal treatment and care conformed to NIH guidelines and were approved by Institutional Animal Care and Use Committee (IACUC) of the Carnegie Institution for Science (Permit #A3861-01). Mouse strains were made in-house, from JAX, or from other investigators (Supplementary Table 2). Data from mixed-sex groups were used, except that only males were used for scRNA-seq and RNA-seq. The following mouse strains were used at 3 M of age and older:
B6;SJL-Tg(ACTFLPe)9205Dym/J50
C57BL/6J
B6.Cg-Pdgfratm8Sor/EiJ51
B6.129S4-Pdgfratm11(EGFP)Sor/J40
B6.Cg-Gt(ROSA)26Sortm14(CAG-tdTomato)Hze/J15
tg(ScxGFP)31
Tppp3P2A-iCreERT2-T2A-eGFP
Tppp3P2A-ERT2CreERT2
Generation of Tppp3 Cre-ERT2 alleles
A BAC clone of C57BL/6 genomic DNA (CHORI) containing Tppp3 was used to construct homologous recombination plasmids by recombineering52, 53. A 5’ 1.6kb and a 3’ 12kb sequences were used as homology arms. The CG (2A-iCreERT2-2A-eGFP)-frt-neo-frt or the ECE (2A-ERT2-Cre-ERT2)-frt-neo-frt cassette was inserted upstream of the stop codon; ECE was described54. No coding or 3’UTR sequences were deleted; information available upon request. The final constructs were in the pWS-tk2 vector53. C57BL/6J;129sv hybrid embryonic stem cells (from Dr. Yixian Zheng) were used. The frt-neo-frt cassette was removed by breeding to Actin-Flp mice50. PCRs using primers amplifying 5’ and 3’ junctions confirmed homologous recombination. Primers for genotyping and respective product sizes for these alleles are: 5’-CAA CAT TGG CGT CAC CGT AAG TGC CCT G-3’; 5’-ATA GGC ACT GAC TCC CAG ACA GAT GAC A-3’; 5’-TTT GGT GCA CAG TCA GCA GGT TGG ACA T-3’ (Tppp3CG only); 5’-CCA GGG TTC TCC TCC ACG TCT CCA GCC T-3’ (Tppp3ECE only). For Tppp3CG, mutant = 433bp and WT = 549bp. For Tppp3ECE, mutant = 401bp and WT = 549bp. The following program was used: 95°C for 3’, followed by 30 cycles of 95°C 45”, 60°C 1’, 72°C 1’, and final extension 72°C 5’ and 12°C hold.
Tamoxifen administration
Tamoxifen (TMX; Sigma) was prepared as 20 mg/mL stock in corn oil (Sigma) and administered by intraperitoneal (IP) injection at 10 μl/g body weight for 3 consecutive days. After which, mice were chased for 5 d or longer (in legends) before harvest or injury. Similar lineage tracing results were found with 1 M TMX washout.
EdU administration
EdU (0.5 mg/mL in PBS) was administered by IP injection at 10 μl/g body weight as specified in legends and text.
Patellar tendon biopsy punch
Mice were anesthetized using 2,2,2-Tribromoethanol dissolved in 2-methyl-2 butanol (Sigma) as 100% (w/v) stock solution, diluted to 2.5% in PBS and used at 20 μl/g body weight. Biopsy punch was as described11 with modifications: #5 forceps (Dupont) were used to expose the underside of the Patellar tendon. A thin metal sheet was placed underneath the tendon to provide backing for the biopsy punch. An Accu-Sharp Punch MII 0.75 mm diameter (Shoney Scientific) was used. Afterwards, skin was closed using sutures (Ethicon, PERMA-HAND™Silk, 5-0, P-3). Mice were placed in a heated chamber to recover. Elizabethan collars were put on the mice for the first 3 days post operation. Knee joints were harvested at specified time points.
PDGF-AA and -DD application
Mice were anesthetized as above, and a skin incision was made over the Patellar tendon with surgical scissors. A 1 cm2 of 7 mm thickness GelFoam® sponge was flattened with #5 forceps (Dupont) and positioned over the Patellar tendon. The skin flaps were closed by sutures. For growth factor application, mice were anesthetized with 1.7% Isofluorane (Patterson Veterinary) mixed with oxygen delivered at 1 L/min using an Animal Anesthesia System (VetEquip). Growth factors (in PBS at specified concentrations) or PBS was injected (20 μl) into the sponge. After a week, knee joints were harvested. For cell fate studies, growth factors were used at 5μg/kg body weight.
Patellar tendon sample preparation
Knee joints were dissected out in PBS as described16 with modifications: 7 min fixation with 4% paraformaldehyde (PFA) in PBS on ice, following decalcification, a sucrose infiltration series (10%, 20%, 30% in PBS; overnight each) at 4°C with rocking, and embedded in O.C.T. medium (Tissue-Tek) on dry ice. Twenty μm sagittal sections were collected on Cryofilm Type IIC (Section Lab, Inc., Japan) and affixed to glass slides using 1.5% chitosan in 0.25% acetic acid and allowed to dry at 4°C. Sections throughout the tendon were collected.
Immunofluorescence (IF), EdU, and cell death detection
Sections were hydrated with PBS, permeabilized 15–25’ with PBS plus 0.5% Triton X-100 (w/v; 0.5% PBT), rinsed with 0.05% PBT, and blocked overnight with M.O.M. IgG block (Vector Lab). Sections were washed and incubated in blocking solution (10% horse serum, 10% normal goat serum, or 10% donkey serum (pending on secondary antibody host) in 0.05% PBT) for 1.5 h, followed by incubation with primary antibodies diluted in blocking solution overnight at 4°C. Sources and dilutions for primary antibodies are in Supplementary Table 3. After several 0.05% PBT washes, fluorescent-conjugated secondary antibodies in blocking solution (1:1000 for Alexa-488, Alexa-568 and at 1:500 for Alexa 647 (Invitrogen)) were applied and incubated at RT for 1 h. Sections were then washed with 0.05% PBT, stained with DAPI (1 μg/mL in 0.05% PBT), and mounted in anti-fade diamond (Invitrogen). R26RtdT, ScxGFP, and PdgfraH2B-eGFP fluorescence was preserved, thus, no antibody staining was used. For antibodies requiring antigen retrieval (specified in Supplementary Table 3), slides were hydrated with PBS, switched to antigen retrieval solution (10 mM sodium citrate, 0.05% Tween-20, pH 6.0 or 10mM Tris buffered saline, 0.05% Tween-20, pH 10.0), incubated for 20 min at 90°C in a hybridization oven, removed, cooled to RT, rinsed with PBS, and proceeded to permeabilization step as above.
EdU detection was performed after permeabilization and prior to M.O.M. IgG block. Click-iT® Alexa Fluor 647 kit (Invitrogen) was used with two modifications: 1) Alexa Fluor-azide was used at half the recommended formulation for 15 min, and 2) 0.5% PBT was used for washes twice after azide, 5 min each.
TUNEL assays (Roche) were used to assess cell death on regenerating samples following the manufacturer’s protocol, and no signals were detected.
10X Genomics scRNA-Seq
For scRNA-seq, a pair of Patellar tendons from a 3 M old male C57BL/6J were dissected and subjected to pre-warmed dissociation solution (3 mg/mL Collagenase I (Worthington) and 4 mg/mL Dispase II (Roche) in PBS)12, 55 in conical tubes positioned horizontally in a shaking water bath for 45 min at 180 rpm at 37°C. Samples were then lightly triturated with sterilized Pasteur pipettes (VWR), run through a 40 μm filter (VWR) and rinsed with 3 mL TSPC media (αMEM (Gibco) supplemented with 20% EmbryoMax fetal bovine serum ES-cell qualified (EDM Millipore), 100 mM 2-mercaptoethanol, 2 mM GlutaMax, 100 U/mL Penicillin-Streptomycin (Gibco)) to inactivate the enzymes. Cells were centrifuged at 300 x g for 30 min at 4°C. The cell pellet was washed twice with 1 mL PBS and spun for 10 min at 300 x g at 4°C. Cell pellet was resuspended in 0.4% BSA in PBS. Single cell suspension concentration and viability (by Trypan blue exclusion) was confirmed by Countess II Automated Cell Counter (Thermo Fisher Scientific) and hemocytometer (VWR). The digestion time was optimized to yield sufficient number of viable cells. GEMs were made using the Chromium Controller and libraries were made using the Chromium™ Single Cell 3’ v2 Reagent Kit (10X Genomics). Next-seq (Illumina) was used to obtain at least 157.8K mean reads per cell. 10X genomics analysis software Cell Ranger yielded 4,216 and 1,551 median UMI and genes per cell, respectively, and was used to produce the t-SNE graph. By Satija Lab (http://satijalab.org/howmanycells) estimate, a metric used to address the accuracy of cell cluster assignment, we reached 99% confidence level for obtaining data from 10 cells of a rare cell type present at 1% of a total population composed of 8 cell types.
Isolation of fluorescently marked tendon cell populations by FACS
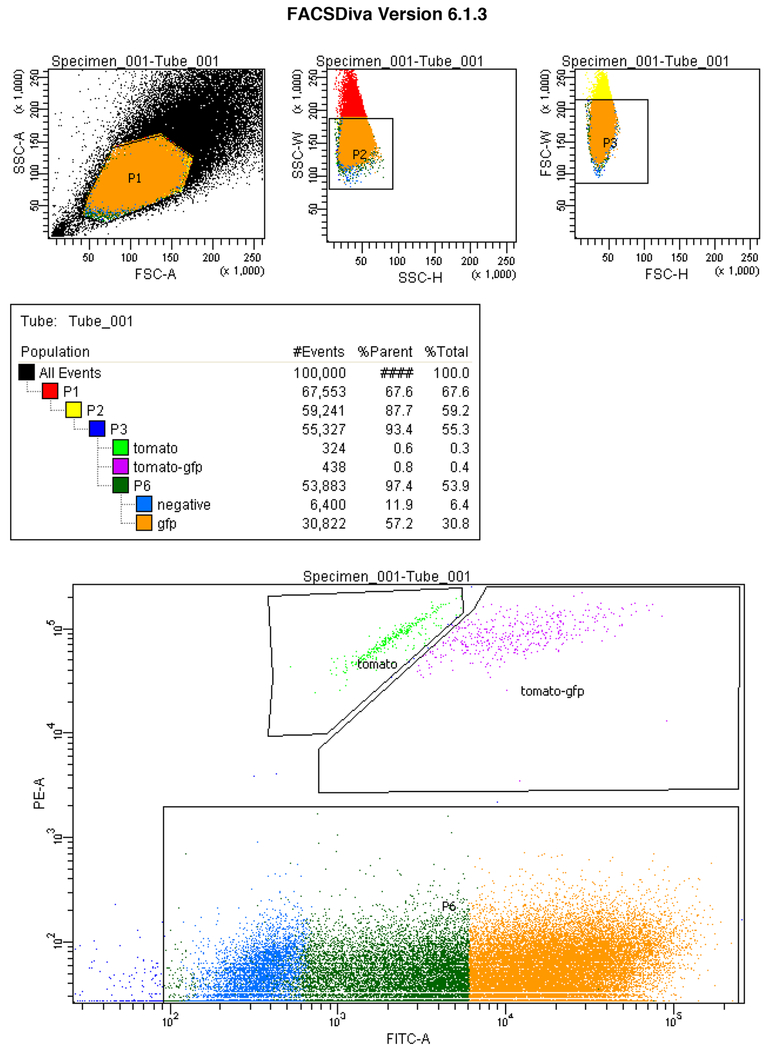
Patellar tendons from multiple mice of specified allelic combinations were pooled for cell isolation. The dissociation protocol was adjusted from scRNA-seq procedure to increase cell yield by increasing dissociation time to 1.5 h at 180 rpm at 37°C and triturated until tendon fragments broken up. The washed cell pellet was resuspended in FACS buffer (1% BSA, 1 mM EDTA in PBS). Cells were distinguished by forward and side scatter, and sorting was gated using FITC-A (GFP) and PE-A (tdT) filters to distinguish GFP+, tdT+, Dual+ and negative cell populations (Extended Data 7). Sorting efficacy was confirmed by visualizing live fluorescently positive cell of corresponding population after plating (Extended Data 2f).
RNA-seq
Uninjured and regenerated Patellar tendons from Tppp3ECE/+;R26RtdT;ScxGFP mice were isolated by FACS, spun down, re-suspended to 1000 cells per subpopulation, and subjected to RNA Direct-zol kit (Zymo), followed by Ovation RNA-seq V2 System (NuGEN) to generate cDNAs. cDNAs were sonicated to 300-500bp (Covaris) and libraries were generated by the TruSeq RNA Library Prep Kit (Illumina) for single-end 150bp reads (Next-seq, Illumina). For uninjured tdT+H2B-eGFP− and tdT+H2B-eGFP+ (from (Tppp3CG/+;R26RtdT;PdgfraH2B-eGFPmice) subpopulations, mRNA was extracted from 800 intact cells per replicate using the SMART-seq v4 Ultra Low Input Kit (Clontech). Amplified cDNAs were sonicated to 300-500bp (Covaris) and libraries were generated by the ThruPLEX™DNA-seq Kit (Rubicon Genomics) for single-end 150bp reads (Next-seq, Illumina). All reads were trimmed to 100bp for comparative purposes. RNA-seq data have been submitted to NCBI GEO (SUB4050561).
Histology
For Hematoxylin and Eosin (H&E) staining, cryo-sections were fixed with 95% EtOH, rinsed with tap water, prior to staining using Hematoxylin Gill II, Scott’s tap water, and Eosin (all from Surgipath), following manufacturer’s protocol. After dehydration with 95% EtOH and 100% EtOH, sections were cleared in Xylene and mounted in Permount (Sigma). For Picrosirius Red staining (Abcam), cryo-sections were first hydrated in tap water then processed according to the manufacturer.
In vitro characterization of tendon subpopulations
Patellar tendons from TMX-injected Tppp3CG/+;R26RtdT;PdgfraH2B-eGFP mice were used. To increase cell viability, dissociated cells were plated on a 10 cm plate in TSPC media and allowed to recover prior to FACS. Sorted subpopulations were cultured 1) in TSPC media to assay for their fate stability, or 2) in MSC growth media (low glucose DMEM supplemented with 10% MSC qualified FBS, 2mM GlutaMax, 5 μg/mL gentamicin (Gibco)), before subjected to multipotential differentiation assays.
1) For cell fate stability, all subpopulations were seeded in TSPC media with daily media change:
H2B-eGFP+tdT+ tendon stem cells:
Cells were fixed at 24 h, 72 h and 120 h with 2% PFA and stored at 4°C in PBS. Immunofluorescence for GFP and tdT was used to determine the cell fractions expressing these markers. Additional wells at 120 h were stained with anti-TPPP3 or with anti-PDGFRα to confirm endogenous protein expression.
H2B-eGFP+tdT− T-FAPs:
Media were supplemented with PBS (control) or 10 μM 4-hydroxytamoxifen for 24 h intervals: 0-24 h, 48-72 h, and 96-120 h to assess tdT expression. Immunofluorescence for GFP and tdT were applied to samples of these time points; anti-TPPP3 were used to confirm negative expression of endogenous TPPP3 (Extended Data 6b). The concentration and duration of 4-hydroxytamoxifen were determined to be efficient for inducing tdT expression.
tdT+H2B-eGFP− cells:
Live images were taken every 24 h until 96 h to assess tdT and H2B-eGFP signals. Anti-TPPP3 antibodies were used to determine the maintenance of endogenous TPPP3 expression (Extended Data 6b).
Tile scan images of each well were captured on the Leica TCS SP8 and the conversion index was calculated using automated filtering and thresholding in Imaris (Bitplane).
2) For multipotential differentiation assays, each sub-population was subjected to culturing and differentiation conditions per murine MSCs12. Murine MSCs (Invitrogen) were used as a positive control in parallel. For adipogenesis and chondrogenesis, cells were expanded in MSC growth media. For osteogenesis, cells were expanded in osteogenic growth media (αMEM, 20% MSC qualified FBS, 2 mM GlutaMax, 100 U/mL Penicillin-Streptomycin (Gibco), 10 nM Dexamethasone (Sigma)). At 80% confluency, cells were trypsinized, pelleted and seeded for assay.
Adipogenesis:
Cells were incubated for 24 h in MSC growth media before switched to Adipogenic Differentiation Media (Gibco StemPro™Adipogenesis Differentiation Kit, Life Technologies). At d 14, cells were stained with Oil Red O. Non-differentiation control was maintained in MSC growth media.
Chondrogenesis:
Cells were incubated for 24 h in MSC growth media before switched to Chondrogenic Differentiation Media (Gibco StemPro™Chondrogenic Differentiation Kit, Life Technologies). At d16, cells were stained with Safranin O or Alcian Blue pH 1. Non-differentiation control was maintained in MSC growth media.
Osteogenesis:
Cells were grown to confluency in osteogenic growth media before switched to osteogenic induction media (αMEM, 20% MSC qualified FBS, 2mM GlutaMax, 100 U/mL Penicillin-Streptomycin, 200 ng/mL BMP2 (Gibco), 10nM Dexamethasone, 100μM Ascorbic acid 2-phosphate sesquimagnesium (Sigma), 2mM β-Glycerophosphate (EDM Millipore). After 21 d, cells were stained with 2% Alizarin Red S pH 4.2 (Sigma).
Transmission electron microscopy (TEM) sample preparation and analyses
Patellar tendons were isolated at 30 dpi from Tppp3CG/+;R26RtdT;Pdgfra+/+ (Control Injured, CI) and Tppp3CG/+;R26RtdT;Pdgfrafl/fl (conditional Knockout Injured, cKO I) mice. Tppp3CG/+;R26RtdT;Pdgfra+/+ tendons were used for control uninjured (CU). Knee joints were isolated and fixed as described17, 56 with modifications: 1) fixative in 0.05M phosphate buffer pH 7.4 in lieu of Dulbecco’s serum-free media, 2) rinses with PBS, 3) post-fixation with 1% OsO4 + 1% KFeCN in PBS followed by H2O rinse, 0.05M Maleate pH 6.5, 0.5% UAc in Maleate, and 4) samples were polymerized for 5 d. TEM images of transverse sections were collected at several magnifications for evaluation. Collagen fibril diameters were measured using Fiji; 6 representative images were analyzed for each tendon (n= 4 per group) and a total of 1000 fibrils analyzed per sample except for cKO I samples, 150 fibrils at the edge of the hole. Cross-sections were taken from the central third (location of biopsy punch) of the Patellar tendon.
Confocal Imaging
Tile scan images were captured using a Leica TCS SP8 X equipped with a Leica 40X/1.30 objective using Leica LAS-X software. The entire tendon section was imaged at 1 μm z-steps. Imaris (Bitplane) was used for 3D reconstruction, surface rendering and automated cell counting. Average length and thickness of P90 Patellar tendon sagittal section is 3,250 μm and 300 μm, respectively. Injury domain/area was defined by EdU boundary or tdT boundary within midsubstance.
Whole Mount Multiphoton Imaging
Isolated Patellar tendons were fixed in 10% neutral, buffered formalin (Sigma) at room temperature 30-60’ nutating, washed over 1 h with PBS, mounted in 1.2% low melt agarose (SeaPlaque) in PBS onto Fluorodish glass bottom dish (World Precision Instruments, Inc., FD35-100) and flattened by a 12 mm round cover glass (Fisher Scientific). Optical sections were captured at 1 μm steps to a total depth of 100-150 μm using an inverted Leica TCS SP5 II, equipped with a Leica 25x/0.95 water objective and Chameleon Vision Laser (Coherent) tuned to 925 nm. SHG, ScxGFP, and tdT signals were captured using external detection filters at the ranges of 430-480 nm, 500-550 nm, and 565-605 nm, respectively. For these image acquisitions, Leica LAS software was used.
Light and Polarized Light Imaging
Images of histological sections were taken on a Nikon Eclipse E800 scope with Plan Fluor Apo objectives (magnification/numerical aperture: 4x/0.13, 10x/0.45, 20x/0.75). For picrosirius red, a polarizer was used at 90° relative to incident light. Images for adipogenesis and osteogenesis were taken on a Zeiss Axiovert25 scope equipped with 20x/0.3 phase objective. Images for chondrogenesis were taken on a Zeiss Stemi SV 11 Apo scope equipped with a S1.0x objective. For these image acquisitions, Canon EOS Rebel T3i cameras and EOS Utility software were used.
Code availability
Programming code for RNA-seq analysis has been deposited to GitHub (https://github.com/ciwemb/fan-2019-tendon).
Statistics and reproducibility
Data are represented as the mean ± SEM (error bars) of 3–5 biological replicates, except for uninjured and regenerated RNA-seq data (2 technical replicates from 14 tendons; each n represents a pooled average) and uninjured tdT+H2B-eGFP- and tdT+H2B-eGFP+ RNA-seq data (3 technical replicates from 24 tendons; each n represents a pooled average). Statistical analyses were performed using Excel or GraphPad Prism 7 by unpaired two-tailed Student t-test, Chi-squared test, two-way ANOVA, Ingenuity Pathway Analysis (Qiagen), Cufflinks package57, DESeq package58, (Loupe Cell Browser/Cell Ranger (10X Genomics), Seurat package59, and Monocle 2 package39 (stipulated in legends). For the unpaired two-tail Student’s t-test, specific values are labeled on plots or appear in legends. For the Chi-square test, ## P < 0.01, non-significant equals P > 0.05. For RNA-seq, False Discovery Rate adjusted q-value < 0.05 determined by RNA-seq analysis package (Cufflinks or DESeq as specified) was considered significant. All data were included in the statistical analyses.
Data availability
RNA–seq and scRNA-seq data that support the findings of this study have been deposited at NCBI under accession code SUB4050561. Previously published sequencing data that were re-analysed here are available under accession code GSE89663. All other data supporting the finds of this study are available from the corresponding author upon reasonable request.
Extended Data
Extended Data 1. Tppp3CG driver is TMX dependent.
a, Cells expressing ≥1 UMI of Acta2 from (Fig. 1a). b, Cartoon summary (right) from cell atlas (Fig. 1a) and immunofluorescence (Fig. 1b); midsubstance (maroon), sheath (gray), and key (left). c, Fluorescence images of Tppp3CG/+;R26RtdT tendon; upper, no TMX control with anti-GFP antibody (Ab.); middle, +TMX and Ab.; lower, +TMX and no Ab. control–eGFP expressed by the Tppp3CG driver is only detectable with Ab. staining; n=3. Tppp3CG driver labels 38.3±2.6 (Mean±SEM)% of sheath cells. d, Tppp3CG driver labeling efficiency is 79.5±3.4 (Mean±SEM)%; n=3 animals; N=9 samples/n. e, Fluorescent images of Tppp3CG/+;R26RtdT tendons: digit flexor (leftmost), tail (left), Achilles (right) or Patellar (rightmost); TMX pulsed at embryonic day (E)15.5 and chased to E17.5; Col I, collagen-I antibody stained; dashed line, midsubstance-sheath boundary; n=3 animals/tendon. f, Fluorescent images of Tppp3CG/+;R26RtdT Patellar tendon; TMX pulsed at postnatal day (P)5 and chased to P8; dashed line, midsubstance-sheath boundary; n=3 animals. g, Sheath cell fractions (key; right) over time; n=3 animals/time point; N=3 samples/n; all ns; mean for (Negative, eGFP+, tdT+, and eGFP+tdT+) at specified time: (P8; 0.636, 0.104, 0, 0.260), (P30; 0.627, 0.104, 0, 0.269), (P90; 0.602, 0.089, 0, 0.308). h, Midsubstance cell fractions (key same as g) over time; n=3 animals/time point; N=3 samples/n; all ns; mean for (Negative, eGFP+, tdT+, and eGFP+tdT+) at specified time: (P8; 0.994, 0, 0, 0.006), (P30; 0.991, 0, 0.001, 0.008), (P90; 0.984, 0, 0.001, 0.015). i, Midsubstance cell fractions (key; right) over time; n=3 animals/time point; N=9 samples/n; all non-significant by Chi-square test; mean for (Negative, eGFP+, tdT+, and eGFP+tdT+) at specified time: (5d; 0.961, 0.004, 0, 0.035), (3M; 0.849, 0.003, 0, 0.148), (6M; 0.929, 0, 0, 0.071), (10M; 0.920, 0.009, 0, 0.071). j, Wholemount multiphoton images of uninjured and biopsy punched (immediately after (T0)) Patellar tendon; n=3; collagen fibers visualized by second harmonic generation (SHG). k, Regenerated tendon immuno-stained for Tenascin-C (TNC); asterisks, proliferated Tppp3-lineage cells in TNC matrix of midsubstance; ^, self-renewed Tppp3-lineage in sheath with lower TNC signal; n=3. (l, m) Zoomed in FMOD images from Fig. 1g; n=3 independent repeats; asterisks, proliferated Tppp3-lineage in midsubstance (l); ^, self-renewed Tppp3-lineage in sheath (m). Scale bar = 30 (c), 15 (flexor) 50 (tail, Achilles, Patellar) (e), 40 (f), 200 (j), 50 (k), 10 (l, m) μm. Error bars = SEM (g, h, i). Two-tailed Student’s t-test (g, h).
Extended Data 2. Tppp3ECE and ScxGFP allow for compartmental molecular characterization.
a, Tppp3ECE/+;R26RtdT;ScxGFP tendon showed TMX-dependent cell marking (tdT+) in sheath; n=3. Given the proportion of labeled sheath cells (22.7 ± 3.7 (Mean±SEM) %) relative to Tppp3CG, Tppp3ECE driver labeling efficiency is ~60%; dashed line, midsubstance-sheath boundary. ScxGFP signal was detected without antibody–not every midsubstance cell is ScxGFP+. b, Fractions of sheath tdT+ScxGFP+ cells at given dpi; n=3 animals/time point, N=3 samples/n; mean per time-point (3d, 7d, 14d, 21d, 28d) as follows: (0.034, 0.262, 0.062, 0.035, 0.058). c, Midsubstance images at specified regeneration windows related to Fig. 2b, n=3 independent repeats. d, Bar graph (top) for average number of midsubstance tdT+ cells at specified time point; mean at specified time-point (3d, 7d, 14d, 21d, 28d): (74.9, 148, 367.6, 387.1, 326.7). Line graph (bottom) for % of proliferated (EdU+) midsubstance Tppp3-lineage marked and ScxGFP+ cells (keys, upper right); n=3 animals/time point, N=3 samples/n; comparisons for a, tdT+ScxGFP− vs tdT+ScxGFP+, b, tdT+ScxGFP− vs tdT−ScxGFP+, c, tdT+ScxGFP+ vs tdT−ScxGFP+ at 28 d; all other time comparisons not-significant. e, Regeneration assay for 30 d with daily EdU throughout; n=3 animals/condition, N=3 samples/n: asterisks, tdT+ScxGFP+EdU+ cells in midsubstance; <, tdT+EdU+ cells in sheath. Below, quantified sheath and midsubstance cell fractions (key; right) in uninjured (U) and injured (I) conditions; Chi-squared test ## P < 0.01. t-test, in parentheses following specified cell fraction in paired order of Sheath Uninjured-Sheath Injured and Midsubstance Uninjured-Midsubstance Injured: Negative (P=0.0077, P=0.299), ScxGFP+ (P=0.332, P=3.63E-07), tdT+ (P=0.0022, P=8.32E-08), tdT+ScxGFP+ (P=0.068, P=3.06E-08). Mean for (Negative, ScxGFP+, tdT+, and tdT+ScxGFP+) fractions for specified condition as follows: (Sheath U; 0.723, 0, 0.277, 0), (Sheath I; 0.751, 0.001, 0.242, 0.006), (Midsubstance U; 0.145, 0.854, 0, 0.001), (Midsubstance I; 0.188, 0.485, 0.143, 0.184). f, Fluorescent images of FACS isolated cells from 30 d regenerated Tppp3ECE/+;R26RtdT;ScxGFP tendons related to Fig. 2c, n=3 independent repeats. g, Averaged, normalized log10 counts from DESeq comparison between tdT+ScxGFP+ and tdT−ScxGFPr+ cells: arranged in boxes by transcription factors (blue), collagens (green), and proteoglycans/glycoproteins (magenta); q-value < 0.05 (*). h, Table for selected gene categories: log2(fold-change) directionality of enrichment in tdT+ScxGFP+r (yellow) versus uninjured tdT+ (red) cells; n=2 samples. Unpaired two-tail Student’s t-test (b, d, e); error bars = SEM (b, d, e); scale bars= 30 (a, c), 50 (e, f) μm.
Extended Data 3. Novel sub-compartmental markers, pathway analysis, and additional pseudotime trajectories.
a, Immunofluorescence of novel sheath markers (LAMININ for Lama4; SCA-1 for Ly6a/e; PLIN for Plin2) identified in Fig. 3b; dashed line, midsubstance-sheath boundary; n=3 independent repeats; scale bar = 50 μm. b, Table for genes in selected matrix categories from Fig. 3a; same organization as for Fig. 3b, n=2 replicates. c, Table for differentially expressed signaling pathway genes from Fig. 3a, n=2 replicates. d, Canonical Pathways list generated by Ingenuity Pathway Analysis® (IPA) on DE analysis gene list filtered by q-value < 0.05; positive z-score (orange) indicates predicted activation; PDGF signaling (red boxed) and its downstream effector branches ERK/MAPK and PI3K/AKT are enriched (indicated by asterisks), n=2 replicates. e, Relative expression of genes (as indicated) plotted in pseudotime, colored by state, and with expression level trend (line), related to Fig 3d.
Extended Data 4. Tppp3+Pdgfra+ sub-population has tenogenic propensity.
a, Novel Sheath markers: Log10 gene expression level specified per individual cell plotted in pseudotime trajectory of cluster 2 and 4 cells. Red circles (enrichment in state 1), correlating with Tppp3 and Pdgfra (Fig. 3d), suggesting a unique role for state 1-Tppp3+Pdgfra+ cells (see Fig. 3d). b, Fluorescent images of Tppp3ECE/+;R26RtdT;PdgfraH2B-eGFP tendon 5 d after TMX-induced marking; n=3; dashed line, midsubstance-sheath boundary; yellow arrowheads, tdT+H2B-eGFP+ cells; red arrowheads, tdT+H2B-eGFP−; green arrowheads, tdT−H2B-eGFP+; blue arrowheads, negative; direct fluorescent imaging to visualize GFP signal from PdgfraH2B-eGFP. c, Relative cell fractions (keys; bottom) within Tppp3+(tdT+) population (bar graph) and within the sheath (pie chart) from data in (b); n=3 animals, N=3 samples/n; mean(%)=(tdT+H2B-eGFP+, 59.1; tdT+H2B-eGFP−, 40.9). d, (Left) Fluorescent images of Tppp3CG/+;R26RtdT;PdgfraH2B-eGFP Achilles or tail tendon 5 d after TMX-induced marking; n=3 animals; dashed line, midsubstance-sheath boundary; arrowheads same code as b; direct fluorescent imaging to visualize GFP signal from PdgfraH2B-eGFP. (Right) Bar graph of fraction of sheath cell populations across respective tendon types; A, Achilles; P, Patellar; T, tail; circles represent individual n; mean per specified population (Negative, tdT+H2B-eGFP−, tdT+H2B-eGFP+, tdT−H2B-eGFP+) in tendon type (A; 0.242, 0.134, 0.175, 0.448), (P; 0.428, 0.144, 0.229, 0.199), (T; 0.442, 0.047, 0.143, 0.368). e, Stem cell (Tppp3+PDGFRα+) recombination efficiency per Tppp3 driver; Tppp3CG efficiency is 77.0±1.6 (Mean±SEM)% and Tppp3ECE efficiency is 56.1±2.9 (Mean±SEM)%; determined in situ by tdT+ co-localization with anti-TPPP3 antibody+PDGFRaH2BeGFP+ cells; circles represent n; n=4 samples. f, Bar graph of proliferation indices from entrant populations corresponding to Fig. 4f, all comparisons non-significant; circles indicate n; n=3 animals, N=3 samples/n; mean (%) per population (tdT+Pdgfra−, 43.0 ; tdT+Pdgfra+, 51.8; tdT−Pdgfra+, 42.0). g, Fluorescent images of midsubstance with specified treatment on Tppp3ECE/+;R26RtdT;ScxGFP tendon; n=3 independent repeats. Error bars = SEM (c, d, e, f); scale bar = 30 (d, g), 50 (b) μm; two-tailed Student’s t-test (d, f).
Extended Data 5. PDGFRα signaling is required for regeneration but not for homeostasis.
a, Immunofluorescence for indicated sheath markers on Tppp3CG/+;Pdgfrafl/fl tendon with same experimental scheme as (Fig. 6c) except for without punch and EdU; n=3; dashed line, midsubstance-sheath boundary. b, Experimental scheme and fluorescent images of R-control, Tppp3CG/+;R26RtdT, and R-cKO, Tppp3CG/+;R26RtdT;Pdgfrafl/fl; chased 30 d after TMX; n=3-4/condition; EdU daily throughout; dashed line, midsubstance-sheath boundary; asterisk, tdT+EdU+ cell. c, Fluorescent images of Rcontrol and R-cKO of sheath compartment in regenerate area; harvested at 14 dpi and EdU daily throughout; n=3 (R-control), 4 (R-cKO) animals/condition; dashed line, midsubstance-sheath boundary; arrowheads, eGFP−tdT+ cells. Stacked column for the distribution (in %) of various cell populations (keys at side); mean (%) for specified population (Negative, eGFP+, tdT+, eGFP+tdT+) as follows: (R-control; 48.3, 8.0, 2.2, 41.5), (R-cKO; 53.0, 15.1, 10.6, 21.2). Bar graph for average number of sheath cells per injury area; mean = (R-control, 1013; R-cKO, 667). d, Controls for SCX immunofluorescence; anti-SCX antibody reacts strongly to midsubstance cells (arrowheads); n=3 independent repeats. e, Fluorescent micrographs of ScxGFP tissue stained with anti-SCX antibody, 93.6±1.9 (mean±SEM) % of ScxGFP+ cells are anti-SCX+; n=3 independent repeats; dashed line, midsubstance-sheath boundary; arrowheads, anti-SCX+ScxGFP+ cells. f, Stacked columns for the distribution (in %) of various cell populations (keys at side); n=3 animals; mean (%) per population (tdT−, tdT+) as indicated: R-control (16.7, 16.8), R-cKO (32.7, 13.8). Unpaired two-tail Student’s t-test (c, f); error bars = SEM (c, f); scale bar = 20 (d, e), 30 (b), 50 (a, c) μm.
Extended Data 6. Sheath subpopulations exhibit little conversion in vitro.
a, Fluorescent micrographs of purified tdT+H2B-eGFP+ cultured for 24 h in TSPC conditions stained with anti-PDGFRα or anti-TPPP3. b, Fluorescent micrographs of anti-TPPP3 antibody validation on cultured sub-populations. n=3 independent repeats (a, b). Scale bars = 100 (b), 200 (a) μm.
Extended Data 7. Example of FACS gating strategy.
Cells were selected in FSC/SSC dot plot to remove debris; single cells were gated using the FSC-H/FSC-W dot plot. GFP+ (FITC-A), tdT+ (PE-A) cells were gated and compared with a control sample without tamoxifen induction or carrying ScxGFP. Tomato+-only cells were gated from tomato+GFP+ cells by population segregation.
Supplementary Material
Supplementary Table 1
Differentially expressed genes per cell cluster from scRNA-seq data (see Fig.1a, n = 2,451 cells) derived from Loupe Cell Browser using CellRanger clustering and statistical ranking. Average, normalized UMI counts per each gene ID (with corresponding color code in Fig.1a) listed as well as cluster log2fold enrichment value, cluster assignment number and cell type identity.
Supplementary Table 2
Mouse alleles used in this study with abbreviated name as appears in the manuscript as well as full name. Allele supplier indicated as well as stock number and citation (where applicable).
Supplementary Table 3
Primary antibodies used in this study with dilution factors and special conditions for antigen retrieval indicated.
Acknowledgements
We thank the Fan lab members and C Lepper for critical reading of the manuscript. We also thank S Satchell for technical assistance, C Lepper and Y Bai for assistance with FACS and Ronen Schweitzer for invaluable advice and sharing the ScxGFP mice. This research was supported by Carnegie Institution for Science. C.-M.F. is supported by the NIH (grant nos. R01AR060042, R01AR071976 and R01AR072644) and the Carnegie Institution for Science.
Footnotes
The authors declare no competing financial interests.
Competing Interests
The authors declare no conflicts of interest.
Additional Information
Supplementary Information is available in the online version of the paper, including Extended Data 1–7 and legends, Supplementary Tables 1–3 and legends, and Source Data; references unique to these sections appear only therein.
References
- 1.Elliott DH. (1965) Structure and Function of Mammalian Tendon. Biol Rev Camb Philos Soc. 40:392–421. [DOI] [PubMed] [Google Scholar]
- 2.Voleti PB, Buckley MR, Soslowsky LJ. (2012) Tendon Healing: Repair and Regeneration. Annu Rev Biomed Eng 14: 47–71. [DOI] [PubMed] [Google Scholar]
- 3.Jozsa L and Kannus P. Human Tendons: Anatomy, Physiology and Pathology. Champaign: Human Kinetics, 1997. Print. [Google Scholar]
- 4.Harvey T and Fan C-M (2018) Origins of tendon stem cells in situ. Front Biol 13(4): 263–276. DOI: 10.1007/s11515-018-1504-4 [DOI] [Google Scholar]
- 5.Howell K, et al. (2017) Novel model of tendon regeneration reveals distinct cell mechanisms underlying regenerative and fibrotic tendon healing. Sci Rep 7(45238): DOI: 10.1038/srep45238 [DOI] [PMC free article] [PubMed] [Google Scholar]
- 6.Loiselle AE et al. , (2009) Remodeling of murine intrasynovial tendon adhesions following injury: MMP and neotendon gene expression. J Orthop Res 27(6):833–40. DOI: 10.1002/jor.20769 [DOI] [PMC free article] [PubMed] [Google Scholar]
- 7.Kim HM et al. , (2010) Technical and biological modifications for enhanced flexor tendon repair. J Hand Surg Am 35(6):1031–7. DOI: 10.1016/j.jhsa.2009.12.004 Review [DOI] [PMC free article] [PubMed] [Google Scholar]
- 8.Juneja SC, Schwarz EM, O’Keefe RJ, Awad HA. (2013) Cellular and molecular factors in flexor tendon repair and adhesions: a histological and gene expression analysis. Connect Tissue Res 54(3):218–26. DOI: 10.3109/03008207.2013.787418 [DOI] [PMC free article] [PubMed] [Google Scholar]
- 9.Manning CN et al. , (2014) The early inflammatory response after flexor tendon healing: a gene expression and histological analysis. J Orthop Res 32(5):645–52. DOI: 10.1002/jor.22575 [DOI] [PMC free article] [PubMed] [Google Scholar]
- 10.Loiselle AE, Kelly M, Hammert WC. (2016) Biological augmentation of flexor tendon repair: a challenging cellular landscape. J Hand Surg Am. 41(1):144–9. DOI: 10.1016/j.jhsa.2015.07.002 Review [DOI] [PubMed] [Google Scholar]
- 11.Lin TW, Cardenas L, Glaser DL, Soslowsky LJ. (2006) Tendon healing in interleukin-4 and interleukin-6 knockout mice. J Biomech 39:61–69. DOI: 10.1016/j.jbiomech.2004.11.009 [DOI] [PubMed] [Google Scholar]
- 12.Bi Y, et al. (2007) Identification of tendon stem/progenitor cells and the role of the extracellular matrix in their niche. Nature Med 13(10):1219–1227. DOI: 10.1038/nm1630 [DOI] [PubMed] [Google Scholar]
- 13.Dyment NA and Galloway JL. (2015) Regenerative biology of tendon: mechanisms of renewal and repair. Curr Mol Bio Rep 1:124–131. DOI: 10.1007/s40610-015-0021-3 [DOI] [PMC free article] [PubMed] [Google Scholar]
- 14.Fiel R, Wagner J, Metzger D and Chambon P. (1997) Regulation of Cre Recombinase Activity by Mutated Estrogen Receptor Ligand-Binding Domains. Biochem Biophy Res Commun 237(3): 752–757. DOI: 10.1006/bbrc.1997.7124 [DOI] [PubMed] [Google Scholar]
- 15.Madisen L, et al. (2010) A robust and high-throughput Cre reporting and characterization system for the whole mouse brain. Nat Neurosci 13(1):133–40. DOI: 10.1038/nn.2467 [DOI] [PMC free article] [PubMed] [Google Scholar]
- 16.Dyment NA, et al. (2014) Lineage tracing of resident tendon progenitors during growth and natural healing. PLoS One 9(4):e96113 DOI: 10.1371/journal.pone.0096113 [DOI] [PMC free article] [PubMed] [Google Scholar]
- 17.Howell K, et al. (2017) Novel model of tendon regeneration reveals distinct cell mechanisms underlying regenerative and fibrotic tendon healing. Sci Rep 7(45238): DOI: 10.1038/srep45238 [DOI] [PMC free article] [PubMed] [Google Scholar]
- 18.Ansorge HL, Adams S, Birk DE, Soslowsky LJ (2011) Mechanical, compositional, and structural properties of the post-natal mouse Achilles tendon. Ann Biomed Eng 39(7): 1904–1913. DOI: 10.1007/s10439-011-0299-0 [DOI] [PMC free article] [PubMed] [Google Scholar]
- 19.Beason DP, Kuntz AF, Hsu JE, Miller KS, Soslowsky LJ. (2012) Development and evaluation of multiple tendon injury models in mouse. J Biomech 45(8):1550–1553. DOI: 10.1016/j.jbiomech.2012.02.022 [DOI] [PMC free article] [PubMed] [Google Scholar]
- 20.Staverosky JA, Pryce BA, Watson SS, Schweitzer R. (2013) Tubulin Polymerization-Promoting Protein Family Member 3, Tppp3, is a specific marker of the differentiating tendon sheath and synovial joints. Dev Dyn 238: 685–692. DOI: 10.1002/dvdy.21865 [DOI] [PubMed] [Google Scholar]
- 21.Wang Y, et al. (2017) Osteocalcin expressing cells from tendon sheaths in mice contribute to tendon repair by activating Hedgehog signaling. eLife 6: e30474 DOI: 10.7554/eLife.30474 [DOI] [PMC free article] [PubMed] [Google Scholar]
- 22.Chen J, Renia L, Ginhoux F. 2017. Constructing cell lineages from single-cell transcriptomes. Mol Aspects Med 59: 95–113. DOI: 10.1016/j.mam.2017.10.004 [DOI] [PubMed] [Google Scholar]
- 23.Uezumi A, Fukada S, Yamamoto N, Takeda S, Tsuchida L. (2010) Mesenchymal progenitors distinct from satellite cells contribute to ectopic fat cell formation in skeletal muscle. Nat Cell Biol 12(2): 143–52. DOI: 10.1038/ncb2014 [DOI] [PubMed] [Google Scholar]
- 24.Joe AW, Yi L, Natarajan A, Le Grand F, So L, Wang J, Rudnicki MA, Rossi FM. (2010) Muscle injury activates resident fibro/adipogenic progenitors that facilitate myogenesis. Nat Cell Biol 12(2):153–63. DOI: 10.1038/ncb2015 [DOI] [PMC free article] [PubMed] [Google Scholar]
- 25.Ameye L, et al. (2002) Abnormal collagen fibrils in tendons of biglycan/fibromodulin-deficient mice lead to gait impairment, ectopic ossification, and osteoarthritis. FASEB 16(7): 673–680. DOI: 10.1096/fj.01-0848com [DOI] [PubMed] [Google Scholar]
- 26.Jepsen KJ, et al. (2002) A syndrome of joint laxity and impaired tendon integrity in lumican- and fibromodulin-deficient mice. Jour Biol Chem 277(8): 35532–35540. DOI: 10.1074/jbc.M205398200 [DOI] [PubMed] [Google Scholar]
- 27.Docheva D, Hunziker EB, Fassler R, Brandau O. (2005) Tenomodulin is necessary for tenocyte proliferation and tendon maturation. Mol Cell Bio 25(2): 699–705. DOI: 10.1127/MCB.25.2.699-705.2005 [DOI] [PMC free article] [PubMed] [Google Scholar]
- 28.Hauser N, Paulsson M, Kale AA, DiCesare PE. (2003) Tendon extracellular matrix contains pentameric thrombospondin-4 (TSP-4). FEBS Letters 368:307–310. DOI: 10.1016/0014-5793(95)00675-Y [DOI] [PubMed] [Google Scholar]
- 29.Kohrs RT, et al. (2011) Tendon fascicle gliding in wild type, heterozygous, and lubricin knockout mice. J Orthop Res 29(3):384–389. DOI: 10.1002/jor.21247 [DOI] [PubMed] [Google Scholar]
- 30.Evans CJ, et al. (2009) G-TRACE: rapid Gal4-basd cell lineage analysis in Drosophila. Nat Methods 6(8): 603–605. DOI: 10.1038/nmeth.1356 [DOI] [PMC free article] [PubMed] [Google Scholar]
- 31.Pryce BA, Brent AE, Murchison ND, Tabin CJ, Schweitzer R. (2007) Generation of transgenic tendon reporters, ScxGFP and ScxAP, using regulatory elements of the Scleraxis Gene. Dev Dyn 236: 1677–1682. DOI: 10.1002/dvdy.21179 [DOI] [PubMed] [Google Scholar]
- 32.Dyment NA et al. (2013) The paratenon contributes to scleraxis-expressing cells during patellar tendon healing. PLoS One 8(3):e59944 DOI: 10.1371/journal.pone.0059944 [DOI] [PMC free article] [PubMed] [Google Scholar]
- 33.Best KT and Loiselle AE. (2019) Scleraxis lineage cells contribute to organized bridging tissue during tendon healing and identify a subpopulation of resident tendon cells. FASEB J DOI: 10.1096/fj.201900130RR [DOI] [PMC free article] [PubMed] [Google Scholar]
- 34.Kishimoto Y et al. , (2017) Wnt/b-catenin signaling suppresses expression of Scx, Mkx, and Tnmd in tendon-derived cells. PLoS One 12(7):e0182051 DOI: 10.1371/journal.pone.0182051 [DOI] [PMC free article] [PubMed] [Google Scholar]
- 35.D’Souza D and Patel K. (1999) Involvement of long- and short-range signaling during early tendon development. Anat Embryol 200: 367–375. DOI: 10.1007/s004290050286 [DOI] [PubMed] [Google Scholar]
- 36.Dyment NA, et al. (2015) Gdf5 progenitors give rise to fibrocartilage cells that mineralize via hedgehog signaling to form the zonal enthesis. Dev Biol 405: 96–107. DOI: 10.1016/j.ydbio.2015.06.020 [DOI] [PMC free article] [PubMed] [Google Scholar]
- 37.Schwartz AG, Galatz LM, Thomopoulos S. (2017) Enthesis regeneration: a role for Gli+ progenitor cells. Development 144: 1159–1164. DOI: 10.1242/dev.139303 [DOI] [PMC free article] [PubMed] [Google Scholar]
- 38.Heldin C-H and Lennartsson J (2013) Structural and functional properties of platelet-derived growth factor and stem cell factor receptors. Cold Spring Harb Perspect Biol 5(8):a009100 DOI: 10.1101/cshperspect.a009100 [DOI] [PMC free article] [PubMed] [Google Scholar]
- 39.Qiu X, et al. (2017) Reversed graph embedding resolves complex single-cell trajectories. Nat Methods 14(10): 979–982. DOI: 10.1038/nmeth.4402 [DOI] [PMC free article] [PubMed] [Google Scholar]
- 40.Hamilton TG, Klinghoffer RA, Corrin PD, Soriano P. Evolutionary divergence of platelet-derived growth factor alpha receptor signaling mechanisms. Mol Cell Biol 23(11): 4013–25. DOI: 10.1128/MCB.23.11.4013-4025.2003 [DOI] [PMC free article] [PubMed] [Google Scholar]
- 41.Dominici M et al. (2006). Minimal criteria for defining multi-potent mesenchymal stromal cells: The International Society for Cellular Therapy position statement. Cytotherapy 8(4): 315–317. DOI: 10.1080/14653240600855905 [DOI] [PubMed] [Google Scholar]
- 42.Sung JH et al. (2008). Isolation and characterization of mouse mesenchymal stem cells. Transplant Proc 40(8): 2649–2654. DOI: 10.1016/j.transproceed.2008.08.009 [DOI] [PubMed] [Google Scholar]
- 43.Pittenger MF et al. (1999) Multilineage potential of adult human mesenchymal stem cells. 284:143–147. DOI: 10.1126/science.284.5411.143 [DOI] [PubMed] [Google Scholar]
- 44.Franchi M, Trire A, Quaranta M, Orsini E, Ottani V. 2007. Collagen structure of tendon relates to function. Scientific World Journal 7:404–420. DOI: 10.1100/tsw.2007.92 [DOI] [PMC free article] [PubMed] [Google Scholar]
- 45.Richardson SH et al. , (2007) Tendon development requires regulation of cell condensation and cell shape via cadherin-11-mediated cell-cell junctions. Mol Cell Biol 27(17):6218–6228. DOI: 10.1128/MCB.00261-07 [DOI] [PMC free article] [PubMed] [Google Scholar]
- 46.Starborg T et al. , (2013) Using transmission electron microscopy and 3View to determine collagen fibril size and three-dimensional organization. Nat prot 8(7):1433–1448. DOI: 10.1038/nprot.2013.086 [DOI] [PMC free article] [PubMed] [Google Scholar]
- 47.Buschmann J and Bürgisser G. (2017) Biomechanics of tendons and ligaments: tissue reconstruction and regeneration. Duxford: Elsevier [Google Scholar]
- 48.Baksh N, Hannon CP, Murawski CD, Smyth NA, Kennedy JG. (2013) Platelet-rich plasma in tendon models: a systematic review of basic science literature. Arthroscopy 29(3):596–607. DOI: 10.1016/j.arthro.2012.10.025 [DOI] [PubMed] [Google Scholar]
- 49.Evrova O and Buschmann J. (2017) In vitro and in vivo effect of PDGF-BB delivery strategies on tendon healing: a review. Eur Cell Mater 34:15–39. DOI: 10.22203/eCM.v034a0 [DOI] [PubMed] [Google Scholar]
- 50.Rodriguez CI, et al. (2000) High-efficiency deleter mice show that FLPe is an alternative to Cre-loxP. Nat Genet 25:139–140. DOI: 10.1038/75973 [DOI] [PubMed] [Google Scholar]
- 51.Tallquist MD and Soriano P. (2003) Cell autonomous requirement of PDGFRa in populations of cranial and cardiac neural crest cells. Development 130: 507–518. DOI: 10.1242/dev.00241 [DOI] [PubMed] [Google Scholar]
- 52.Liu P, Jenkins NA, Copeland NG. (2003) A highly efficient recombineering-based method for generating conditional knockout mutations. Genome Res 13(3):476–84. DOI: 10.1101/gr.749203 [DOI] [PMC free article] [PubMed] [Google Scholar]
- 53.Wu S, Ying G, Wu Q, Capecchi MR. (2008) A protocol for constructing gene targeting vectors: generating knockout mice for the cadherin family and beyond. Nat protoc 3(6):1056–76. DOI: 10.1038/nprot.2008.70 [DOI] [PubMed] [Google Scholar]
- 54.Matsuda T and Cepko CL. (2007) Controlled expression of transgenes introduced by in vivo electroporation. PNAS 104(3):1027–1032. DOI: 10.1073/pnas.0610155104 [DOI] [PMC free article] [PubMed] [Google Scholar]
- 55.Gronthos S, Mankani M, Brahim J, Robey PG, and Shi S. (2000) Postnatal human dental pulp stem cells (DPSCs) in vitro and in vivo. PNAS 97(25):13625–13630. DOI: 10.1073/pnas.240309797 [DOI] [PMC free article] [PubMed] [Google Scholar]
- 56.Chien et al. (2018) Optimizing a 3D model system for molecular manipulation of tenogenesis. Conn Tissue Res 4:295–308. DOI: 10.1080/03008207.2017.1383403 [DOI] [PMC free article] [PubMed] [Google Scholar]
- 57.Trapnell C, et al. (2012) Differential gene and transcript expression analysis of RNA-seq experiments with TopHat and Cufflinks. Nat Protoc 7(3):562–578. DOI: 10.1038/nprot.2012.016 [DOI] [PMC free article] [PubMed] [Google Scholar]
- 58.Anders S and Huber W. (2010) Differential expression analysis for sequence count data. Gen Biol 11:R106 DOI: 10.1186/gb-2010-11-10-r106 [DOI] [PMC free article] [PubMed] [Google Scholar]
- 59.Satija R, Farrell JA, Gennert D, Schier AF, and Regev A. (2015) Spatial reconstruction of single-cell gene expression. Nat Biotechnol 33(5):495–502. DOI: 10.1038/nbt.3192 [DOI] [PMC free article] [PubMed] [Google Scholar]
Associated Data
This section collects any data citations, data availability statements, or supplementary materials included in this article.
Supplementary Materials
Supplementary Table 1
Differentially expressed genes per cell cluster from scRNA-seq data (see Fig.1a, n = 2,451 cells) derived from Loupe Cell Browser using CellRanger clustering and statistical ranking. Average, normalized UMI counts per each gene ID (with corresponding color code in Fig.1a) listed as well as cluster log2fold enrichment value, cluster assignment number and cell type identity.
Supplementary Table 2
Mouse alleles used in this study with abbreviated name as appears in the manuscript as well as full name. Allele supplier indicated as well as stock number and citation (where applicable).
Supplementary Table 3
Primary antibodies used in this study with dilution factors and special conditions for antigen retrieval indicated.
Data Availability Statement
RNA–seq and scRNA-seq data that support the findings of this study have been deposited at NCBI under accession code SUB4050561. Previously published sequencing data that were re-analysed here are available under accession code GSE89663. All other data supporting the finds of this study are available from the corresponding author upon reasonable request.


