SUMMARY:
Higher-order chromatin organization such as A/B compartments, TADs, and chromatin loops are temporarily disrupted during mitosis1,2. Since these structures are thought to influence gene regulation, it is important to understand how they are re-established after mitosis. We examined the dynamics of chromosome reorganization by Hi-C after mitosis in highly purified, synchronous cell populations. We observed rapid establishment, gradual intensification, and expansion of A/B compartments. Contact domains form from the “bottom-up” with smaller subTADs forming initially, followed by convergence into multi-domain TAD structures. CTCF is partially retained on mitotic chromosomes and immediately resumes full binding at ana/telophase. In contrast, cohesin is completely evicted from mitotic chromosomes and regains focal binding with delayed kinetics. The formation of CTCF/cohesin co-anchored structural loops follows the kinetics of cohesin positioning. Stripe-shaped contact patterns anchored by CTCF grow in length, consistent with a loop extrusion process after mitosis. Interactions between cis-regulatory elements can form rapidly with their rates exceeding those of CTCF/cohesin anchored contacts. Strikingly, we identified a group of rapidly emerging transient contacts between cis-regulatory elements in ana/telophase, that are dissolved upon G1 entry, co-incident with the establishment of inner boundaries or nearby interfering loops. We also describe the relationship between transcription reactivation and architectural features. Our findings indicate that distinct but mutually influential forces drive post-mitotic chromatin re-configuration.
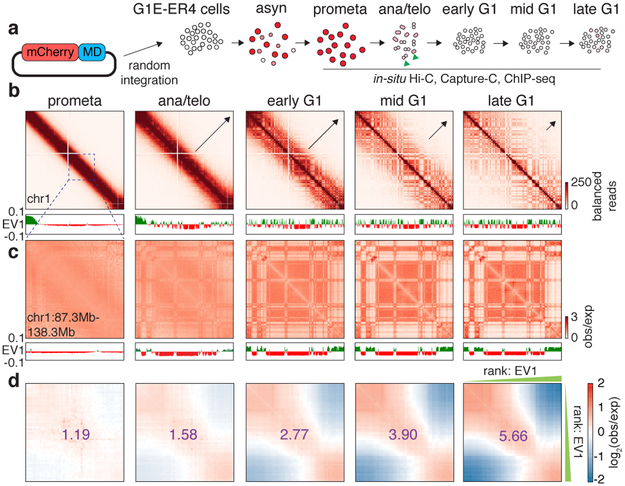
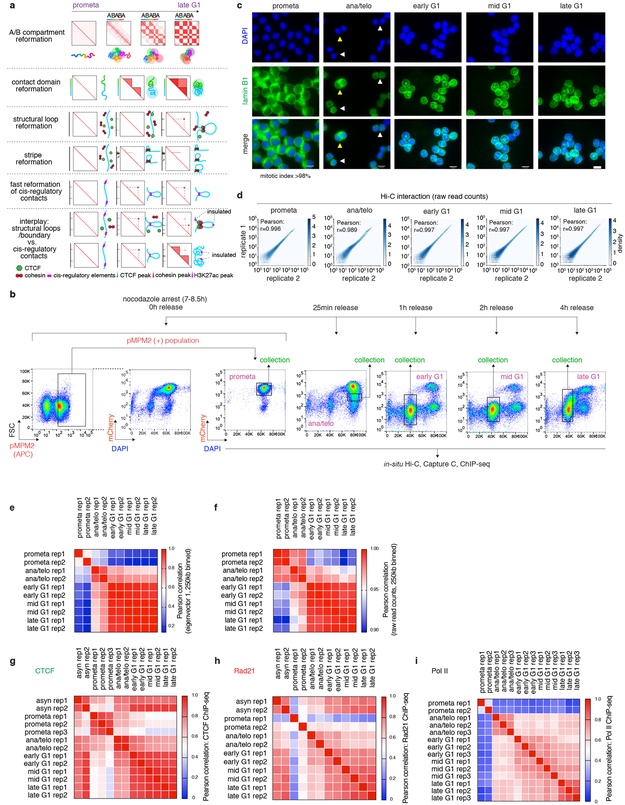
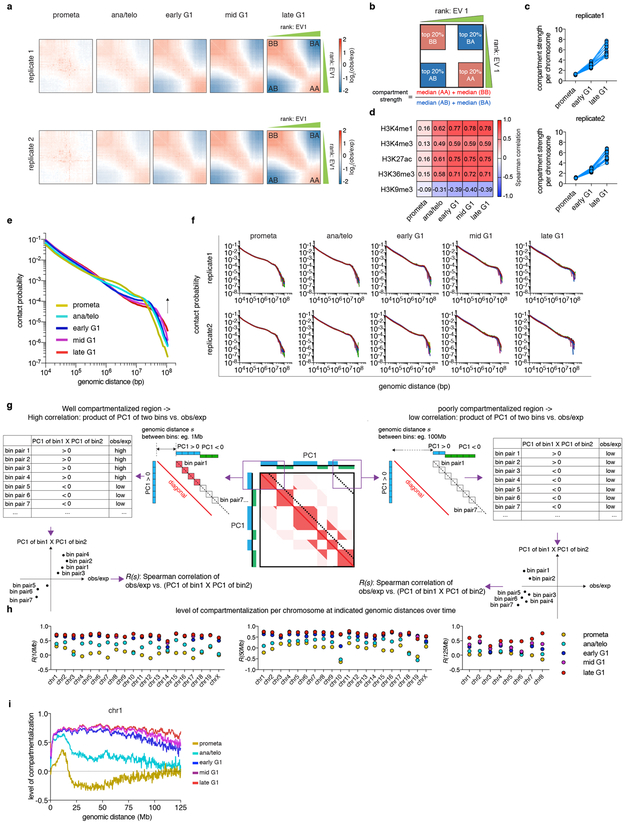
The global restructuring of chromosomal architecture during the progression from mitosis into G1 phase provides an opportunity to examine hierarchies and mechanisms of chromosome organization (Extended Data Fig. 1a) 3. We performed in situ Hi-C experiments 4 at defined time points after mitosis following nocodazole induced prometaphase arrest-release in G1E-ER4 cells, a well-characterized subline of the murine erythroblast line G1E (Fig. 1a) 5. To ensure maximal purity of cell populations, we employed a fluorescence activated cell sorting (FACS) based isolation strategy based on cell cycle markers and DNA content (Extended Data Fig. 1b, c; Supplementary methods). In situ Hi-C collectively yielded ~2 billion uniquely mapped interactions, with high concordance between biological replicates (Extended Data Fig. 1d-f). Consistent with previous studies, compartments are largely eliminated in prometaphase (Fig. 1b) 1,2 . In ana/telophase, the earliest examined interval, compartments are already detectable visually and by eigenvector decomposition, and gain in intensity as cells advance into G1 (Fig. 1b-d, Extended Data Fig. 2a-c), consistent with a previous report of early establishment of compartments after mitosis, using multiplexed 4C-seq 6. As expected, the A-type compartment is associated with active histone marks (Extended Data Fig. 2d) 7. As cells proceed towards late G1, the characteristic checkerboard pattern of compartments visually expands away from the diagonal, leading to elevated interaction frequencies at large (>100Mb) distance scales (Fig. 1b, Extended Data Fig. 2e, f). Quantification of compartmentalization at different genomic distance scales across all cell cycle stages revealed a progressive gain of compartmentalization between distally (>100Mb) separated genomic regions, confirming the expansion of compartments after mitosis (Extended Data Fig. 2g-i; Supplementary methods). Thus, a major re-configuration of genome structure occurs during the prometaphase-G1 phase transition, with a rapid establishment, progressive strengthening, and expansion of A/B compartments throughout the chromosome.
Figure 1 ∣. Early appearance and progressive strengthening and expansion of A/B compartments after mitosis.
a, Schematic showing the reporter gene encoding mCherry-MD and expected mCherry signal at each time point of sample collection. Green arrowheads indicate sorting of cells in anaphase or telophase. b, Hi-C contact maps showing the restoration of chromatin A/B compartments of chromosome 1 after mitosis, along with genome browser tracks showing eigenvector 1 values. Bin size: 250kb. Arrows indicate expansion of compartments. c, A zoomed-in view (chr1: 87.3Mb-138.3Mb) of (b) revealing the clear plaid like compartment pattern in ana/telophase. d, Saddle plots showing genome wide compartment strength (purple numbers) over time.
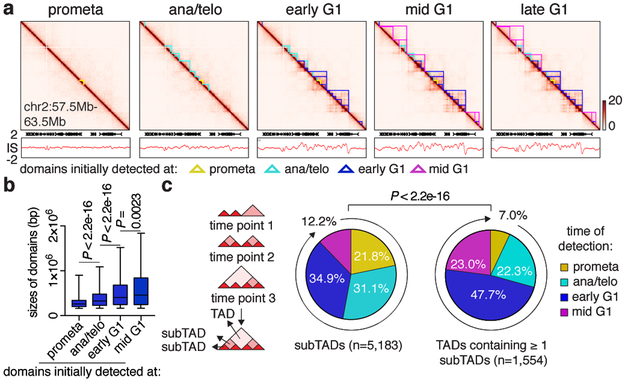
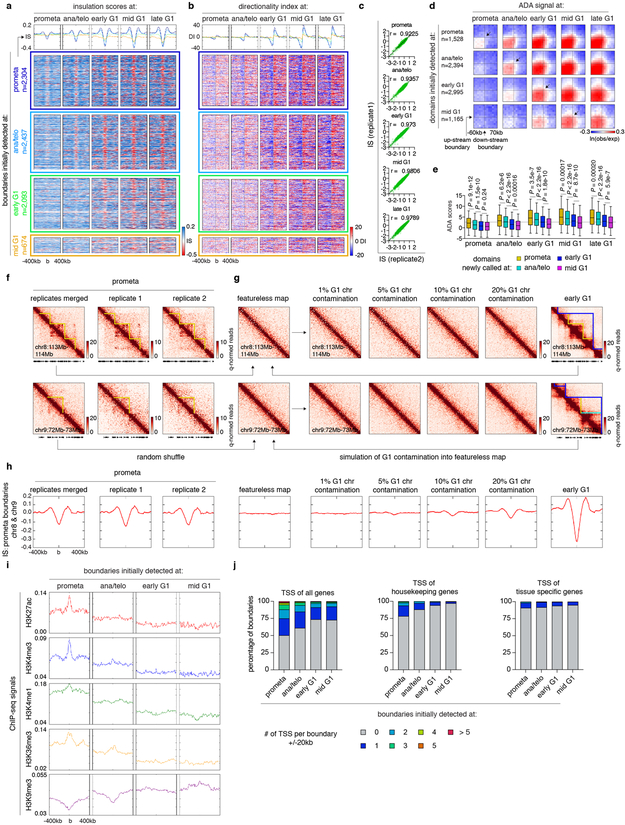
Next, we examined the formation of TADs and nested subTADs after mitosis using 3DNetMod 8. A total of 8,082 contact domains were identified that are progressively gained from prometaphase to mid G1 (Fig. 2a; Supplementary Table 1). Establishment of boundaries and enrichment of intra-domain interactions were observed at newly emerging domains, validating our domain calling approach (Extended Data Fig. 3a-e). Previous studies reported complete loss of domains in prometaphase 1,2. However, despite significant attenuation, residual domain/boundary-like structures are still visually and algorithmically detectable in prometaphase cells (Extended Data Fig. 3f). To rule out G1 cell contamination as a cause of prometaphase domain detection, we simulated in silico contamination with up to 20% of G1 chromosomes. Even 20% of G1 contributions (far exceeding the observed ≤2% interphase cell contamination) did not reproduce patterns observed in prometaphase (Extended Data Fig. 3f-h), suggesting that prometaphase domain/boundary-like features are not likely due to the presence of G1 phase cells. Residual domain boundaries in prometaphase are enriched with active histone marks and transcription start sites (Extended Data Fig. 3i, j) 9.
Figure 2 ∣. Contact domains develop from the bottom up after mitosis.
a, Hi-C contact maps coupled with insulation score tracks (chr2:57.5Mb-63.5Mb). Domains emerging at each cell cycle stage are demarcated by color coded lines. Bin size: 10kb. Color bars denote q-normed reads. b, Sizes of domains newly detected at prometa (n=1,258), ana/telo (n=2,394), early G1 (n=2,995) and mid G1 (n=1,165). For all box plots, center lines denote medians; box limits denote 25-75 percentile; whiskers denote 5-95 percentile. P values were calculated by two-sided Mann-Whitney U test. c, Left: Schematic showing the partition of domains into TADs or subTADs. TADs are domains not encompassed by any other domains. SubTADs are domains completely encompassed by other domains. Right: Pie charts of the cell cycle distribution of subTADs and TADs that contain ≥ 1 subTADs based on their time of emergence. P value were calculated from two-sided Fisher’s exact test (prometa + ana/telo vs. early G1 + mid G1).
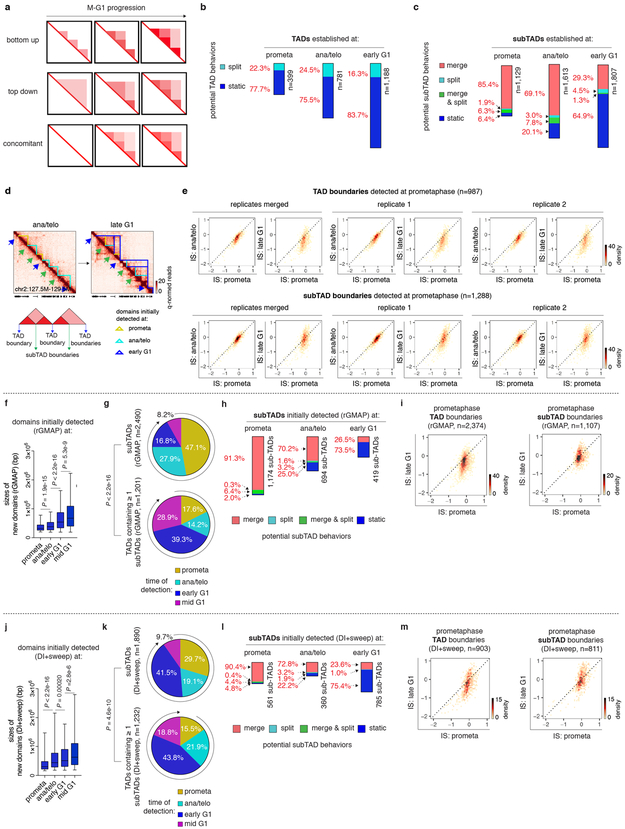
Formation of nested domain structures may occur via convergence of previously emerged subTADs (bottom-up), the partitioning of initially formed TADs into subTADs (top-down), or simultaneous birth of both contact domain types (Extended Data Fig. 4a). On average, contact domains established at time points later in G1 are larger than those called at preceding cell cycle stages (Fig. 2a, b), favoring the bottom-up scenario. To further test this model, we categorized all contact domains into 2,899 TADs and 5,183 subTADs, based on their hierarchical organization (Fig. 2c). Notably, higher proportions of subTADs are detected in prometaphase or ana/telophase compared to TADs that encompass them, suggesting that subTADs tend to assemble more rapidly (Fig. 2c). Once established, the majority of TADs remain unchanged without further sub-divisions, arguing against the “top-down” model (Extended Data Fig. 4b). In contrast, 85.4% and 69.1% of subTADs called in prometaphase and ana/telophase respectively, converge into larger domains during later stages (Extended Data Fig. 4c). In line with subTAD merging, we observed gains in contacts across subTAD boundaries over time (Extended Data Fig. 4d). Accordingly, a significant portion of subTAD boundaries detected at prometaphase display elevated insulation scores (signifying reduced insulation), while for most TAD boundaries, insulation scores decreased as cells progressed from prometaphase into G1 (Extended Data Fig. 4e). Independent algorithms yielded similar trends of subTAD merging after mitosis (Extended Data Fig. 4f-m) 8,10 . Together, these analyses suggest a “bottom-up” model of hierarchical domain re-organization during the prometa- to G1-phase transition.
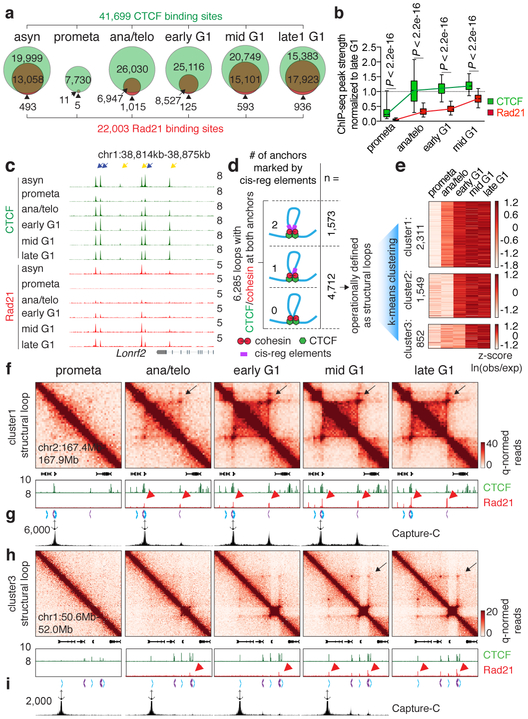
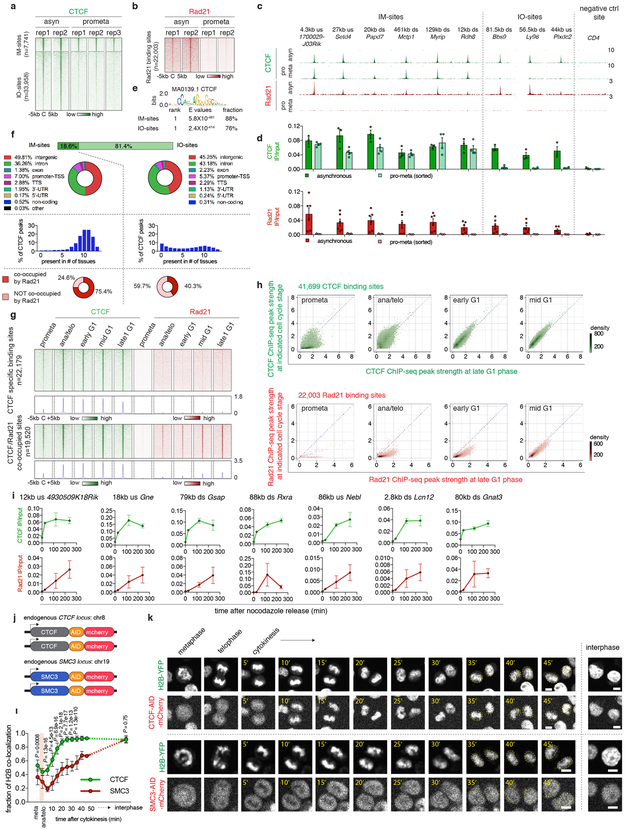
A loop extrusion model has been proposed to explain the formation of TADs and chromatin loops, wherein the cohesin complex extrudes the chromatid until it encounters pairs of convergently oriented CTCF binding sites 11,12. Since cell cycle dynamics of loop formation, CTCF and cohesin binding could inform this (or alternative) models, we surveyed the chromatin binding profiles of CTCF and cohesin by ChIP-seq. We generated highly concordant replicates (Extended Data Fig. 1g, h) and identified 41,699 CTCF and 22,003 Rad21 (a cohesin subunit) binding sites (Supplementary Table 2). ~88.7% (19,520) of Rad21 peaks were co-occupied by CTCF. Interestingly, ~18.6% (7,741) of CTCF peaks are reproducibly detected in prometaphase cells, suggesting significant amounts of CTCF association with mitotic chromatin (Extended Data Fig. 5a, c, d). Prior reports have described varying degrees of CTCF mitotic retention 13,14. Unlike CTCF, Rad21 failed to show localized chromatin binding during prometaphase (Extended Data Fig. 5b-d). Motif scan and genomic distribution analysis failed to identify distinct features associated with CTCF peaks present in interphase and mitosis (IM-peaks) (Extended Data Fig. 5e, f). Nevertheless, IM-peaks are significantly more tissue invariant and more likely to be co-occupied by Rad21 during interphase (Extended Data Fig. 5f). CTCF and cohesin resumed chromatin occupancy after mitosis with markedly different kinetics. The majority of CTCF peaks were immediately restored in ana/telophase, whereas Rad21 peaks became detectable much more gradually (Fig. 3a-c; Extended Data Fig. 5g-i). Delayed nuclear import, chromatin loading and/or movement along the chromatid could account for the slow focal accumulation of cohesin after mitosis. We performed live cell imaging on asynchronous G1E-ER4 cells endogenously expressing mCherry tagged CTCF or SMC3 (a cohesin subunit) (Extended Data Fig. 5j). Consistent with the ChIP-seq data and a previous report 15, CTCF rapidly accumulated on telophase chromosomes, whereas SMC3 was excluded from chromosomes during metaphase, telophase and cytokinesis (Extended Data Fig. 5k). Moreover, nuclear import of SMC3 was also slower compared to CTCF after G1 entry (Extended Data Fig. 5k, l). These results suggest that the delayed kinetics of focal cohesin accumulation may be a composite of nuclear import, association with chromatin, and migration along the chromatid.
Figure 3 ∣. Focal accumulation of cohesin is delayed compared to CTCF and coincides with structural loop formation.
a, Venn diagrams showing CTCF and Rad21 peak distribution across cell cycle stages. b, Box plots showing the recovery rate of CTCF (n=33,306) and Rad21 (n=18,859) peaks. Peaks absent from late G1 were dropped from the analysis. For all box plots, center lines denote medians; box limits denote 25-75 percentile; whiskers denote 5-95 percentile. P values were calculated from two-sided Mann-Whitney U test. c, Genome browser tracks of CTCF and Rad21 at the Lonrf2 loci across cell cycle stages. n=2-3 biological replicates. Blue and yellow arrows indicate IM- and IO-CTCF binding sites, respectively. d, Schematic depicting classification of loops. All loops with CTCF/cohesin co-occupancy at both anchors were sub-divided into those with 0, 1, or 2 anchors marked by cis-regulatory elements. Those with 0 or 1 were operationally defined as structural loops. e, Heatmap showing result of k-means clustering on the 4,712 structural loops. f, Hi-C contact maps showing a representative region that contains a cluster 1 structural loop (chr2:167.4Mb-167.9Mb, black arrows), along with genome browser tracks of CTCF and Rad21 ChIP-seq profiles. Rad21 peaks at two loop anchors are indicated by red arrowheads. Chevron arrows highlight positions and orientations of CTCF sites at the loop anchors. Bin size: 10kb. g, Capture-C interaction profile of the same region as shown in (f). n=3 biological replicates. Anchor symbol shows position of the capture probe. h-i, similar to (f-g) showing a representative region that contains a cluster 3 (slowly emerging) structural loop (chr1:50.6Mb-52.0Mb, black arrows).
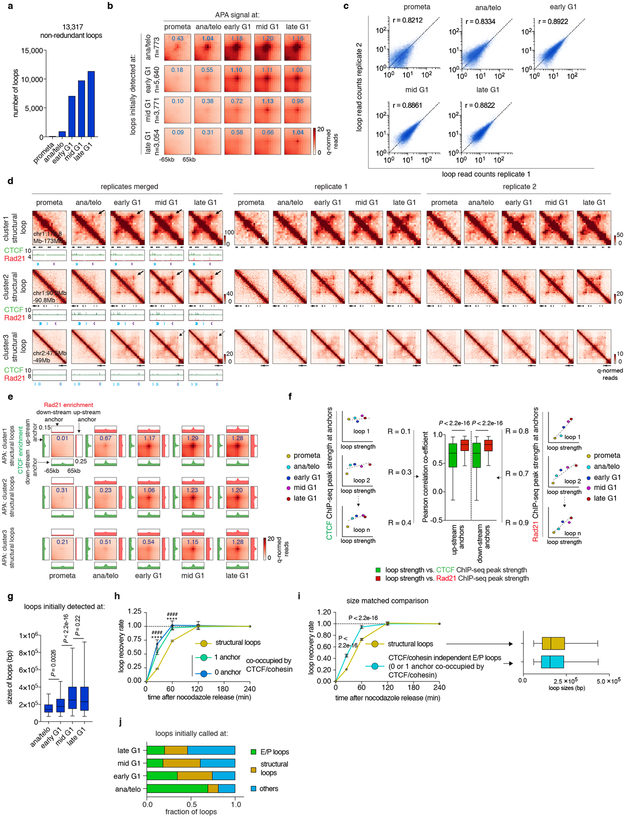
The transient decoupling of cohesin from CTCF during mitotic exit offers the opportunity to separately assess their roles in post-mitotic loop formation. Using a modified HICCUPS algorithm, we identified 13,317 chromatin loops, progressively gained from prometaphase to late G1, with highly concordant loop strength between biological replicates (Extended Data Fig. 6a-c; Supplementary Table 3). 6,285 (~47.2%) loops harbor CTCF and cohesin co-occupied sites at both anchors (Fig. 3d). These loops were further filtered to eliminate interactions between putative cis-regulatory elements (i.e. enhancer–promoter loops), resulting in 4,712 operationally defined “structural” loops (Fig. 3d). To investigate how fast structural loops are formed, we performed k-means clustering, which revealed three clusters with distinct formation dynamics (Fig. 3e). Cluster 1 loops display strong interactions in ana/telophase, while formation of cluster 2 and 3 loops is delayed (Fig. 3e, f, h; Extended Data Fig. 6d, e). Capture-C 16 validated the differential dynamics of structural loops at two representative loci (Fig. 3g, i). Importantly, anchors of cluster 1 loops displayed enrichment of Rad21 at ana/telophase, while anchors of cluster 2 and 3 loops acquired Rad21 more gradually (Fig. 3f, h; Extended Data Fig. 6d, e). In contrast, CTCF was rapidly enriched at anchors of all three loop clusters (Fig. 3f, h; Extended Data Fig. 6d, e). The strengths of structural loops are highly correlated with Rad21 ChIP-seq signals at their anchors over time, but significantly less so with CTCF (Extended Data Fig. 6f). Late occurring structural loops are significantly larger than earlier ones, suggesting a correlation between size and time to formation (Extended Data Fig. 6g). Together, our results reveal three clusters of structural loops with distinct formation dynamics and suggest that accumulation of cohesin, but not CTCF is limiting for structural loop formation after mitosis.
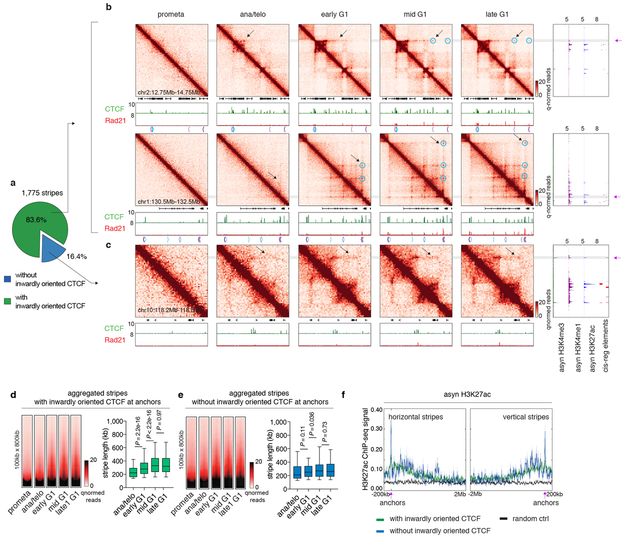
Stripes in the contact maps are thought to reflect interactions between a single locus and a continuum of genomic regions and are considered as evidence of the loop extrusion model 17. Using a modified statistical modeling approach 17, we identified 1,775 stripes genome wide. The majority of them harbor inwardly oriented CTCF sites at their anchors (Extended Data Fig. 7a). Remarkably, these striped contacts grew directionally over time but displayed punctuated enrichment at select CTCF sites (Extended Data Fig. 7b, d). This is consistent with an extrusion mechanism in which some CTCF binding sites serve as obstacles to cohesin processivity. We also observed blockage of stripe extension that correlated with the presence of strong CTCF binding sites, resulting in formation of structural loops at the far end of the stripes (Extended Data Fig. 7b). Together, our data are consistent with dynamic loop extrusion after mitosis. Stripe like patterns that appeared rapidly with little or no further growth were also observed and are discussed below (Extended Data Fig. 7c, e, f).
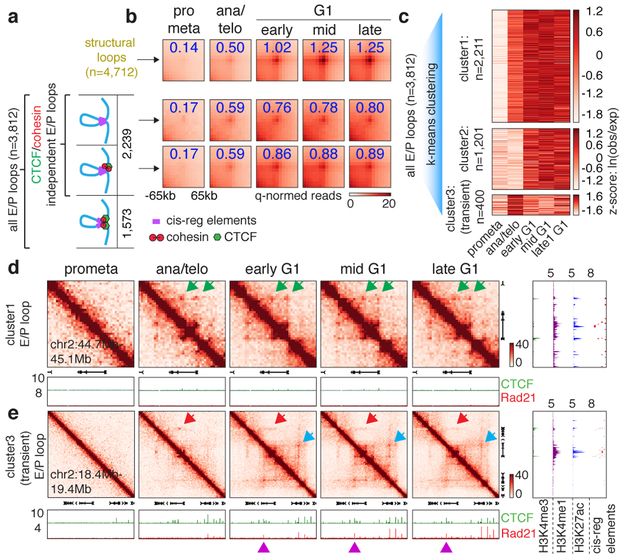
Next, we investigated interactions between cis-regulatory elements. We identified 3,812 chromatin loops with both anchors marked by promoters or putative enhancers, which we termed E/P loops (Fig. 4a). This number is likely an underestimate since short range E/P loops can escape detection. Interestingly, a significant portion (~58.7%, 2,239) of E/P loops have only one or no anchor containing CTCF/cohesin co-occupied sites, suggesting that E/P loops may form by a mechanism other than CTCF/cohesin-mediated loop extrusion (Fig. 4a). These seemingly CTCF/cohesin independent E/P loops are intensified significantly faster compared to structural loops (Fig. 4b, Extended Data Fig. 6h). Note that the faster formation of E/P loops compared to structural loops is not explained by differences in loop size (Extended Data Fig. 6i). Accordingly, among loops established in ana/telophase, ~69.3% are E/P loops, while only ~11.6% are structural loops (Extended Data Fig. 6j). These trends are reversed in mid G1 (~18.4% E/P and ~42.3% structural loops, respectively). Hence, E/P loops may not require CTCF and cohesin, and can be rebuilt faster than structural loops after mitosis.
Figure 4 ∣. cis-regulatory contacts are established rapidly after mitosis and can be transient.
a, Schematic depicting classification of loops. E/P loops were sub-divided into those with 0, 1, or 2 anchors harboring CTCF/cohesin co-occupied sites. Those with 0 or 1 anchor co-occupied by CTCF/cohesin were classified as E/P loops independent from CTCF/cohesin. b, Aggregated peak analysis (APA) of CTCF/cohesin independent E/P loops (middle and bottom panels) in comparison to structural loops (top panel). Bin size: 10kb. Numbers indicate average loop strength: ln(obs/exp). c, Heatmap of k-means clustered E/P loops. d, Hi-C contact maps of a representative region (chr2:44.7Mb-45.1Mb) containing cluster 1 E/P loops (green arrows), coupled with browser tracks of CTCF and Rad21 occupancy. Bin size: 10kb. Color bar denotes q-normed reads. Tracks of H3K4me3, H3K4me1, H3K27ac, and annotations of cis-regulatory elements were from asynchronously growing G1E-ER4 cells. e, Similar to (d), representative region (Commd3 locus, chr2:18.4Mb-19.4Mb) containing a cluster 3 (transient) E/P loop (red arrows). Blue arrows denote the formation of a down-stream, potentially interfering structural loop. Purple arrowheads indicate CTCF/cohesin binding at the potential interfering structural loop anchor.
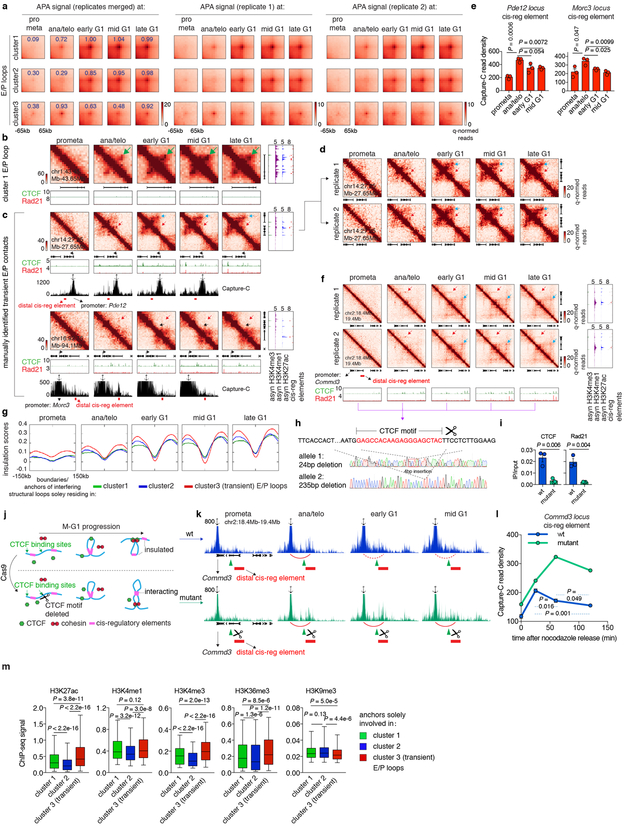
Clustering all E/P loops based on their time of enrichment yielded at least three classes with distinct post-mitotic formation kinetics. Cluster 1 (2,211, ~58%) E/P contacts are rapidly enriched in ana/telophase, whereas cluster 2 contacts (1,201, ~31.5%) form in early G1 (Fig. 4c, d; Extended Data Fig. 8a, b). Strikingly, we discovered a third cluster (400, ~10.5%) of E/P loops that peak early in ana/telophase and gradually diminish in G1 (Fig. 4c, e; Extended Data Fig. 8c, d, f). We independently validated this transient nature between certain cis-regulatory elements by Capture-C at the two manually identified loci: Pde12 and Morc3 (Extended Data Fig. 8c, e). In an effort to understand the mechanisms underlying this subset of transient E/P loops, we noticed that ~55% of them span either a boundary or an anchor of a nearby structural loop that is established later in G1 (Fig. 4e, Extended Data Fig. 8c). Moreover, these boundaries/loop anchors within cluster 3 E/P loops display more substantial insulation compared to those within clusters 1 or 2 (Extended Data Fig. 8g). We therefore speculate that emerging boundaries or nearby structural loops may interfere with E/P loops (Extended Data Fig. 1a). To test this hypothesis, we set out to assay cluster 3 E/P loop dynamics after destroying the nearby structural loop. We focused on the interaction between the Commd3 promoter and a distal cis-regulatory element. We deleted the CTCF core motif of a potential interfering structural loop anchor which abrogated CTCF and Rad21 binding (Extended Data Fig. 8f, h, i). Importantly, in the mutant cells, interactions between the Commd3 promoter and the distal cis-regulatory element were prolonged after mitosis, compared to controls (Extended Data Fig. 8j-l). These results provide a precedent for a dynamic interplay between structural and E/P loops. Yet, insulation between regulatory elements likely does not fully explain the transient nature of cluster 3 E/P loops because only ~55% of them span boundaries or interfering loop anchors. Additional mechanisms such as competition between regulatory elements may also contribute to the transient nature of cluster 3 E/P loops. In sum, we identified a special class of transient E/P loops after mitosis, which may in some case be broken by CTCF and cohesin.
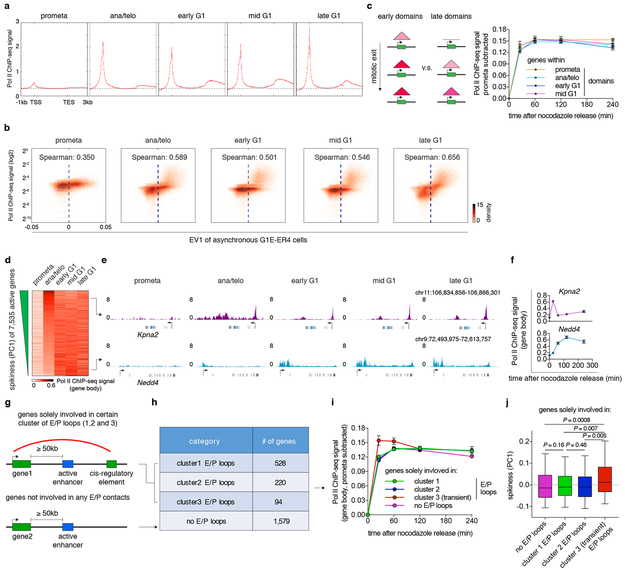
To explore the relationships between chromatin organization and transcription activation 18 after mitosis, we carried out Pol II ChIP-seq (Extended Data Fig. 1i) 19. Transcription was largely silenced in prometaphase, but rapidly re-initiated in ana/telophase and positively correlated with A-type compartments (Extended Data Fig. 9a, b). Collectively, we identified 7,535 active genes after mitosis (Supplementary Table 4). Genes displayed comparable reactivation dynamics regardless of whether they were located in domains called at early or later cell cycle stages, suggesting that domain formation may exert limited influence on gene reactivation after mitosis (Extended Data Fig. 9c). We then stratified active genes based on their Pol II occupancy over time through principle component analysis 19. Previously, we observed that a large fraction of genes acquired strong Pol II occupancy early after mitosis, followed by reduction in signal intensity. This “spike” in gene reactivation manifested as the first principle component (PC1) and separated “spiking” genes from late gradually activating genes 19. Likewise, the current data recapitulated this transient hyperactivation as represented by PC1 (Extended Data Fig. 9d-f). To dissect the relationship between gene spiking and E/P loop formation, we began by stratifying all active genes based on whether they are positioned at E/P loop anchors (Extended Data Fig. 9g, h). In general, formation of E/P loops was positively correlated with Pol II occupancy over time (median Pearson r: ~0.65). Interestingly, genes at cluster 3 E/P loops are more likely to display post-mitotic transcriptional spiking compared to those at cluster 1, 2 or no E/P loops (Extended Data Fig. 9i, j). For genes associated with cluster 1 and 2 E/P loops, their activation was also positively correlated with loop strength over time (median Pearson r: ~0.67). These results suggest that transient E/P loops may contribute to post-mitotic gene spiking. However, a caveat to this interpretation is that a much larger number of genes spike than are associated with transient E/P loops, suggestion that E/P contacts cannot be solely responsible for spiking in post-mitotic transcriptional activity. Nonetheless, while the causal relationship between gene spiking and transient E/P loops remains uncertain, the overall positive correlation between E/P loop strength and Pol II occupancy over time suggest a potential role of E/P contacts in transcription after mitosis.
We exploited the natural transition from a relatively unorganized state (prometaphase) into fully established chromatin organization late in G1 to interrogate mechanisms by which chromatin is hierarchically organized (Extended Data Fig. 1a). We showed that A/B compartmentalization was disrupted in prometaphase in spite of histone marks being largely maintained 20. We also show that local (~10Mb) compartmentalization of chromatin initiates rapidly after mitosis and continues to expand and increase in strength. Studying cell cycle dynamics of chromatin also enabled the testing of predictions made by the loop extrusion model. First, small TADs and structural loops are formed more quickly than larger ones. Second, stripes in the contact maps increase in length over time. Third, based on the kinetics of CTCF and cohesin deposition on chromatin, it is clear that CTCF does not form detectable loops without cohesin even though it can multimerize 21. However, it is possible that CTCF pairs with itself or other factors such as YY1 to facilitate the establishment of contacts among cis regulatory elements such as those observed at early time points independently of cohesin 22,23.
Our integrative analysis of loops and histone modification profiles reveals a group of E/P loops that can be independent from CTCF and cohesin co-binding. A distinctive feature of E/P loops is their fast appearance compared to structural loops. It is possible that E/P contacts form via collisions of chromatin regions with similar epigenetic states, which is supported by our observation that their post-mitotic recovery rate positively correlates with the intensity of active histone marks at anchors (Extended Data Fig. 8m). Intriguingly, 16.4% of stripe-like structures that lack inwardly oriented CTCF display only little or no further growth during G1 phase and are highly enriched for H3K27ac at their anchors (Extended Data Fig. 7c, e, f). Loop extrusion is unlikely to account for this type of stripe shaped contacts. Instead, they might represent small compartments, defined by local enrichment of transcription factors and chromatin modifications 24. Similarly, transient E/P loops might result from less discriminatory affinity among regions with similar chromatin states. In summary, our findings describe a dynamic hierarchical framework of post-mitotic chromatin configuration that supports a bottom-up model for the formation of contact domains, implicates CTCF and cohesin in post-mitotic loop extrusion, and identified extrusion independent pathways that lead to compartmentalization and contacts of cis-regulatory networks.
Supplementary Material
Extended Data
Extended Data Figure 1 ∣. Models, experimental workflow and data quality control.
a, 1st panel: Schematic illustration of the early emergence, gradual intensification and expansion of A/B compartments (checkerboards) from prometaphase to late G1 phase, coupled with schematics of chromatin organization. 2nd panel: SubTADs (small triangles) emerge first after mitotic exit, followed by convergence into a TAD (big triangle). 3rd panel: Formation of a structural loop coincides with the positioning of cohesin, but not CTCF after mitosis. 4th panel: The gradual extrusion of cohesin complex along DNA fiber from one anchor point with CTCF, reflected as enrichment of interactions between the anchor and a continuum of DNA loci on the contact map. 5th panel: Fast formation of E/P loops after mitosis. 6th panel: The interplay between transient E/P loops and boundaries or structural loops. b, Experimental workflow: representative flow cytometry plots showing the nocodazole arrest/release strategy based on pMPM2 (prometaphase), mCherry-MD signal, and DNA content (DAPI) staining. Similar observations were made in > 5 independent experiments. c, Representative images showing DAPI and lamin B1 staining of FACS purified cells across all cell cycle stages. Similar observations were made in 2 independent experiments. The mitotic index of prometaphase cells after FACS purification is on average > 98%. Yellow and white arrowheads indicate anaphase and telophase cells respectively. Scale bar: 10μm. d, Hexbin plots showing the high correlation of Hi-C raw read counts between two biological replicates across all cell cycle stages. Bin size: 250kb. e, Heatmap showing the Pearson correlation among all Hi-C samples, based on the eigenvector 1 of 250kb bins. f, Heatmap showing the Pearson correlation among all Hi-C samples based on raw read counts. Bin size: 250kb. (g-i), Heatmaps showing Pearson correlation of CTCF, Rad21 and Pol II ChIP-seq among all samples, respectively. Note the overall high replicate concordance with low correlation coefficients among replicates only observed in samples with low signal/noise ratios, e.g. in prometaphase.
Extended Data Figure 2 ∣. Compartment strengthening and expansion from ana/telophase throughout late G1.
a, Saddle plots showing the progressive gain of compartment strength over time in two biological replicates. b, Schematic showing the calculation of compartment strength. c, Line graphs showing the progressive increase of compartment strength of each individual chromosome (represented by dots) in two biological replicates. d, Heatmap showing the genome wide Spearman correlation coefficients between eigenvector 1 values and asynchronous cell derived ChIP-seq signals for the indicated histone marks. e, Chromosome averaged distance dependent contact frequency P(s) plots at all cell cycle stages. f, P(s) plots of each individual chromosome of two biological replicates. g, A schematic illustrating how compartmentalization levels R(s) were calculated at different distance scales (e.g. 1Mb or 100Mb). Each dotted line indicates a series of 250kb bin-bin pairs that are separated by a given genomic distance s (the distance from the diagonal to the dotted line). For all bin-bin pairs separated by distance of s, a Spearman correlation coefficient R(s) was generated between obs/exp and the product of two eigenvector 1 values (PC1 (bin1) × PC1 (bin2)). R(s) is expected to be high in well compartmentalized regions (left panel) and low at large distance scales with no compartments (right panel). h, Replicate averaged R(s) of each individual chromosome across all cell cycle stages when s equals to 10, 50 and 125Mb (only eight chromosomes computed at this distance scale). i, Line graph showing the level of compartmentalization of chr1 against genomic distance at each cell cycle stage.
Extended Data Figure 3 ∣. Domain detection and residual “domain-like” structures in prometaphase.
(a-b), Meta-region plots and density heatmaps of insulation scores and directionality index centered around domain boundaries initially detected at each cell cycle stage. c, Scatter plots showing Pearson correlations of insulation scores at domain boundaries between two biological replicates. d, Aggregated domain analysis (ADA) of domains initially detected at each cell cycle stage. e, Box plots showing ADA scores over time of domains initially detected at prometa (n=1,360), ana/telo (n=2,260), early G1 (n=2,875) and mid G1 (n=1,112). For all box plots, center lines denote medians; box limits denote 25-75 percentile; whiskers denote 5-95 percentile. P values were calculated from two-sided Mann-Whitney U test. Dotted line indicates the average ADA score of initial domain detection. f, Hi-C contact maps of two representative regions (chr8:113Mb-114Mb & chr9:72Mb-73Mb) showing residual domain/boundary-like structures (yellow lines) in prometaphase in merged and individual biological replicates. Bin size: 10kb. g, Simulated featureless, percent “G1 contaminated”, and early G1 contact maps of the same regions as (f). Bin size: 10kb. h, Meta-region plots showing the insulation scores of prometaphase, simulated featureless, “G1 contaminated” and early G1 samples, centered around prometaphase boundaries in chr8 and chr9. i, Meta-region plots showing indicated histone modification profiles centered around boundaries newly detected at each cell cycle stage. j, Bar graphs showing the enrichment of TSS (overall, housekeeping and tissue-specific 9) within ± 20kb of boundaries newly detected at each cell cycle stage.
Extended Data Figure 4 ∣. TAD and subTAD dynamics after mitosis.
a, Schematic of possible models of hierarchical domain formation: bottom-up/merge, top-down/split and concomitant. b, Bar graphs showing the fraction of TADs that display either type of behaviors after detection. c, Bar graphs showing the fraction of subTADs that display each of the four potential behaviors after detection: merge, split, merge & split and static. d, Bottom panel: Schematic showing partitioning of boundaries into TAD and subTAD boundaries. Upper panel: Hi-C contact maps showing the insulation change of representative TAD and subTAD boundaries from ana/telophase to late G1. SubTAD and TAD boundaries are indicated by green and blue arrows respectively. Bin size: 10kb. e, Bin plots showing the insulation score change over time of TAD boundaries (upper panel) and subTAD boundaries (lower panel) that are detected at prometaphase in merged and two biological replicates respectively. f, Box plots showing sizes of domains initially detected at prometa (n=2,494), ana/telo (n=1,699), early G1 (n=1,357) and mid G1 (n=682) by rGMAP. For all box plots, center lines denote medians; box limits denote 25-75 percentile; whiskers denote 5-95 percentile. P values were calculated by two-sided Mann-Whitney U test. g, Pie charts of the cell cycle distribution of subTADs and TADs that contain ≥ 1 subTADs based on their time of emergence (called by rGMAP). P value was calculated by two sided Fisher’s exact test (prometa + ana/telo vs. early G1 + mid G1). h, Bar graphs showing the fraction of rGMAP detected subTADs that display each of the four potential behaviors after detection: merge, split, merge & split and static. i, Bin plots showing the insulation score change of TAD boundaries (left panel) and subTAD boundaries (right panel) that are detected by rGMAP at prometaphase. j, Box plots showing sizes of domains initially detected at prometa (n=1,105), ana/telo (n=1,124), early G1 (n=2,385) and mid G1 (n=520) by DI+sweep (directionality index + window size adjustment). For all box plots, center lines denote medians; box limits denote 25-75 percentile; whiskers denote 5-95 percentile. P values were calculated by two-sided Mann-Whitney U test. (k-m), Similar to (g-i), showing analyses based on domains called by DI+sweep.
Extended Data Figure 5 ∣. CTCF and cohesin chromatin occupancy in mitosis and G1 entry.
a, A density heatmap of CTCF ChIP-seq of each biological replicate of asynchronous and prometaphase samples, centered around IM- and IO-CTCF binding sites. b, A density heatmap of Rad21 ChIP-seq of both biological replicates of asynchronous and prometaphase samples centered around all Rad21 peaks. c, Genome browser tracks showing CTCF and Rad21 ChIP-seq signals of asynchronous and prometaphase samples at indicated regions. n=2-3 biological replicates. d, ChIP-qPCR of CTCF and Rad21 in asynchronous (n=3, 6 biological replicates for CTCF and Rad21 respectively) and prometaphase samples (n=4, 3 biological replicates for CTCF and Rad21 respectively). Error bars denote mean ± SEM. e, Motif enrichment analysis of IM- and IO-CTCF binding sites with indicated E values. f, Upper panel: donut charts showing the genome wide distribution of IM- and IO-CTCF binding sites. Middle panel: Bar graphs showing the percentage of IM- or IO-CTCF binding sites that are found in indicated numbers of tissues. Bottom panel: donut pie chart showing the fraction of IM- and IO-CTCF binding sites that are co-occupied by Rad21. g, Density heatmaps and meta-region plots of CTCF and Rad21 ChIP-seq across all time points centered around CTCF specific and CTCF/Rad21 co-occupied binding sites. h, Bin plots showing ChIP-seq signals of CTCF and Rad21 peaks for each cell cycle stage (y-axes) against late G1 (x-axis). i, ChIP-qPCR of CTCF and Rad21 at indicated binding sites across time points. n=2 biological replicates for 0 and 25min, and n=3 biological replicates for 120 and 240min after nocodazole release. Error bars denote mean ± SEM. j, Schematic showing mCherry tagging of endogenous CTCF and SMC3. k, Representative images (from ≥ 10 dividing cells) illustrating behaviors of mCherry tagged CTCF and SMC3 during mitosis-early G1 phase progression. Similar observations were made in 2 independent experiments. Yellow dotted circles demarcate cell nuclei after mitosis. Scale bar: 5μm. l, Average recovery curve of mCherry tagged CTCF and SMC3 that co-localize with H2B-YFP. 11 mother cells/22 daughter cells and 10 mother cells/18 daughter cells were analyzed for CTCF and SMC3, respectively. P values were calculated using two sided Student’s t test. Error bars denote mean ± SEM. P values were omitted at time points with fewer than 5 cells.
Extended Data Figure 6 ∣. Loop statistics and k-means clustering on structural loops.
a, Bar graph showing the number of loop calls at each cell cycle stage. b, Aggregated peak analysis (APA) of loops initially detected at each cell cycle stage. Bin size: 10kb. Numbers indicate average loop strength: ln(obs/exp). c. Scatter plots showing the Pearson correlation of loop strength (read counts) between two biological replicates. d, Hi-C contact maps showing representative regions that contain cluster 1 (chr1:172.8Mb-173Mb), 2 (chr1:90.2Mb-90.8Mb) and 3 (chr2:47.5Mb-49Mb) structural loops in merged and both biological replicates. Bin size: 10kb. Loop signal enrichment is indicated by black arrows. Contact maps are coupled with genome browser tracks showing CTCF and cohesin occupancy across all cell cycle stages. Chevron arrows mark orientations of CTCF sites at loop anchors. e, APA of cluster1, 2 and 3 structural loops across all cell cycle stages. Each heatmap is coupled with four meta-region plots corresponding to CTCF and Rad21 ChIP-seq signals centered around either up-stream or down-stream loop anchors. Bin size: 10kb. Numbers indicate average loop strength: ln(obs/exp). f, Left and Right: Schematics showing how correlations are computed between CTCF or Rad21 and loop strength over time. Middle: Box plot showing the Pearson correlation coefficients between CTCF or Rad21 ChIP-seq peak strength at up-stream or down-stream anchors and structural loop strength over time (n=4,712). For all box plots, center lines denote medians; box limits denote 25-75 percentile; whiskers denote 5-95 percentile. P values were calculated by two-sided Wilcoxon signed-rank test. g, Box plot showing sizes of structural loops initially detected ana/telo (n=90), early G1 (n=2,233), mid G1 (n=1,595) and late G1 (n=793). For all box plots, center lines denote medians; box limits denote 25-75 percentile; whiskers denote 5-95 percentile. P values were calculated by two-sided Mann-Whitney U test. h, Average recovery curves of structural loops (n=4,241) and E/P loops with 0 (n=678) or 1 (n=1,338) anchor co-occupied by CTCF/cohesin. 10% of the loops with smallest increment from prometa to late G1 were filtered out from analysis. Error bars denote mean ± 99% confidence interval. **** or #### p < 2.2e-16 (structural loops vs. E/P loops with 0 or 1 anchor co-occupied by CTCF/cohesin respectively). Two-sided Mann-Whitney U test. i, Left: Average recovery curves of randomly sampled and size matched structural loops and CTCF/cohesin independent E/P loops (n=2,869 for both groups). 10% loops with the lowest increment from prometa to late G1 were dropped from the analysis. Error bars denote mean ± 99% confidence interval. P values were calculated by two-sided Mann-Whitney U test. Right: Box plot showing the comparable size distribution of these two randomly sampled groups (n=2,869 for both). For both box plots, center lines denote medians; box limits denote 25-75 percentile; whiskers denote 5–95 percentile. j, Bar graphs depicting the composition of loops newly called at each cell cycle stage.
Extended Data Figure 7 ∣. Reformation of chromatin stripes after mitosis.
a, Pie chart showing the fraction of stripes with inwardly oriented CTCF at stripe anchors. b, Hi-C contact maps of two representative regions (chr2:12.75Mb-14.75Mb and chr1:130.5Mb-132.5Mb) that contain stripes with inwardly oriented CTCF. Bin size: 10kb. Contact maps are coupled with genome browser tracks of CTCF and Rad21 across all cell cycle stages and tracks of asynchronous H3K4me3, H3K4me1 and H3K27ac and annotation of cis-regulatory elements. Chevron arrows mark positions and orientations of CTCF peaks at stripe and loop anchors. Lengthening of stripes is indicated by black arrows. Stripe anchors are indicated by purple arrows. Loops along the stripe axis and at the far end of stripes are indicated by blue circles. c, similar to (b) Hi-C contact maps showing a representative stripe (chr10:118.2Mb-118.8Mb) that does not have inwardly oriented CTCF at stripe anchor. d, Left: Aggregated Hi-C contact maps that compiles all stripes with inwardly oriented CTCF to show their overall dynamic growing after mitosis. Right: Box plots showing the lengths of these stripes at ana/telo (n=235), early G1 (n=1,472), mid G1 (n=1,477) and late G1 (n=1473). For all box plots, center lines denote medians; box limits denote 25-75 percentile; whiskers denote 5-95 percentile. P values were calculated by two-sided Mann-Whitney U test. e, Similar to (d), showing stripes without inwardly oriented CTCF. n= 73, 282, 278, 273 for ana/telo, early G1, mid G1 and late G1, respectively. f, H3K27ac ChIP-seq profile from asynchronous G1E-ER4 cells is plotted −200kb to 2Mb around the horizontal stripe anchors and −2Mb to 200kb around the vertical stripe anchors. Anchor position is indicated by purple arrows.
Extended Data Figure 8 ∣. Supplemental E/P loop analyses.
a, Aggregated peak analysis (APA) of the three clusters of E/P loops on merged and two biological replicates. Bin size: 10kb. Numbers indicate average loop strength: ln(obs/exp). b, Hi-C contact maps showing an additional example of cluster 1 E/P loop (chr1:43.45Mb-43.65Mb, green arrow). Bin size: 10kb. Color bar denotes q-normed reads. Contact maps are coupled with genome browser tracks of CTCF and cohesin across all time points as well as asynchronous H3K4me3, H3K4me1 and H3K27ac and annotations of cis-regulatory elements. c, Similar to (b), showing two examples of manually identified transient E/P contacts (Pde12 locus and Morc3 locus, indicated by red arrow). Boundaries or structural loop anchors that potentially interfere with these E/P contacts are indicated by black and blue arrows respectively. Contact maps are coupled with tracks of Capture-C interaction profiles. Probes (anchor symbol) are located at promoters of Pde12 and Morc3 genes respectively. d, Hi-C contact maps showing Pde12 locus on two biological replicates. Bin size: 10kb. e, Quantification of the Capture-C read density of the red regions in (c). n=3 biological replicates. Error bars denote mean ± SEM. P values were calculated from two-sided Student’s t test. f, Similar to (d), Hi-C contact maps showing the cluster3 E/P loop (red arrows) at Commd3 locus in two biological replicates. Potential interfering loop is indicated by blue arrows. g, Insulation score profiles centered around the boundaries and interfering structural loop anchors that solely reside within cluster 1, 2 or 3 E/P loops respectively. h, Sanger sequencing profiles showing the deletion of CTCF core motif at the up-stream anchor of the structural loop (blue arrows in f) that potentially interfere the cluster3 E/P loop at Commd3 locus (red arrows in f). i, ChIP-qPCR showing the abrogation of CTCF and Rad21 binding at the edited site in (f). n=3 biological replicates. Error bars denote mean ± SEM. P values were calculated by two-sided Student’s t test. j, Schematic showing potential behavior of cluster 3 E/P loops before and after deleting the interfering structural loop anchor. k, Capture-C interaction profiles between Commd3 promoter and down-stream cis-regulatory element (red bars) on WT and interfering anchor deleted mutant cells over time. Capture probe location was indicated by anchor symbol. Deleted CTCF site was indicated by green triangles. Formation of transient loop was indicated by red arches. l, Quantification showing read density of the red regions in (k). n=3 and 2 biological replicates for WT and mutant cells respectively. Error bars denote mean ± SEM. P values were calculated by two-sided Student’s t test. m, Box plots showing ChIP-seq signals of indicated histone modifications at anchors that solely participate in cluster 1, 2 or 3 (transient) E/P loops (n=2,612; 1,338 and 413 respectively). For all box plots, center lines denote medians; box limits denote 25-75 percentile; whiskers denote 5-95 percentile. P values were calculated by two-sided Mann-Whitney U test.
Extended Data Figure 9 ∣. Relationship between post-mitotic structural organization and gene reactivation.
a, Meta-region analysis of Pol II occupancy of active genes across all cell cycle stages. TSS: transcription start site. TES: transcription end site. b, Bin plots showing the positive correlation between Pol II ChIP-seq signal strength and eigenvector 1 (asynchronous G1E-ER4 cells 25, 25kb binned) genome wide. c, Left: Schematic showing genes that are within early or late domains. Right: Average Pol II occupancy of genes that reside in prometa (n=2,274 genes) ana/telo (n=2,114 genes), early G1 (n=1,159 genes) and mid G1 (n=303 genes) emerging domains. Error bars denote mean ± 99% confidence interval. d, Heatmap showing gene body Pol II occupancy across all cell cycle stages. Genes are ranked by their PC1 values (“spikiness”). e, Genome browser tracks showing representative examples of early spiking (Kpna2) and gradually activating (Nedd4) genes. f, Quantification of gene body Pol II occupancy in (e). n=2 biological replicates for 0h, and n=3 biological replicates for other time points. Error bars denote mean ± SEM. g, Schematic showing the stratification of genes based on their involvement of E/P loops. h, Table showing number of genes that solely involve in certain cluster of E/P loops. i, Average gene body Pol II occupancy of genes in (h) over time. Sample sizes are shown in (h). Error bars denote mean ± SEM. j, Box plots showing the spikiness (PC1) of genes in (h). Sample sizes are shown in (h). For all box plots, center lines denote medians; box limits denote 25–75 percentile; whiskers denote 5–95 percentile. P values were calculated by two-sided Mann-Whitney U test.
ACKNOWLEDGEMENTS
We thank members of the Blobel and Phillips-Cremins labs for helpful discussions. We thank Effie Apostolou and Job Dekker for discussing data prior to publication, and Leonid Mirny for helpful insights. We thank the CHOP flow core facility staff and Andrea Stout for expert technical support. This work was supported by grants R37DK058044 to G.A.B.; R24DK106766 to G.A.B. and R.C.H.; U01HL129998A to J.E.P.C. and G.A.B.; The New York Stem Cell Foundation to J.E.P.C., the NIH Director’s New Innovator Award from the National Institute of Mental Health (1DP2MH11024701; J.E.P.C), and a generous gift from the DiGaetano family to G.A.B. J.E.P.C. is a New York Stem Cell Foundation (NYSCF) Robertson Investigator. We thankfully acknowledge the support by the Spatial and Functional Genomics program at The Children’s Hospital of Philadelphia.
Footnotes
The authors declare no competing financial interests.
Publisher’s note: Springer Nature remains neutral with regard to jurisdictional claims in published maps and institutional affiliations.
DATA AVAILABILITY All Figures include publicly available data. The Hi-C, Capture-C and ChIP-seq data generated and analyzed in this study are deposited in GEO repository under accession number GSE129997 for public access. Additional external ChIP-seq data previously reported are available at: H3K27ac (GSE61349) 35, H3K4me1 (GSM946535) 37, H3K4me3 (GSM946533) 37, H3K36me3 (GSM946529) 37 and H3K9me3 (GSM946542) 37. CTCF peak files from 13 different tissues are available through ENCODE project with ENCODE file accession numbers: ENCFF001LFU, ENCFF001LHE, ENCFF001LHY, ENCFF001LJL, ENCFF001LKO, ENCFF001LMN, ENCFF001LNK, ENCFF001LOR, ENCFF001LPI, ENCFF001LQB, ENCFF001LQS, ENCFF001LSE and ENCFF001LSW. Code available upon request.
CODE AVAILABILITY Code available upon requests.
RERERENCES:
- 1.Lajoie BR et al. Organization of the Mitotic Chromosome. Science 342, 948–953 (2013). [DOI] [PMC free article] [PubMed] [Google Scholar]
- 2.Gibcus JH et al. A pathway for mitotic chromosome formation. Science 359, eaao6135 (2018). [DOI] [PMC free article] [PubMed] [Google Scholar]
- 3.Nagano T et al. Cell-cycle dynamics of chromosomal organization at single-cell resolution. Nature 547, 61–67 (2017). [DOI] [PMC free article] [PubMed] [Google Scholar]
- 4.Rao SSP et al. A 3D map of the human genome at kilobase resolution reveals principles of chromatin looping. Cell 159, 1665–1680 (2014). [DOI] [PMC free article] [PubMed] [Google Scholar]
- 5.Weiss MJ, Yu C & Orkin SH Erythroid-cell-specific properties of transcription factor GATA-1 revealed by phenotypic rescue of a gene-targeted cell line. Mol. Cell. Biol 17, 1642–51 (1997). [DOI] [PMC free article] [PubMed] [Google Scholar]
- 6.Dileep V et al. Topologically associating domains and their long-range contacts are established during early G1 coincident with the establishment of the replication-timing program. Genome Res. 25, 1104–1113 (2015). [DOI] [PMC free article] [PubMed] [Google Scholar]
- 7.Lieberman-Aiden E et al. Comprehensive mapping of long-range interactions reveals folding principles of the human genome. Science 326, 289–293 (2009). [DOI] [PMC free article] [PubMed] [Google Scholar]
- 8.Norton HK et al. Detecting hierarchical genome folding with network modularity. Nat. Methods 15, 119–122 (2018). [DOI] [PMC free article] [PubMed] [Google Scholar]
- 9.Li B et al. A Comprehensive mouse transcriptomic bodymap across 17 tissues by RNA-seq. Scientific Reports. 7, 4200 (2017). [DOI] [PMC free article] [PubMed] [Google Scholar]
- 10.Yu W, He B & Tan K Identifying topologically associating domains and subdomains by Gaussian Mixture model and Proportion test. Nat. Commun 8, 535 (2017). [DOI] [PMC free article] [PubMed] [Google Scholar]
- 11.Sanborn AL et al. Chromatin extrusion explains key features of loop and domain formation in wild-type and engineered genomes. Proc. Natl. Acad. Sci 112, E6456–E6465 (2015). [DOI] [PMC free article] [PubMed] [Google Scholar]
- 12.Fudenberg G et al. Formation of Chromosomal Domains by Loop Extrusion. Cell Rep. 15, 2038–2049 (2016). [DOI] [PMC free article] [PubMed] [Google Scholar]
- 13.Oomen ME, Hansen AS, Liu Y, Darzacq X & Dekker J CTCF sites display cell cycle-dependent dynamics in factor binding and nucleosome positioning. Genome Res. 29, 236–249 (2019). [DOI] [PMC free article] [PubMed] [Google Scholar]
- 14.Owens N et al. CTCF confers local nucleosome resiliency after DNA replication and during mitosis. Biorxiv preprints at: https://www.biorxiv.org/content/10.1101/563619v1. [DOI] [PMC free article] [PubMed] [Google Scholar]
- 15.Cai Y et al. Experimental and computational framework for a dynamic protein atlas of human cell division. Nature 561, 411–415 (2018). [DOI] [PMC free article] [PubMed] [Google Scholar]
- 16.Hughes JR et al. Analysis of hundreds of cis-regulatory landscapes at high resolution in a single, high-throughput experiment. Nat. Genet 46, 205–212 (2014). [DOI] [PubMed] [Google Scholar]
- 17.Vian L et al. The Energetics and Physiological Impact of Cohesin Extrusion. Cell 173, 1165–1178 (2018). [DOI] [PMC free article] [PubMed] [Google Scholar]
- 18.Rowley MJ et al. Evolutionarily Conserved Principles Predict 3D Chromatin Organization. Mol. Cell 67, 837–852 (2017). [DOI] [PMC free article] [PubMed] [Google Scholar]
- 19.H CC-S. et al. A hyperactive transcriptional state marks genome reactivation at the mitosis-G1 transition. Genes Dev. 30, 1423–1439 (2016). [DOI] [PMC free article] [PubMed] [Google Scholar]
- 20.Behera V et al. Interrogating Histone Acetylation and BRD4 as Mitotic Bookmarks of Transcription. Cell Rep. 27, 400–415 (2019). [DOI] [PMC free article] [PubMed] [Google Scholar]
- 21.Yusufzai TM, Tagami H, Nakatani Y & Felsenfeld G CTCF Tethers an Insulator to Subnuclear Sites, Suggesting Shared Insulator Mechanisms across Species. Mol. Cell 13, 291–298 (2004). [DOI] [PubMed] [Google Scholar]
- 22.Weintraub AS et al. YY1 Is a Structural Regulator of Enhancer-Promoter Loops. Cell 171, 1573–1588 (2017). [DOI] [PMC free article] [PubMed] [Google Scholar]
- 23.Beagan JA et al. YY1 and CTCF orchestrate a 3D chromatin looping switch during early neural lineage commitment. Genome Res. 27, 1139–1152 (2017). [DOI] [PMC free article] [PubMed] [Google Scholar]
- 24.Schwarzer W et al. Two independent modes of chromatin organization revealed by cohesin removal. Nature 551, 51–56 (2017). [DOI] [PMC free article] [PubMed] [Google Scholar]
Associated Data
This section collects any data citations, data availability statements, or supplementary materials included in this article.


