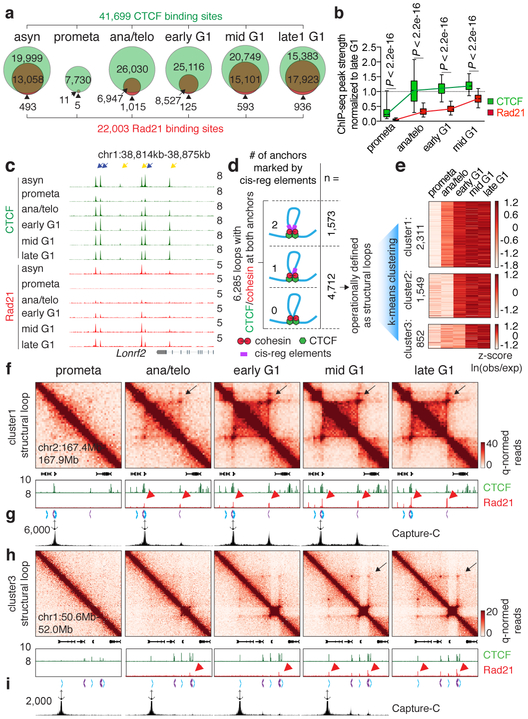
Figure 3 ∣. Focal accumulation of cohesin is delayed compared to CTCF and coincides with structural loop formation.
a, Venn diagrams showing CTCF and Rad21 peak distribution across cell cycle stages. b, Box plots showing the recovery rate of CTCF (n=33,306) and Rad21 (n=18,859) peaks. Peaks absent from late G1 were dropped from the analysis. For all box plots, center lines denote medians; box limits denote 25-75 percentile; whiskers denote 5-95 percentile. P values were calculated from two-sided Mann-Whitney U test. c, Genome browser tracks of CTCF and Rad21 at the Lonrf2 loci across cell cycle stages. n=2-3 biological replicates. Blue and yellow arrows indicate IM- and IO-CTCF binding sites, respectively. d, Schematic depicting classification of loops. All loops with CTCF/cohesin co-occupancy at both anchors were sub-divided into those with 0, 1, or 2 anchors marked by cis-regulatory elements. Those with 0 or 1 were operationally defined as structural loops. e, Heatmap showing result of k-means clustering on the 4,712 structural loops. f, Hi-C contact maps showing a representative region that contains a cluster 1 structural loop (chr2:167.4Mb-167.9Mb, black arrows), along with genome browser tracks of CTCF and Rad21 ChIP-seq profiles. Rad21 peaks at two loop anchors are indicated by red arrowheads. Chevron arrows highlight positions and orientations of CTCF sites at the loop anchors. Bin size: 10kb. g, Capture-C interaction profile of the same region as shown in (f). n=3 biological replicates. Anchor symbol shows position of the capture probe. h-i, similar to (f-g) showing a representative region that contains a cluster 3 (slowly emerging) structural loop (chr1:50.6Mb-52.0Mb, black arrows).

