Abstract
Heme is an essential prosthetic group of numerous proteins and a central signaling molecule in many physiologic processes1,2. The chemical reactivity of heme requires that a network of intracellular chaperone proteins exist to avert the cytotoxic effects of free heme, but the constituents of such trafficking pathways are unknown3,4. Heme synthesis is completed in mitochondria, with ferrochelatase (FECH) adding iron to protoporphyrin IX. How this vital but highly reactive metabolite is delivered from mitochondria to hemoproteins throughout the cell remains poorly defined3,4. Here, we show that PGRMC2 is required for delivery of labile, or signaling heme, to the nucleus. Deletion of PGMRC2 in brown fat, which has a high demand for heme, reduced labile heme in the nucleus and increased stability of the heme-responsive transcriptional repressors Rev-Erbα and BACH1. Ensuing alterations in gene expression spawn severe mitochondrial defects that rendered adipose-specific PGRMC2-null mice unable to activate adaptive thermogenesis and prone to greater metabolic deterioration when fed a high-fat diet. In contrast, obese-diabetic mice treated with a small-molecule PGRMC2 activator showed substantial improvement of diabetic features. These studies uncover a role for PGRMC2 in intracellular heme transport, reveal the impact of adipose tissue heme dynamics on physiology, and suggest that modulation of PGRMC2 may revert obesity-linked defects in adipocytes.
We recently isolated a small molecule that stimulated adipogenesis5 by acting as a gain-of-function ligand for Progesterone Receptor Membrane Component 2 (PGRMC2), a poorly characterized protein6,7. PGRMC2 is a single-pass transmembrane protein localized in the endoplasmic reticulum (ER) and the nuclear envelope5,8 that belongs to the membrane-associated progesterone receptor (MAPR) family, which share a non-covalent heme-binding domain9. Other MAPR proteins (PGRMC1, neudesin, neuferricin) bind heme reversibly9. We found PGRMC2 also reversibly bound heme5. Interestingly, addition of heme boosts adipogenesis, while inhibition of biosynthesis blocks differentiation10. The adipogenic effects of heme have been linked to the nuclear receptor Rev-Erbα11,12, a transcriptional repressor with a dual role in adipogenesis: it is required early on, but it must be degraded for differentiation to proceed13. Heme is a ligand for Rev-Erbα14,15, and binding of heme leads to eventual Rev-Erbα degradation. Notably, the adipogenic effect of the PGRMC2 activator was dependent on Rev-Erbα signaling5, hinting that PGRMC2 activation may stimulate adipogenesis by facilitating heme delivery to the nucleus to induce Rev-Erbα degradation. Here, we have examined a role for PGRMC2 in intracellular heme mobilization.
PGRMC2 traffics mitochondrial heme
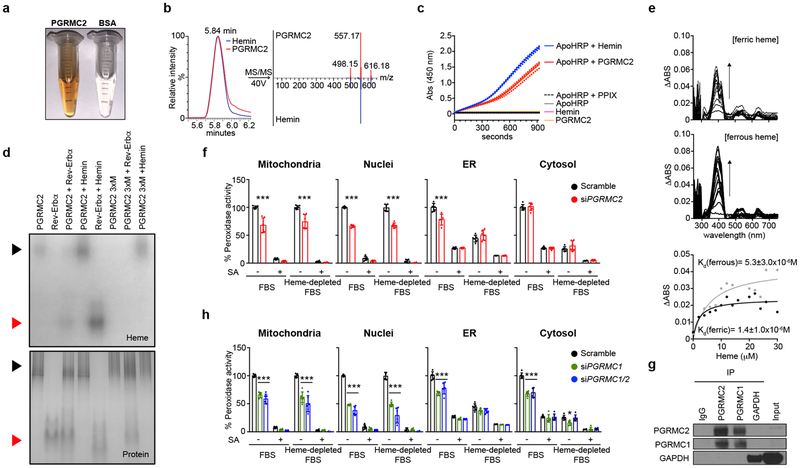
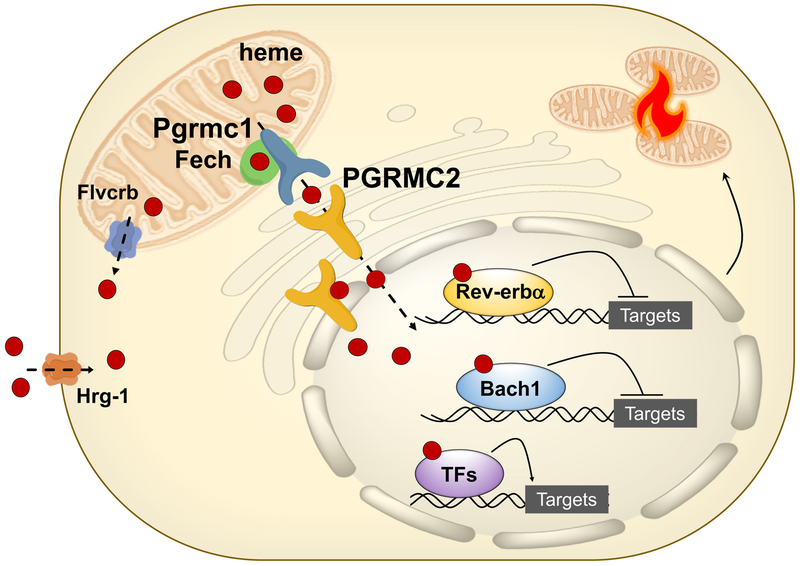
PGRMC2 protein purified from E. coli was notably reddish in color (Fig. 1a). Its spectra revealed the Soret peak of hemoproteins at 390-430 nm (Extended Data Fig. 1a), and liquid chromatography–mass spectrometry showed a 616.18 Da peak corresponding to iron-protoporphyrin IX (Fig. 1b and Extended Data Fig. 1b, c), confirming that PGRMC2 co-purified with heme. To test the ability of PGRMC2 to transfer heme, a requirement for a heme-mobilizing chaperone, we incubated PGRMC2 with apo-horseradish peroxidase (apoHRP), an inactive form of the enzyme lacking its prosthetic heme. Incubation of apoHRP with hemin or PGRMC2 increased HRP activity, reflecting conversion of apoHRP into active, heme-bound holoHRP (Fig. 1c), thus indicating that PGRMC2 can transfer heme to other proteins. To test the ability of PGRMC2 to transfer heme to Rev-Erbα itself, Apo-Rev-Erbα was incubated with PGRMC2, the mixture separated by native electrophoresis, and the gel stained for heme and protein. In-gel staining revealed heme bound to PGRMC2, but not to apo-Rev-Erbα (Fig. 1d). In contrast, apo-Rev-Erbα incubated with wild-type PGRMC2, but not with a heme-binding mutant (PGRMC2 3xM, Extended Data Fig. 1d, e), showed heme staining, indicating transfer of heme from PGRMC2 to apo-Rev-Erbα (Fig. 1d). Consistent with a role in serial trafficking16, PGRMC2 displayed medium-low affinity for heme (Kd 1.4 x 10⁻⁶ M ferric, 5.3 x 10⁻⁶ M ferrous; Fig. 1e). Total intracellular heme is the sum of heme bound covalently or nearly so as a cofactor, and labile, or signaling, heme buffered by proteins and available for exchange and regulatory events4. To assess the ability of PGRMC2 to modulate subcellular labile heme levels, an indication of its capacity to mobilize heme, we transfected HEK293T cells with GFP:hemoprotein peroxidase fusion reporters targeted to mitochondria, ER, cytosol, and nuclei17 (Extended Data Fig. 1f). The activity of these reporters depends on the availability of labile heme in these compartments. Because intracellular labile heme may be derived from media or from endogenous synthesis, to examine the contribution of PGRMC2 to heme mobilization from either source, we used succinylacetone (SA) to block biosynthesis18 and heme-depleted FBS to minimize exogenous heme uptake. Measurements in control cells indicated that the mitochondrial and nuclear labile heme pools derived entirely from endogenous synthesis, for the activity of these reporters was fully blunted in cells treated with SA (Fig. 1f). In contrast, both endogenous and exogenous heme contributed to the cytosolic and ER labile heme pools (Fig. 1f). PGRMC2 depletion resulted in decreased reporter activity in mitochondria, nuclei, and, to a lesser extent, the ER, indicating reduced presence of labile heme (Fig. 1f, Extended Data Fig. 1g). We next considered how PGRMC2, localized in the ER and nuclear envelope, might acquire heme. Interestingly, PGRMC1 forms a complex with FECH in the mitochondrial outer membrane that controls heme release19. PGRMC1 and PGRMC2 also interact20, and both can be found in mitochondria-associated membranes21,22. We noted that, in primary brown adipocytes, PGRMC2 interacted with PGRMC1, but not with glyceraldehyde-3-phosphate dehydrogenase, recently designated a cytosolic heme chaperone16 (Fig. 1g). No interaction was detected when an antibody targeting the heme-binding domain was used, suggesting that PGRMC2 interacts with PGRMC1 at or near this region (Extended Data Fig. 1h). Depletion of PGRMC1 resulted in reduced labile heme in all subcellular compartments, likely a reflection of its broader pattern of localization9 (Fig. 1h). Dual PGRMC1/2 knockdown had no added effect (Fig. 1h, Extended Data Fig. 1g), hinting that PGRMC2 acts downstream of PGRMC1 to traffic endogenously-synthesized heme. These findings suggest a model in which mitochondria-bound PGRMC1 transfers heme to ER-bound PGRMC2, which delivers heme to proteins in the ER and nucleus, including heme-responsive transcription factors such as Rev-Erbα.
Fig. 1 |. PGRMC2 controls intracellular distribution of labile heme.
a, Purified PGRMC2 has the color of hemoproteins. b, LC-MS/MS spectra of PGRMC2 and hemin standard. c, Peroxidase activity of apoHRP with PGRMC2. PGRMC2, hemin, apoHRP, and apoHRP plus protoporphyrin IX (PPIX) show no activity. Hemin served as positive control. Technical duplicates shown. d, Native PAGE of WT, heme-binding mutant (3xM) PGRMC2, and apo-Rev-Erbα LBD alone or in combination stained in-gel for heme (top) or protein (bottom). Black arrows, PGRMC2; red arrows, Rev-Erbα. Hemin (20 μM) served as positive control. PGRMC2 3xM and apo-Rev-Erbα LBD show no heme staining. e, Differential spectroscopy of PGRMC2 heme-binding domain with increasing amounts of ferric or ferrous (in presence of 10 mM dithionite) hemin. Titration curves represent differential absorbance at 405 (ferric) and 400 (ferrous) nm. Kd expressed as mean ± s.d. f, Peroxidase activity in HEK293T cells co-transfected with labile heme reporters and scramble or Pgrmc2 siRNA, and exposed to succinylacetone (SA), heme-depleted FBS, or both for 48 hr. g, Endogenous PGRMC2 co-immunoprecipitates with endogenous PGRMC1 in primary brown adipocytes. h, Peroxidase activity in HEK293T cells co-transfected with labile heme reporters and scramble, Pgrmc1, or Pgrmc1/2 siRNA and treated as in panel f. Scramble group is repeated from panel f. f, h, Biologically independent samples (n = 6). Representative results from two (b, g) or three (a, c, d, e, f, h) independent experiments. Data presented as mean ± s.d, *p<0.05, ***p<0.001 vs. Scramble-Basal, determined by two-way ANOVA with multiple comparisons and a Tukey’s post-test.
PGRMC2 is required for thermogenesis
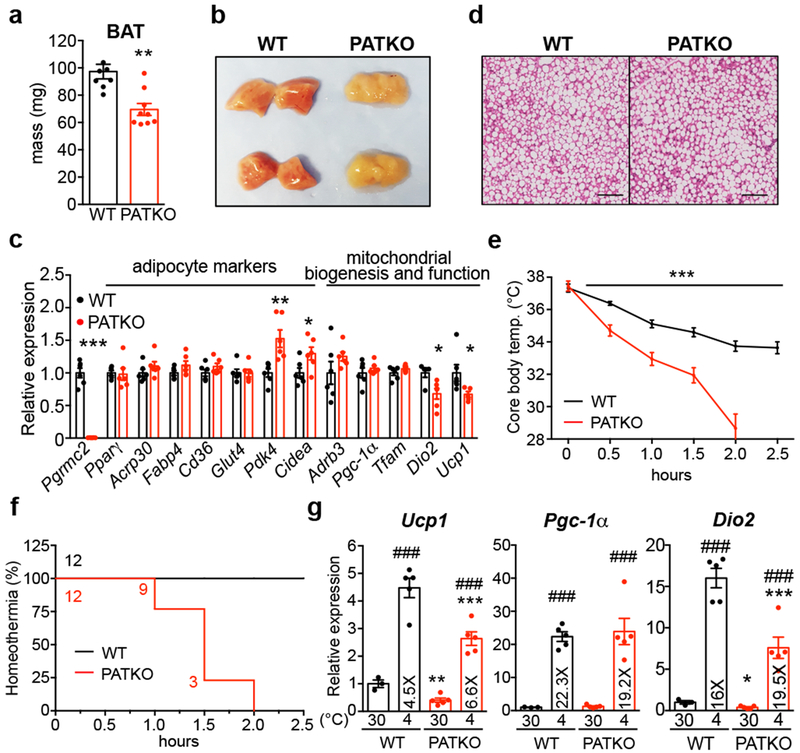
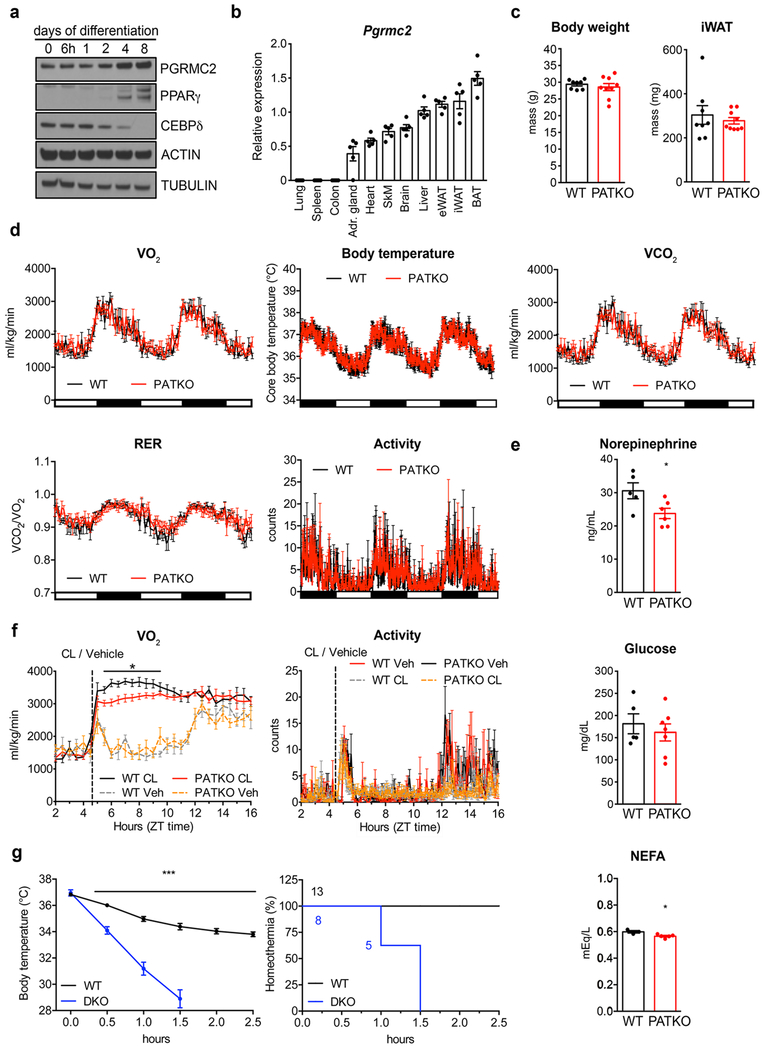
To evaluate the importance of PGRMC2-mediated heme mobilization in vivo, we focused on adipose tissue, for PGRMC2 is enriched in adipose depots, particularly brown adipose tissue (BAT) (Extended Data Fig. 2a, b>). We generated adipose-specific PGRMC2-null mice (PGRMC2 Adipose Tissue Knockout; PATKO) lacking PGRMC2 in mature adipocytes. To avoid compensation mechanisms, unless noted, all procedures were conducted at thermoneutrality. PATKO mice adapted to 30°C showed no difference in body weight or white adipose tissue (WAT) mass (Extended Data Fig. 2c) but had reduced BAT weight (Fig. 2a). Notably, the appearance of PGRMC2-deficient BAT was dramatically altered, with loss of its distinctive reddish color (Fig. 2b). There was, however, no difference in expression of brown adipocyte markers (Fig. 2c). Further, histological comparison failed to reveal any difference (Fig. 2d). These intriguing findings led us to test the functionality of PGRMC2-deficient BAT. Reflecting the minor role of BAT at thermoneutrality, PATKO mice were indistinguishable from wild-type (WT) mice in energy balance studies (Extended Data Fig. 2d). However, in contrast to WT mice that defended body temperature when exposed to cold (4°C), PATKO mice rapidly became hypothermic and perished if not rescued (Fig. 2e, f). This total impairment of adaptive thermogenesis was not due to reduced sympathetic stimulation, for the transcriptional response to norepinephrine (NE) was intact (Fig. 2g), despite a modest decrease of plasma NE (Extended Data Fig. 2e). Plasma glucose during challenge was similar to that of WT mice, and non-esterified fatty acids (NEFAs) were minimally reduced (Extended Data Fig. 2e). To confirm that the thermogenic defect was independent of norepinephrine levels, we used the β3-adrenergic receptor agonist CL316,243. Injection of CL316,243 elicited an immediate and sustained increase in oxygen consumption in WT mice, a response significantly blunted in PATKO mice (Extended Data Fig. 2f). Further, consistent with our model of mitochondrial heme mobilization, adipose-specific PGRMC1/2 double knockout mice were also cold-sensitive, perhaps more so than PATKO mice (Extended Data Fig. 2g). These findings stress the importance of the PGRMC1/2 heme trafficking pathway for adaptive thermogenesis.
Fig. 2 |. PATKO mice are cold-sensitive.
a, Weight and b, gross appearance of BAT of chow-fed WT (n = 8) and PATKO (n = 9) mice at 30°C. c, Expression of thermogenic genes is decreased in PATKO BAT (WT n = 5; PATKO n = 6). d, H&E stains of BAT. Representative images from two independent experiments (n = 5). e, PATKO mice are cold intolerant (n = 12). Challenge started at ZT5 (11 am). f, Survival curves at 4°C (homeothermia = 31°C). g, PATKO BAT responds normally to adrenergic signaling (WT n = 4; PATKO n = 5). a-g, Biologically independent samples. Data presented as mean ± s.e.m. *p<0.05, **p<0.01, ***p<0.001 PATKO vs. WT, ###p<0.001 30°C vs. 4°C determined by two-tailed Student’s t-test (a, c) or two-way ANOVA with multiple comparisons and a Bonferroni’s post-test (e, g).
PGRMC2 deficiency engenders mitochondrial dysfunction
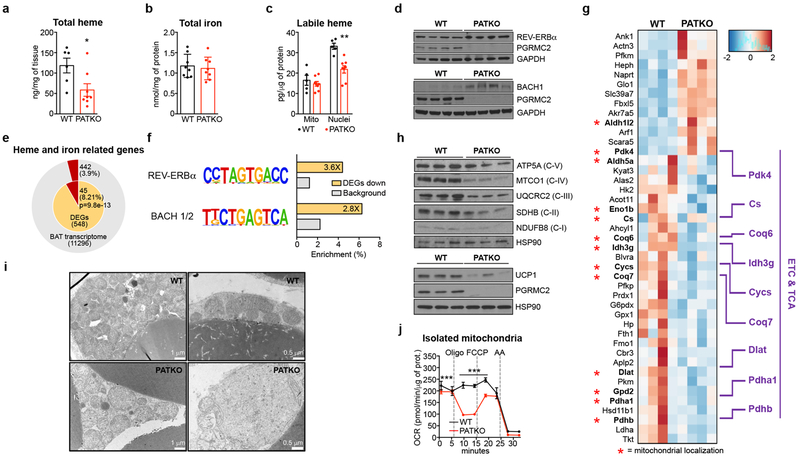
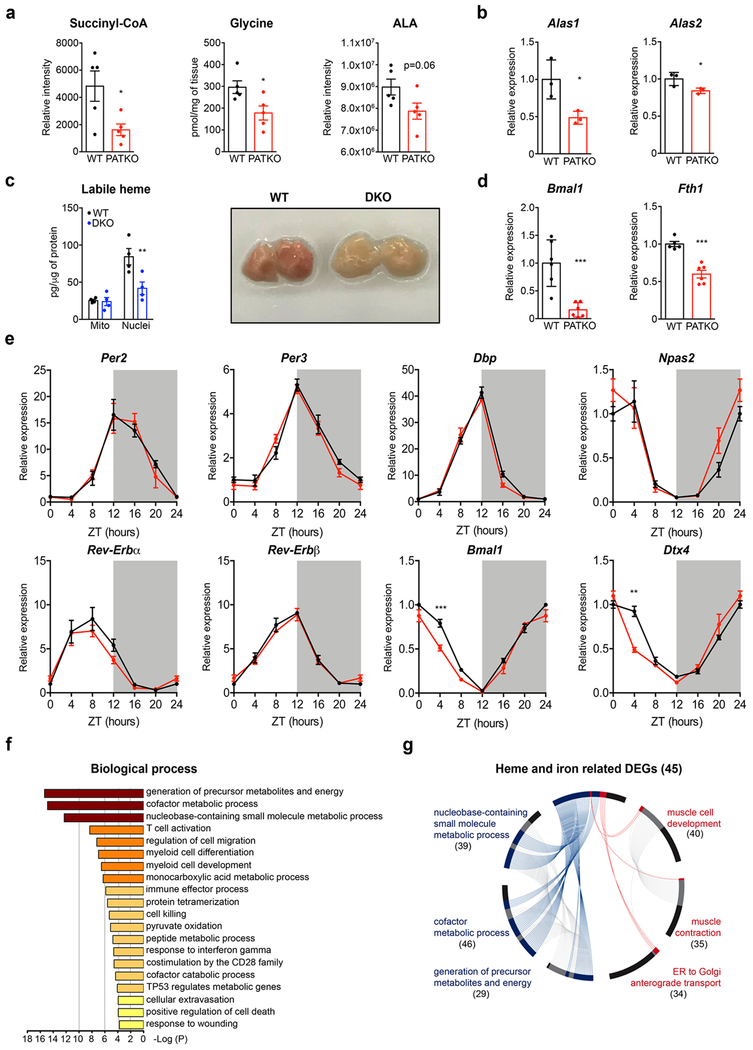
To determine the basis of the defects of PGRMC2-null BAT, we measured total heme content and found it considerably reduced (~60%; Fig. 3a). To probe the origins of this difference, we quantified heme precursors and found reduced levels of succinyl-CoA and glycine, the substrates of ALAS1, the rate-limiting enzyme of heme biosynthesis (Extended Data Fig. 3a). Accordingly, 5-aminolevulinic acid levels, the product of ALAS1, tended to decrease (Extended Data Fig. 3a). We also noted reduced expression of Alas1 and Alas2 (Extended Data Fig. 3b), indicating that defects in biosynthesis contribute to decreased total heme in PATKO BAT. Reduced heme levels were not due to iron deficiency, for iron content was not different (Fig. 3b), suggesting that tissue heme uptake was unaffected. Importantly, labile heme levels were significantly decreased in nuclei purified from PATKO (Fig. 3c) and PGRMC1/2 null BAT, which shared the discolored appearance of PATKO BAT (Extended Data Fig. 3c). In the nucleus, heme regulates the activity of several transcription factors that, upon binding heme, are ultimately degraded. These include Rev-Erbα and the transcriptional repressor BACH123,24. Rev-Erbα and BACH1 protein levels were higher in PATKO BAT (Fig. 3d), indicating that reduced nuclear labile heme resulted in stabilization of these factors. Accordingly, expression of Bmal1 and Fth1, Rev-Erbα and BACH1 targets respectively, was reduced (Extended Data Fig. 3d). The circadian pattern of Rev-Erbα mRNA expression25 was not altered in PATKO mice (Extended Data Fig. 3e), suggesting that greater Rev-Erbα protein levels in PATKO BAT are likely the result of reduced degradation. RNAseq analysis showed that among differentially expressed genes (DEGs) between WT and PATKO BAT (adjusted p<0.05; 312 DEGs up, 236 DEGs down; Supplementary Table 1), heme and iron homeostasis genes were enriched (45 genes, 8.2% of DEGs vs. 3.9% in the BAT transcriptome; p<10−13) (Fig. 3e). Enhancer analysis of downregulated DEGs in PATKO BAT revealed an enrichment (p<10−7) of Rev-Erbα and BACH1/2 motifs (Fig. 3f and Supplementary Table 2), consistent with altered regulation of heme-sensitive transcription. The majority of heme and iron-linked DEGs were present in the three most downregulated pathways, which relate to metabolic processes and energy generation and contain many mitochondrial proteins. Expression of electron transport chain (ETC) and tricarboxylic acid (TCA) cycle genes (Extended Data Fig. 3f, g) was broadly decreased in PATKO BAT and levels of all ETC proteins analyzed were notably lower (Fig. 3g, h). Further, PATKO BAT had strikingly reduced levels of uncoupling protein 1 UCP1 (Fig. 3h), a finding consistent with greater stability of Rev-Erbα which directly represses Ucp126. Beyond its role in uncoupling, UCP1 regulates mitochondrial integrity27. Microscopy revealed that PGRMC2-null brown adipocytes have large, swollen, mitochondria with few disorganized cristae (Fig. 3i), indications of mitochondrial dysfunction. Indeed, mitochondria isolated from PATKO BAT had reduced basal and drastically decreased uncoupled respiration (Fig. 3j). These findings demonstrate that in absence of PGRMC2, labile heme in the nucleus is reduced, leading to changes in the heme-responsive transcriptome that cause mitochondrial dysfunction.
Fig. 3 |. Pgrmc2 regulates heme-sensitive transcription and mitochondrial function in BAT.
a, Total heme (WT, n = 6; PATKO, n = 8) and b, iron (n = 8) levels in BAT. c, Labile heme in mitochondrial and nuclear fractions of BAT (WT n = 5; PATKO n = 8). d, REV-ERBα and BACH1 levels in BAT. e, Genes related to heme and iron metabolism (red portions) are enriched in differentially-expressed genes. f, REV-ERBα and BACH1/2-binding motifs are enriched in genes downregulated in PATKO BAT. g, Heat map of heme and iron related genes shows a global decrease of ETC and TCA gene expression. h, UCP1 and OXPHOS proteins are reduced in PATKO BAT. i, Electron microscopy shows altered mitochondrial morphology in PATKO BAT. Representative images from 4 biologically independent samples. j, Oxygen consumption rate (OCR) of mitochondria isolated from BAT (n = 6). a-j, Biologically independent samples. Representative results from two (a-c, j) or three (d, h) independent experiments. Data presented as mean ± s.e.m. *p<0.05, **p<0.01, ***p<0.001 vs. WT determined by two-tailed Student’s t-test.
Endogenous heme controls mitochondrial function
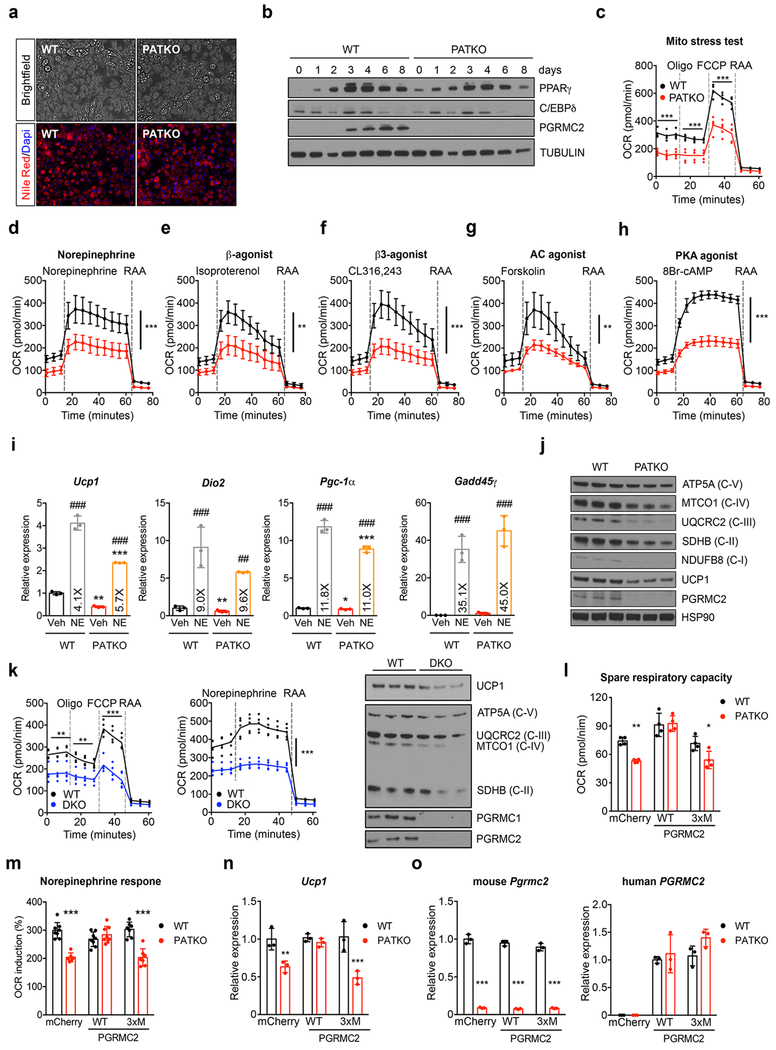
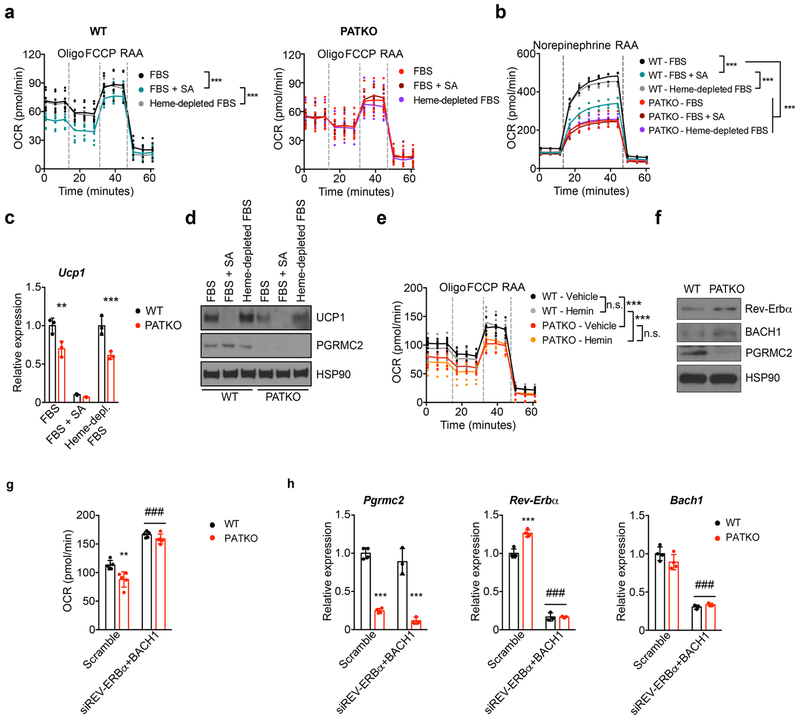
Primary brown PATKO adipocytes recapitulated these defects: they showed severely reduced respiratory capacity, a dramatically blunted response to adrenergic stimuli without alterations in the transcriptional response to NE, and decreased levels of UCP1 and ETC proteins (Extended Data Fig. 4a–j). Similar, perhaps greater, defects were noted in PGRMC1/2-null adipocytes (Extended Data Fig. 4k). Introduction of human PGRMC2 into mouse PGRMC2-null brown adipocytes restored mitochondrial bioenergetics and UCP1 levels, while expression of a PGRMC2 heme-binding mutant did not, indicating that these flaws relate to the ability of PGRMC2 to mobilize heme (Extended Data Fig. 4l–o). Notably, mirroring the effect of PGRMC2 deletion, inhibition of heme synthesis was sufficient to impair mitochondrial function and deplete UCP1 in WT cells (Extended Data Fig. 5a–d). Neither depletion of exogenous heme, nor addition of hemin affected mitochondrial respiration in WT or PATKO cells (Extended Data Fig. 5a–e). These observations show that PGRMC2-dependent mobilization of endogenous heme regulates mitochondrial function in brown adipocytes. Lastly, we found that both Rev-Erbα and BACH1 proteins were more abundant in PATKO cells (Extended Data Fig. 5f). Dual knockdown of these factors restored basal respiration in PGRMC2-null adipocytes (Extended Data Fig. 5g, h), indicating that they are key mediators of the transcriptional response to heme and its impact on mitochondrial function.
Adipose PGRMC2 regulates systemic metabolism
We next gauged the significance of adipose PGRMC2 for glucose homeostasis. PATKO mice housed at room temperature (RT) fed high-fat diet (HFD) showed no differences in body weight or composition, except for decreased BAT mass (Extended Data Fig. 6a, b). However, they had higher fasting glycemia (Fig. 4a) and decreased glucose tolerance and insulin sensitivity (Fig. 4b, c). They also exhibited hyperlipidemia and exacerbated liver steatosis (~70% more triglyceride; Extended Data Fig. 6c–e), factors that likely heightened insulin resistance. The BAT of HFD-fed PATKO mice showed no histological abnormalities (Extended Data Fig. 7a) but had greatly reduced Ucp1 expression (~40% less; Fig. 4d). Bmal1 and Fth1 expression was also decreased (Extended Data Fig. 7b). Analysis of WAT depots failed to reveal extensive differences in adipocyte size, immune cell infiltration, or gene expression in inguinal or epididymal WAT (Extended Data Fig. 7c–e). Notably, Bmal1 expression was reduced in PATKO inguinal WAT (Extended Data Fig. 7e). We surmise that hastened metabolic deterioration in HFD-fed PATKO mice likely reflects the aggregate of defects in BAT and WAT.
Fig. 4 |. PGRMC2 controls systemic glucose homeostasis.
a, Glucose (WT n = 9; PATKO n = 10) and insulin (n = 6) in WT and PATKO mice fed high-fat diet. b-c, Glucose (b) and insulin (c) tolerance tests after 10 (GTT) and 12 (ITT) weeks of HFD (GTT: WT n = 8, PATKO n = 11; ITT: WT n = 6, PATKO n = 9). d, Ucp1 mRNA in BAT of HFD-fed WT (n = 9) and PATKO (n = 10) mice. e, Glucose and insulin levels in DIO mice treated with vehicle or CPAG-1 for 30 days (n = 7). f-g, Glucose (f) and insulin (g) tolerance tests in DIO mice after 14 (GTT) and 20 (ITT) days of treatment (n = 7). h, H&E stains of BAT. Representative images from 4 biologically independent samples. i, Ucp1 mRNA levels in BAT of treated DIO mice (n = 7). j, UCP1 and Rev-Erbα levels in BAT of treated DIO mice. k, Nuclear labile heme levels in BAT of DIO mice treated with CPAG-1 for 4 days (n = 4). a-k, Biologically independent samples, representative results from two independent experiments. Data presented as mean ± s.e.m. *p<0.05, **p<0.01, ***p<0.001 vs. WT or vehicle determined by two-tailed Student’s t-test (a, d, e, i, k) or two-way ANOVA with multiple comparisons and a Bonferroni’s post-test (b, c, f, g).
PGRMC2 activation mitigates metabolic disease
The deleterious effects on metabolism of adipose PGRMC2 deletion suggested that activation of PGRMC2 function might reverse features of metabolic syndrome. Thus, we treated Diet-Induced-Obese (DIO) mice at RT with a PGRMC2 small-molecule activator we previously described (compound 27 in ref. 5; referred hereafter as CPAG-1). CPAG-1 treatment had no effect on weight or food intake (Extended Data Fig. 8a) but treated mice had reduced fasting glycemia and insulin levels (Fig. 4e) and improved glucose tolerance and insulin sensitivity (Fig. 4f, g). BAT histology showed decreased lipid content and an increase in multilocular adipocytes (Fig. 4h), features indicative of improved function. Expression of Ucp1 and Bmal1 was also upregulated (Fig. 4i and Extended Data Fig. 8b), changes suggestive of reduced levels of Rev-Erbα. Indeed, Rev-Erbα protein was decreased in BAT of CPAG-1-treated mice, and UCP1 protein was increased (Fig. 4j). Labile heme in the nucleus of brown adipocytes from CPAG-1-treated mice was significantly increased within 4 days of treatment (Fig. 4k), suggesting that decreased Rev-Erbα protein was likely the result of heme-induced degradation. No histological differences were found in inguinal WAT (Extended Data Fig. 8c), but Ucp1 and Pgc-1α expression was increased (Extended Data Fig. 8d). Histology did reveal a remarkable improvement in epididymal WAT, with fibrosis and inflammation noticeably decreased (Extended Data Fig. 8e, f). The liver of CPAG-1-treated mice appeared modestly less steatotic and expression of gluconeogenic genes and Tnfα was reduced (Extended Data Fig. 8g, h). CPAG-1 treatment also increased hepatic nuclear labile heme levels (Extended Data Fig. 8i). Given that CPAG-1 interacts very weakly with PGRMC1 (ref. 5 and Extended Data Fig. 9), we suggest it may act primarily through PGRMC2 to increase heme flux to the nucleus and elicit the benefits seen.
Discussion
We have described herein a role for PGRMC2 in transport of mitochondrial heme. In absence of PGRMC2, less labile heme reaches the nucleus; ensuing alterations in heme-sensitive transcription spawn mitochondrial dysfunction in brown adipocytes (Extended Data Fig. 10). These defects compromise, not only the primary function of BAT, to preserve body temperature, but also its contribution to systemic glucose homeostasis. Given its high expression across white depots, further studies will be required to determine whether PGRMC2 performs a similar role in WAT. Nonetheless, our findings provide a compelling glimpse of how heme dynamics in adipocytes can impact physiology. Heme levels and expression of biosynthetic enzymes are reduced in visceral fat of obese humans28, stressing the need to examine the link between adipocyte heme homeostasis and metabolic disease. Because PGRMC2 is restricted in its tissue distribution, additional heme chaperones likely remain to be discovered. Finally, we have shown that pharmacological activation of PGRMC2 may be of utility in metabolic disease. Given the interest in identifying signaling pathways that enhance adipocyte function and correct obesity-linked adipose tissue defects29, our findings put forth the modulation of intracellular heme dynamics as a potentially innovative therapeutic strategy.
METHODS
Reagents.
Hemin, protoporphyrin IX, oligomycin A, carbonyl cyanide 4-(trifluoromethoxy) phenylhydrazone (FCCP), rotenone, antimycin A, 3-isobutyl-1-methylxanthine (IBMX), BSA, mannitol, norepinephrine, isoproterenol, 8-Br-cAMP, and succinylacetone were purchased from Sigma-Aldrich. CL 316,243 was obtained from Cayman Chemical. Forskolin was obtained from Chem Impex International. Insulin (Novolin) was purchased from Novo-Nordisk. Complete EDTA-free protease inhibitor cocktail was obtained from Roche. DMEM and other Gibco-branded cell culture products were purchased from Thermo Fisher. Heme-depleted FBS was prepared by treating FBS with 20 mM ascorbic acid for 16 hr, followed by 24 hr dialysis against PBS. Heme depletion was verified by measuring optical absorbance at 405 nm. CPAG-1 was synthesized as previously reported5. ON-TARGET siRNA SMARTpools against human PGRMC2 (L-010639-00-0005), PGRMC1 (L-010642-00-0005), and mouse Nr1d1 (L-051721-00-0005), and BACH1 (L-042956-01-0005), as well as a Non-targeting Pool (D-001810-10-05) were purchased from Dharmacon. HEK293T cells were obtained from ATCC (CRL-3216) having undergone short-tandem repeat verification. Cells were routinely tested for mycoplasma and were never positive.
Protein production.
Full-length PGRMC2 in a bacterial expression vector (GenBank Accession no. NM_027558; Genecopoeia Ex-Mm25103-B01) was transformed into chemically competent BL21(DE3) cells (Thermo Fisher) and grown at 37°C to an OD600 of 0.8. Cells were induced with 1 mM IPTG and grown for 12 hr at 30°C. Cells were harvested and stirred at room temperature in 50 mM Tris-HCl, 150 mM NaCl pH 8.5 containing 1% Triton X-100, 100 μg/mL lysozyme, 100μg/mL DNase I, 10 mM MgCl2, and 10 mM CaCl2, and 1X Complete EDTA-free protease inhibitor cocktail (Roche) for 1 hr. After sonication, the lysate was centrifuged at 6,000 x g for 30 min and the supernatant purified using nickel affinity chromatography. After elution, the protein was dialyzed into 50 mM Tris-HCl, 150 mM NaCl, pH 7.4, and purified by HiLoad 16/600 Superdex 75 size exclusion chromatography (GE Healthcare). A mouse PGRMC2 heme-binding mutant was created by mutating 3 amino acids (Y131F, K187A, Y188F) using a Quikchange II XL Site-Directed Mutagenesis Kit (Agilent), verified by DNA sequencing, and expressed and purified as described above. To generate the PGRMC2 cytochrome b5 heme-binding domain, residues 102-209 of human PGRMC2 were codon-optimized, synthesized (Integrated DNA Technologies), and inserted into the pET21a vector. The plasmid construct was transformed into BL21(DE3) cells (Thermo Fisher). Cells were grown at 37°C to an OD600 of 1.0 and induced with 1 mM IPTG for 5 hr, harvested, and resuspended in 50 mM Tris-HCl, 1 mM EDTA, 0.01% NaN3, 1 mM DTT, 25% sucrose, and lysed in 50 mM Tris-HCl, 1 mM EDTA, 0.01% NaN3, 1 mM DTT, 200 mM sodium chloride, 1% sodium deoxycholate, and 1% Triton X-100. To isolate inclusion bodies, lysed cells were centrifuged at 6,000 x g for 20 min and washed extensively with 50 mM Tris-HCl, 1 mM EDTA, 0.01% NaN3, 1 mM DTT, 25% sucrose, 100 mM sodium chloride, and 0.5% Triton X-100. Inclusion bodies were subjected to a final wash in the same buffer without Triton X-100. To denature inclusion bodies, ~200 mg of inclusion bodies was resuspended in 100 mM Tris-HCl, 6 M guanidinium chloride, and 20 mM β-mercaptoethanol for 1 hr at RT. Denatured inclusion bodies were refolded overnight at 4°C in an oxidative refolding buffer containing 400 mM L-arginine, 100 mM Tris-HCl, 5 mM reduced glutathione, 0.5 mM oxidized glutathione, 10 mM EDTA, and 200 mM phenylmethylsulphonyl fluoride. Refolded protein was concentrated and purified using HiLoad 16/600 Superdex 75 size exclusion chromatography (GE Healthcare). Purity of PGRMC2 proteins was confirmed using SDS-PAGE. Soret and α, β absorption spectra were measured on a SpectraMAX 250 reader (Molecular Devices) at room temperature. Purified PGRMC2 protein was incubated for 15 min with 10 mM dithionite to reduce the heme group. Human REV-ERBα ligand binding domain (LBD, residues 281-614) with an N-terminal hexahistidine tag and a tobacco etch virus (TEV) protease cleavage site was inserted into a pET46 vector and expressed in Escherichia coli BL21(DE3) cells. Cells were grown in at 37 °C overnight and induced in autoinduction media at 37 °C for 5 hr, 30 °C for 1 hr, and 22 °C for 16 hr. Cells were harvested and pellets stored at −80 °C. Pellets were thawed on ice and resuspended in lysis buffer without imidazole (40 mM NaHPO4, pH 7.4, 500 mM NaCl, 10% glycerol, 2.5 mM DTT, 0.1% Tween-20) at 40 mL buffer per 5 g pellet. The cell slurry was sonicated on ice in 15 sec on/30 sec off intervals (75% amplitude) for 5 min total. Lysed cells were centrifuged at 14,000 rpm for 30 min at 4°C. The supernatant was filtered through a 0.4 μm PES membrane Nalgene Rapid-Flow bottle-top filter and affinity purified using 2 x 5 mL HisTrap IMAC columns (GE Healthcare) affixed to an Äkta Start. After loading, columns were washed with 100 mL wash buffer (40 mM NaHPO4, pH 7.4, 500 mM NaCl, 10% glycerol, 15 mM imidazole, 1 mM DTT). The protein was eluted using a 10 column-volume elution gradient with elution buffer (40 mM NaHPO4, pH 7.4, 500 mM NaCl, 10% glycerol, 500 mM imidazole, 1 mM DTT). The protein was eluted after >50% elution buffer then pooled and dialyzed in 10 kDa MWCO SnakeSkinTM dialysis tubing (Thermo Fisher) for 24 hr at 4°C to remove imidazole and bound heme in 2 L dialysis buffer (40 mM NaHPO4, pH 7.4, 500 mM NaCl, 10% glycerol, 10 mM DTT, 0.1% Tween-20, 0.5 mM EDTA). After dialysis, the protein was concentrated using a 30 kDa MWCO Amicon Ultra centrifugal concentrator (EMD Millipore). The protein was further purified by size exclusion chromatography (Äkta Pure) using a SuperdexTM 75 10/300 GL column in gel filtration buffer (20 mM NaHPO4, pH 7.4, 50 mM NaCl, 50 mM L-arginine, 50 mM L-glutamate, 0.5 mM EDTA). The protein was pooled and confirmed to be >90% pure by LC-MS and SDS-PAGE. The fraction of final purified 6xHis-REV-ERBα LBD bound to heme was assessed using the extinction coefficient for the heme Soret peak (ε415) of 101.85 = 1 mM, and 6xHis-REV-ERBα LBD was confirmed to be >95% heme-free.
Heme titration assay.
The affinity of PGRMC2 cytochrome b5 heme-binding domain for ferric and ferrous heme was measured by spectroscopy of the UV-visible spectrum in the Soret region using a SpectraMAX 250 reader. Sequential aliquots of hemin in DMSO were added to the sample well containing 10 μM apo-PGRMC2 and the reference well in order to obtain a 2 μM increment of hemin concentration per addition. Spectra were recorded 3 min after each addition of hemin. The difference in absorbance at 420 nm was plotted in relation to hemin concentration, and dissociation constants (Kd) calculated with GraphPad Prism 6 using a quadratic binding equation.
Heme transfer assay.
25 μL of 200 nM apoHRP (Calzyme Laboratories) was incubated with 25 μL of 5 μM purified PGRMC2 protein. After 5 min at room temperature, 150 μL of BioFX TMB One Component HRP microwell Substrate (Surmodics) was added to wells and absorbance at 405 nm measured immediately for 15 min. As a positive control, apoHRP was incubated with 0.3 nM hemin for 5 min and absorbance measured as described.
Native PAGE and in-gel heme staining.
Heme transfer was assessed by mixing 10 μg of WT or mouse PGRMC2 heme-binding mutant (3xM) with 10 μg of apo-REV-ERBα protein and incubating for 30 min at 37°C. After incubation, 2X Native Tris-Glycine sample buffer (Life Technologies) was added and samples separated by electrophoresis using Novex Tris-Glycine 4-20% gels and Tris-Glycine Native Running Buffer (Life Technologies) for 6 hr. The gel was washed for 10 min with water and heme staining was performed using the BioFX TMB One Component HRP Microwell Substrate (Surmodics). After imaging the heme stain, the gel was washed overnight with water and counterstained with Coomassie for protein detection.
Mass spectrometry.
To detect heme in purified PGRMC2 protein, 5 μL of 20 mg/mL PGRMC2 were extracted with 1 mL of Folch solution (2:1 chloroform:methanol) and washed with 200 μL of water. The extraction solution was then vortexed and centrifuged at 1000 x g, 4°C for 10 min and the lower phase extracted and dried down. Prior to LC-MS analysis, the sample was reconstituted in methanol. A hemin standard solution was prepared at 10 μM. LC-MS analysis was performed on an I-class UPLC system coupled with a Synapt G2-Si mass spectrometer via an electrospray ionization (ESI) source from Waters. The positive-mode (+) ESI conditions were as follows: capillary, +3.00 kV; sampling cone, 40 V; source temperature, 100°C; desolvation temperature, 250°C; desolvation gas flow, 600 L/hr; and cone gas flow, 50 L/hr, respectively. Leucine–enkephalin (m/z 556.2771) was used for lock mass correction. Liquid chromatography was performed with A = 40:60 water:acetonitrile + 1mM ammonium formate, B = 90:10 2-propanol:acetonitrile. A Waters ACQUITY UPLC BEH C18 column (1.7 μm, 2.1 mm X 100 mm) was used at a flow rate of 250 μL/min. Initially, the mobile phase composition consisted of 32% B and held for 1 min after injection and its composition was increased over the length of the gradient (15 min, B = 97%) in short increments adapted from Breitkopf et al.30 The injection volume was 2 μL. For heme quantification in tissue, BAT was isolated from WT and PATKO mice housed at 30°C after 10 min of perfusion with cold PBS. 10-25 mg of frozen tissue was homogenized in 300 μL of 1% formic acid in dH2O and an internal standard added. Heme was extracted in Folch solution (2:1 chloroform:methanol). After centrifugation at 4,000 x g for 10 min at 4°C, heme was re-extracted from the organic phase with 1 volume of 1.4 N NaOH. Samples were centrifuged at 4,000 x g for 10 min at 4°C and the aqueous phase collected for MS analysis. Hemin was quantified on an Agilent 6495 triple quadrupole with a jet stream source coupled to an Agilent 1290 UPLC. As internal standard, deuteroporphyrin (Frontier Scientific) was used and the monitored transitions were m/z 616.1 → 557.1 (quantitative), m/z 616.1 → 498.2 (qualitative) for hemin, and m/z 564.0 → 505.0 for deuteroporphryin. Jet stream was set at gas temp 200°C, gas flow 12 L/min, nebulizer pressure 30 psi, sheath gas temp 325°C, sheath gas flow 10 L/min, cap V = 400 V, nozzle V = 2000 V. Liquid chromatography was performed with A = 90:10 water:methanol + 0.1% ammonium hydroxide and + 10 mM ammonium formate, B = 65:30:10 2-propanol:methanol:water + 0.1% ammonium hydroxide and + 10 mM ammonium formate. All solvents were LC-MS grade. An Agilent extend-C18 column (1.8 μm, 2.1 x 50 mm) was used at a flow rate of 0.2 mL/min. Initially, the mobile phase consisted of 5% B and, after injection, its composition increased linearly to 95 % B in 6 min and held at 95% for 3 min. The injection volume was 5 μL. Heme content was normalized per mg of tissue. Quantitative analysis of glycine, aminolevulinic acid, and succinyl-CoA was performed using a QQQ mass spectrometer operated in positive-ion mode (Xevo TQ-XS from Waters). Briefly, 10 mg of frozen BAT were homogenized with ice cold 80% methanol and glass beads and incubated on ice for additional 10 min. The tissue lysate was centrifuged at 18,000 x g for 10 min at 4°C and split into two aliquots followed by drying down in a vacuum concentrator and stored at −80°C prior to LC-MS/MS analysis. For glycine and aminolevulinic acid analysis, an aliquot was reconstituted in 1:1 acetonitrile:water and injected into a Waters ACQUITY UPLC BEH Amide column (1.7 μm, 2.1 mm X 100 mm) at a flow rate of 400 μL/min. The mobile phases consisted of A = water + 0.1% formic acid and B = acetonitrile + 0.1% formic acid. Initially, the mobile phase composition consisted of 95% B and held for 1 min after injection and its composition was decreased to 65% over 6 min and then to 40% over 3 min and held for an additional 1 min. The following quantifier and qualifier transitions (collision energy in eV) were used for each metabolite: glycine: 76.0 → 30.3 (6 eV) and 48.2 (4 eV); 13C-glycine: 78.0 → 31.0 (6 eV) and 49.0 (4 eV); aminolevulinic acid: 132.2 → 55.1 (18 eV), 68.3 (18 eV), 86.0 (10 eV), 114.0 (6 eV). For succinyl-CoA, an aliquot was reconstituted in 50 mM ammonium acetate (pH 6.8 adjusted with ammonium hydroxide) and analyzed as soon as possible once samples had been reconstituted to avoid degradation31–34. Liquid chromatography was performed with A = 50 mM ammonium acetate (pH 6.8) and B = 80% methanol. A Waters ACQUITY UPLC BEH C18 column (1.7 μm, 2.1 mm X 100 mm) was used at a flow rate of 250 μL/min. Initially, the mobile phase composition consisted of 2% B and held for 1.5 min after injection and its composition was increased to 15% over 1.5 min and then to 95% over 1.5 min and held for 9 min. The following quantifier and qualifier transitions (collision energy in eV) were used for succinyl-CoA: 868.1 → 99.0 (54 eV), 136.3 (54 eV), 259.1 (54 eV) and 361.3 (54 eV).
Labile heme reporters targeted to subcellular compartments.
HEK293T cells grown in DMEM with 10% Fetal Bovine Serum were transiently transfected in OptiMEM for 8 hr using Dharmafect Duo transfection reagent (Dharmafect) in 96-well plate format. Peroxidase reporters (pEGFP-mitoAPX, pEGFP-APX, pEGFP-NLS-APX, and pmCherry-ER-HRP)17 were co-transfected with 50 nM siRNA against Pgrmc2, Pgrmc1, the combination, or a scramble control. After transfection, cells were switched to basal media (DMEM with 10% FBS), basal media plus 0.5 mM succinylacetone, heme-depleted media (DMEM with 10% heme-depleted FBS), or heme-depleted media plus 0.5 mM succinylacetone. Cells were lysed 72 hr later in 100 μL heme lysis buffer (150 mM NaCl, 20 mM HEPES, 0.5% Triton X-100, with Protease Inhibitor Cocktail Set III). 50 μL of lysate was incubated with the BioFX TMB One Component HRP microwell Substrate (Surmodics). Absorbance at 620 nm was measured after 5 min for the ER-HRP reporter, and after 30 min for mitochondrial, nuclear, and cytosolic APX reporters.
Co-Immunoprecipitation.
Endogenous PGRMC2 and PGRMC1 were immunoprecipitated from primary brown adipocytes differentiated in vitro using anti-PGRMC2 and anti-PGRMC1 antibodies. Cells were lysed in IP lysis buffer (150 mM NaCl, 20 mM Tris-HCl, 10% glycerol, 1% Triton X-100, complete EDTA-free protease inhibitor cocktail) and protein quantified using the DC assay (Biorad). 1 mg of total proteome was incubated with 4 μg of anti-PGRMC2, anti-PGRMC1, or rabbit IgG control antibody pre-bound to 0.75 mg of Dynabeads Protein G (Thermo Fisher). After overnight incubation at 4°C, beads-antibody-protein complexes were washed three times with PBS-0.02% Tween 20 for 5 min at RT, eluted in 50 mM glycine buffer pH = 2.8 for 10 min at 60°C and separated by SDS-PAGE for immunodetection.
Western blot analysis.
Samples separated by SDS-PAGE were transferred onto nitrocellulose membranes. Membranes were incubated in blocking buffer (TBS-Tween 0.1%, BSA 5% w/v) for 1 hr at room temperature. Membranes were incubated overnight at 4°C with primary antibodies diluted in blocking buffer, washed three times for 15 min with TBS-Tween 0.1%, and incubated for 1 hr at room temperature with HRP-conjugated secondary antibodies diluted in blocking buffer (1:20,000 dilution). The antibodies and dilutions used in this work were: PGRMC2 (1:1,000, Bethyl Laboratories, A302-954A and A302-955A), PGRMC1 (1:1,000, Bethyl Laboratories, A304-561A), PPARγ, EV-ERBα (1:200, Santa Cruz Biotechnology, sc-7273 and sc-100910), BACH1 (1:500, R&D Systems, AF5777), UCP1 and OxPhoS (1:5,000 and 1:300, Thermo Fisher Scientific, PA124894 and 458099), GAPDH, TUBULIN, and HSP90 (1:5,000, GeneTex, GTX627408, GTX27291, and GTX101423), and CEBPδ (1:1,000, Abgent, AP20492c).
Primary adipocyte culture.
Primary brown adipocytes were isolated from the interscapular BAT depot of WT and PATKO newborn mice. BAT depots were minced and digested by shaking for 40 min at 37°C in isolation buffer containing 61.5 mM NaCl, 2.5 mM KCl, 0.65 mM CaCl2, 2.5 mM glucose, 50 mM HEPES, 50 U/ml, 50 μg/mL Pen/Strep, BSA 2% (w/v), and 1.5 mg/mL Collagenase type I (Worthington). Cells were filtered through a 70 μm strainer and plated in DMEM with 25 mM glucose, 20 mM HEPES, 20% FBS and Pen/Strep. Differentiation was induced when cells reached confluence by switching the media to DMEM, 10% FBS, 20 nM insulin, 1 nM triiodothyronine (T3), 0.5 mM 3-Isobutyl-1-methylxanthine (IBMX), and 2 μg/mL dexamethasone (Dex). Two days later, media was replaced with DMEM, 10% FBS, 20 nM insulin, and 1 nM T3. On day 4 of differentiation, cells were treated with 0.5 mM succinylacetone, or switched to heme-depleted FBS, for bioenergetics and gene/protein expression studies and analyzed at day 7. Exogenous hemin at a final concentration of 20 μM was added 48 hr before bioenergetics studies were performed. On day 7 of differentiation, adipocytes were treated with vehicle or 100 nM NE for 2 hr for gene expression studies. For complementation experiments, cells were infected with lentiviruses expressing mCherry, WT human PGRMC2, a human PGRMC2 heme-binding mutant (3xM; Y137F, K193A, and Y194F) at day 0 of differentiation in the presence of 5 μg/mL polybrene. Rev-Erbα and BACH1 knockdown in mature adipocytes was performed as previously described35.
Mitochondrial bioenergetics measurements.
The oxygen consumption rate of adipocytes was measured on a Seahorse XFe96 instrument. Primary brown adipocytes differentiated in vitro were re-plated at day 5 of differentiation on gelatin coated XFe96 plates at a density of 8,000 cells per well. Two days after plating, cells were equilibrated in serum-free DMEM (Sigma-Aldrich D5030) containing 25 mM glucose, 10 mM sodium pyruvate, 2 mM glutamine, and 5 mM HEPES pH 7.4 for 1 hr before a mitochondrial stress test was performed at day 7 consisting of 3 min cycles of mixing and 2 min cycles of measurements. Basal respiration rates were measured, followed by sequential injections of oligomycin (2 μM), FCCP (1 μM), and rotenone (2 μM) plus antimycin A (RAA, 2 μM). To measure the acute response to adrenergic signaling stimulators, compounds were injected using one of the ports after measurements of basal respiratory rates were complete. Freshly isolated BAT mitochondria (4 μg per well) were transferred onto XFe96 plates containing Isolation Buffer 2 (IB2 = 220 mM mannitol, 70 mM sucrose, 10 mM KH2PO4, 5 mM MgCl2, 1 mM EGTA, 0.5 mM ADP, 2 μM rotenone, 10 mM succinate, 0.2% BSA, and 2 mM HEPES pH 7.4), and plates centrifugated at 2,000 x g for 20 min at 4°C. Oxygen consumption rate was measured after sequential injections at final concentrations of 4 μM oligomycin, 4 μM FCCP, and 4 μM antimycin A. Each cycle consisted of 30 sec of mixing followed by 2.5 min of measurements.
Quantitative PCR and RNAseq.
Total RNA was isolated from cells and tissues using the Direct-zol RNA MiniPrep Plus kit (Zymo Research). Taqman-based quantitative real-time PCR was performed using the SuperScript III Platinum One-Step qRT-PCR reagent (Thermo Fisher Scientific). Samples were run in triplicate as multiplexed reactions normalized to an internal control (36B4; acidic ribosomal phosphoprotein P0 mRNA). Sequences of primers and probes used are included in Supplementary Information. For RNAseq, total RNA was extracted from BAT of WT and PATKO mice at 30°C using the Direct-Zol RNA extraction kit (Zymo Research). PolyA+ RNA was fragmented and prepared into strand-specific libraries using the Illumina True-seq stranded RNA kit (Illumina) and analyzed on an Illumina HiSeq 2500 sequencer. Libraries were sequenced using single-end 50 bp reads at a depth of 10-15 million reads per library. Single-end sequencing reads were mapped to the mouse reference genome (mm9, NCBI37) using STAR (version 2.3.0.c, default parameters). Only reads that aligned uniquely to a single genomic location were used for downstream analysis (MAPQ > 10). Gene expression values were calculated for read counts on exons of annotated RefSeq genes using HOMER. Differentially expressed genes were calculated with four replicates per condition using EdgeR, and a threshold of adjusted p value < 0.05 was used to call differentially expressed genes. Differentially expressed genes were used for pathway and Gene ontology functional enrichment analysis using Ingenuity Pathway Analysis (QIAGEN) and Metascape36 (http://metascape.org). Heatmaps were generated using RStudio software (package ‘gplots’). Pie charts and Circos plots were generated with Metascape and Adobe Illustrator. Data are available in GEO (GSE124621). Cell type-specific regulatory elements were download from the ENCODE SCREEN portal, using biosample “C57BL/6 brown adipose tissue male adult 24 weeks”. BAT-specific enhancers as annotated by ENCODE (typically high DNAse and H3K27ac signal but no H3K4me3 signal) were lifted over to mm9 using UCSC LiftOver and associated to genes by proximity (20 kb from TSS). Homer 4.9.1 was used to find enriched known and de novo motifs in enhancers associated to genes of interest.
Mouse studies.
All procedures were approved by the Institutional Animal Care and Use Committee of The Scripps Research Institute and conducted in accordance with relevant ethical regulations. To generate mice with adipose-specific deletion of Pgrmc2, mice with floxed Pgrmc2 alleles37 and backcrossed to the C57BL/6J background (NNT mutant) were crossed with an Adipoq-CRE strain38 (JAX stock 010803). Similarly, mice with dual deletion of Pgrmc139 and Pgrmc2 in adipose tissue were generated by crossing mice with floxed Pgrmc1 and Pgrmc2 alleles to the Adipoq-CRE strain. Floxed littermates without the CRE transgene were used as controls and are referred to as WT. Mice were born at room temperature and moved to 30°C two weeks after weaning. Experiments were performed after a minimum of 4 weeks of acclimatization to 30°C. Mice were kept on a 12-hr light-dark cycle and fed standard chow breeder diet (5058, Picolab) or 60% high-fat diet (D12492, Research Diets) as specified. Male and female mice were used in separate gender-matched experiments. No gender-specific differences were observed. For molecular characterization, mice were euthanized at or around ZT5, extensively perfused with ice-cold PBS, and tissues harvested and immediately frozen in liquid nitrogen. For circadian time course analysis, WT and PATKO mice (n = 3 per group, per time point) were euthanized every 4 hr over a period of 24 hr and tissues harvested as described above.
Energy balance studies.
Energy balance parameters were determined in a computer-controlled open-circuit system (Oxymax) that is part of an integrated Comprehensive Lab Animal Monitoring System (Columbus Instruments), as previously described40. Body temperature was monitored using a rectal probe (RET-3 probe, TH-5 Thermalert Monitoring Thermometer, Physitem) in cold exposure experiments, and by radiotelemetry in all other experiments. Radiotelemetry was enabled by surgically implanting a transmitter (TA10TA-F10; Data Sciences, Inc.) into the peritoneal cavity, as described41. Male mice (20 weeks old) were allowed to recover for 14 d post-surgery and were then acclimated for 3 d to the experimental environment before measurements were taken. Data were recorded by placing a cage containing a mouse implanted with a transmitter on a receiver plate (RPC-1; DataScience). Data collection and offline analysis were performed using the DATAQUEST A.R.T. software (DataScience). To test the response to the β3-adrenergic receptor agonist CL316,243 (1 mg/kg) or an equivalent volume of PBS, was administered via intraperitoneal injection to 20-week-old male mice housed at thermoneutrality at ZT4.5. Oxygen consumption rate and activity levels were monitored using the CLAMS system.
Exposure to cold.
Experiments were performed on male and female mice 12-14 weeks of age. Mice were individually caged with minimal bedding and free access to food and water. To start the cold challenge, they were transferred to 4°C, with controls remaining at 30°C, and body temperature was monitored every 30 min for a total of 2.5 hr. In that amount of time, all PATKO mice became severely hypothermic and all cold-exposed mice were euthanized. Cold challenge experiments started at or around ZT5 (11 am).
Labile heme quantification.
To purify nuclear and mitochondrial fractions from BAT and liver, one lobe of BAT or 100 mg of liver were dounce-homogenized in Isolation Buffer 1 (IB1 = 220 mM mannitol, 70 mM sucrose, 5 mM EGTA, and 50 mM MOPS pH 7.4). After centrifugation at 1,000 x g for 10 min at 4°C, the nuclear pellet was passed through a 100 μm strainer and washed 5 times in IB1. Mitochondria in the supernatant were isolated from the cytosolic fraction after a second centrifugation at 9,500 x g for 10 min at 4°C and washed twice with IB1. The nuclear and mitochondrial pellets were resuspended in 50 μL dH2O, sonicated, and protein content quantified using the DC assay (Bio-Rad). 5 μL of 25 nM apoHRP was incubated in 384-well format with 10 μg in 5 L of purified mitochondrial or nuclear protein lysates. After 5 min at room temperature, 40 μL of heme assay buffer (50 μM Amplex UltraRed, 0.02% H2O2 in 0.1 M NaH2PO4/Na2HPO4 buffer, pH 6) was added and fluorescence (ex.-em. 490/585) measured immediately for 15 min.
Iron quantification.
Frozen tissue (BAT ~50 mg) was pulverized and lysed in 50 mM NaOH. Non-heme iron content was quantified using 200 μg of protein lysate and the ferrozine method as previously described42.
Blood chemistry measurements.
Blood samples were collected either from the retro-orbital plexus of anesthetized mice, or by cardiac puncture after euthanasia. Plasma was separated using BD Microtrainer PST tubes with lithium heparin. Triglycerides and non-esterified free fatty acids were measured using the Serum Triglyceride Determination Kit (Sigma) and the HR Series NEFA-HR(2) kit (Wako). Norepinephrine levels were quantified using an ELISA kit (Abnova Corp). Insulin levels were determined using an Ultra-Sensitive Rat ELISA Kit (Crystal Chem).
Tissue lipid content.
Frozen tissue (liver ~30 mg) was pulverized and lysed in RIPA buffer. Triglycerides (TG) were quantified in 10 μL of tissue lysate using the EnzyChrome Triglyceride Assay kit (EGTA-200, Bioassay Systems). TG content was normalized to tissue weight.
Treatment with CPAG-1.
C57BL/6J male mice fed a 60 kcal% fat diet (D12492, Research Diets) were purchased from The Jackson Laboratory (DIO, JAX stock 380050) and kept in the same diet throughout the studies. DIO mice (> 12 weeks of high-fat diet, 20 weeks of age), randomized based on weight and fasting glycemia, were dosed intraperitoneally with CPAG-1 every other day (45 mg/kg in a 2:3:1:4 DMSO:PEG40:ethanol:PBS vehicle solution). Weight and fasted glucose levels were monitored weekly. Mice were fasted for 16 hr prior to analysis of basal blood chemistry parameters. At the conclusion of treatment, tissues were harvested and snap frozen for RNA extraction and Western blot analysis or fixed for histological examination.
Glucose and insulin tolerance tests.
For glucose tolerance tests, mice were fasted for 6 hr, and blood was collected from the tail vein before and at timed intervals after oral gavage of glucose (1 g/kg). Plasma glucose was measured with a One-touch Ultra glucometer (Johnson & Johnson). For insulin tolerance tests, mice fasted for 4 hr were injected intraperitoneally with insulin (1 U/kg; Novolin, Novo Nordisk). Glucose levels were determined before and at timed intervals after injection of insulin.
Histology.
Liver, and brown (BAT) and white (WAT) adipose tissue were fixed in Z-Fix (Anatech), dehydrated, embedded in paraffin, and 3 μm (liver, BAT) or 10 μm (WAT) thick sections stained with hematoxylin and eosin. Cell size was analyzed using ImageJ software.
Electron microscopy.
BAT depots were harvested and immediately placed in fixative buffer (2.5% paraformaldehyde, 3% glutaraldehyde, 0.02% picric acid in cacodylate buffer, pH 7.3) and stored at 4°C for 72 hr. Fixative buffer was refreshed after 48 hr. Tissues were extensively washed in 0.1 M sodium cacodylate buffer (pH 7.3) prior post-fix incubation in 2% OsO4 in 0.1 M sodium cacodylate buffer for 4 hr (buffer was refreshed after 2 hr). Tissues were then washed in 0.1 M sodium cacodylate buffer (pH 7.3) followed by water. Tissues were dehydrated in a graded ethanol series and infiltrated and embedded in Spurr resin (Sigma-Aldrich). Thin sections were post stained with 2% uranyl acetate followed by lead citrate and examined in a FEI Philips CM100 electron microscope at 80KV. Images were taken using Radius 1.3 software with a Megaview G2 CCD Camera (EMSIS GmbH).
Statistics.
Results from in vitro assays and cell culture data are presented as mean ± s.d. Data generated in mouse studies are presented as mean ± s.e.m. The number of mice used in each experiment is indicated in the figure legends. Statistical analysis was performed on Prism software (GraphPad) using Student’s t-test for comparisons between two groups, one-way ANOVA with multiple comparisons for assessment of more than two groups, and two-way ANOVA with multiple comparisons for repeated measurements. Comparisons among specific groups were done using post-tests as indicated in the figure legends.
Reporting summary.
Further information on experimental design is available in the Nature Research Reporting Summary linked to this paper.
Extended Data
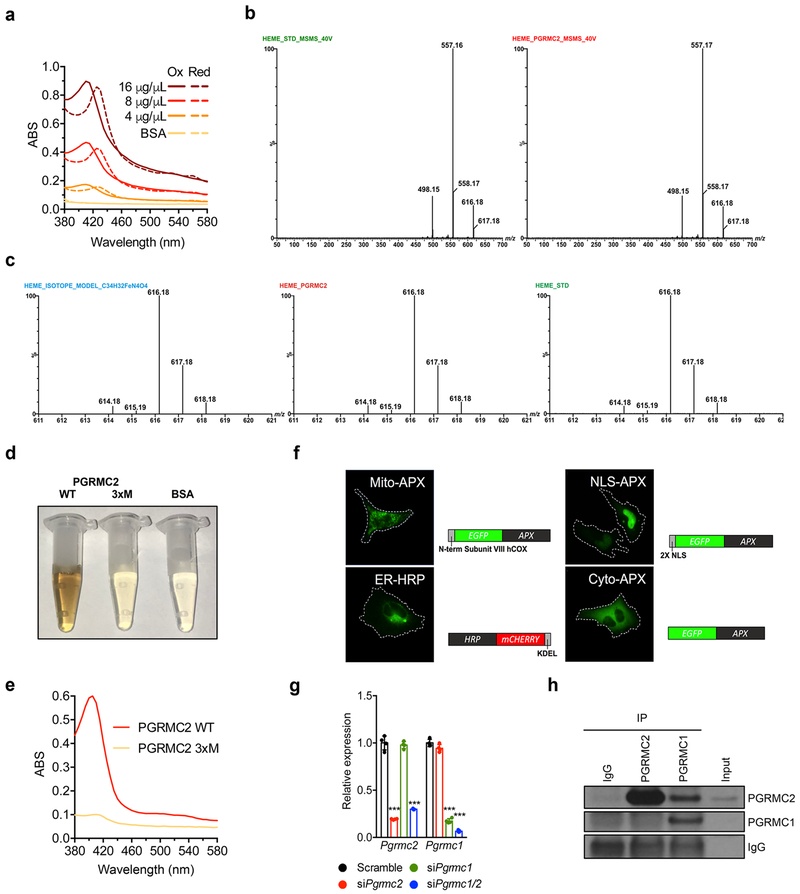
Extended Data Fig. 1 |. PGRMC2 binds heme and coordinates with PGRMC1 its intracellular distribution.
a, Absorbance spectra of mouse PGRMC2 protein shows peaks of heme-protein complexes in the 390-450 nm range. Dotted spectra indicate heme-protein complexes after 10 mM dithionite reduction of the iron moiety. b, LC-MS/MS spectra of hemin standard (left) and PGRMC2 protein (right) at CE = 40V. c, Isotope envelope of hemin calculated based on isotope natural abundance for C34H32FeN4O4 (-Cl ion) (left), PGRMC2 protein (center), and hemin standard (right). d, Purified mouse PGRMC2 3xM mutant (Y131F, K187A, Y188F) does not bind heme. e, The Soret peak typical of hemoproteins is absent in PGRMC2 3xM. f, Representative fluorescence imaging of cells expressing targeted HRP/APX labile heme reporters showing their localization to mitochondria, ER, nucleus, and cytosol. g, Levels of Pgrmc2 and Pgrmc1 mRNA in siRNA-transfected HEK293T cells (n = 3 biologically independent samples). h, Interaction of PGRMC1 with PGRMC2 is not observed when PGRMC2 is immunoprecipitated using an antibody that recognizes the heme-binding domain at the C-terminus of PGRMC2. Representative results from two (a-e, h) or three (f, g) independent experiments. Data presented as mean ± s.d, ***p<0.001 vs. Scramble-Basal, determined by two-way ANOVA with multiple comparisons and a Tukey’s post-test.
Extended Data Fig. 2 |. Pgrmc2 is enriched in adipose tissue and regulates BAT function.
a, PGRMC2 protein levels increase during adipocyte differentiation. 3T3-L1 preadipocytes were induced to differentiate and protein extracts prepared at the indicated time points. PPARγ and CEBPδ are markers of mature adipocytes and preadipocytes, respectively. Representative results from three independent experiments. b, Profile of Pgrmc2 mRNA expression across mouse tissues (n = 5 biologically independent samples). c, Whole-body and inguinal subcutaneous fat weight of chow-fed WT and PATKO mice housed at 30°C (WT, n = 8; PATKO, n = 9). d, Oxygen consumption rate (OCR), core body temperature, CO2 production rate, Respiratory Exchange Ratio (RER), and activity oscillations of PATKO mice housed at 30°C (WT, n = 5; PATKO, n = 6). e, Levels of plasma norepinephrine, glucose, and non-esterified fatty acids (NEFA) in WT and PATKO mice upon cold challenge (WT n = 5; PATKO n = 7). f, Increased oxygen consumption upon acute injection of the β3-agonist CL316,243 (1 mg/kg) is reduced in PATKO mice housed at 30°C, despite comparable motor activity (n = 5 biologically independent samples). g, Adipose-specific PGRMC1/2 double knockout mice (DKO) housed at 30°C are cold intolerant (WT n = 13; DKO n = 8 biologically independent samples). Survival curves of WT and PGRMC1/2 DKO mice exposed to 4°C (homeothermia = 31°C). Mice were exposed to 4°C at 11 am (ZT5). Data presented as mean ± s.e.m. *p<0.05, ***p<0.001 vs. WT analyzed by two-tailed Student’s t-test (e, f) or two-way ANOVA with multiple comparisons and a Tukey’s post-test (g).
Extended Data Fig. 3 |. Impact of Pgrmc2 deletion in BAT.
Brown adipose tissue from chow-fed WT and mutant mice housed at 30°C was analyzed. a, Levels of succinyl-CoA, glycine, and aminolevulinic acid (ALA) in BAT quantified using targeted metabolomics (n = 5 biologically independent samples per group). b, PATKO mice show reduced expression of Alas1 and Alas2 in BAT (n = 3 biologically independent samples per group). c, Nuclear labile heme is significantly lower in BAT of fat-specific PGRMC1/2 DKO mice housed at 30°C (n = 4 biologically independent samples per group). Similar to what is seen in PATKO mice, BAT of PGRMC1/2 DKO mice is discolored. Representative results from two independent experiments. d, Expression of REV-ERBα (Bmal1) and BACH1 (Fth1) targets in BAT of PATKO mice housed at 30°C (WT n = 5; PATKO n = 6). e, Circadian oscillation of clock components is not altered in PATKO BAT (n = 3 biologically independent samples per group per time point). f, GO category analysis (biological process) of significantly downregulated genes in RNAseq analysis of BAT from WT and PATKO mice housed at 30°C (n = 4 biologically independent samples per group). p values determined by standard accumulative hypergeometric statistical test. g, Circos plot of heme-related differentially-regulated genes (DEGs) showing that the majority (28/45) of them belong to the top 3 downregulated biological processes. Number in parenthesis below each biological process represents the total number of DEGs in PATKO BAT in that category. Blue lines refer to downregulated DEGs and red lines to upregulated DEGs. Data presented as mean ± s.e.m. *p<0.05, **p<0.01, ***p<0.001 vs. WT determined by two-tailed Student’s t-test.
Extended Data Fig. 4 |. Primary brown adipocytes recapitulate the mitochondrial defects of PATKO BAT.
a, WT and PGRMC2-null primary brown adipocytes differentiated in vitro imaged on day 8. Lipid stained with Nile red (red) and nuclei with Hoechst (blue). Scale bar is 100 μm. b, Protein levels of adipocyte markers during the course of differentiation. c, PGRMC2-null brown adipocytes have impaired mitochondrial respiration (n = 3). d-h, Lack of PGRMC2 in brown adipocytes results in a defective mitochondrial response to endogenous (d), synthetic panβ- (e) and β3-adrenergic (f) agonists, and to downstream activators of adrenergic signaling (g, h) (n = 5). i, Induction of norepinephrine-responsive genes is similar in WT and PGRMC2-null brown adipocytes (n = 3) exposed to 100 nM norepinephrine (NE) for 2 hr. j, OXPHOS proteins and UCP1 are reduced in primary brown PATKO adipocytes. k, PGRMC1/2 DKO primary brown adipocytes differentiated in vitro show severe mitochondrial dysfunction, an inability to increase oxygen consumption upon NE exposure (n = 3), and reduced UCP1 and OXPHOS proteins. l-m, Overexpression of human WT PGRMC2, but not of a heme-binding mutant (3xM Y137F, K193A, and Y194F), can rescue mitochondrial function and the response to NE in PATKO adipocytes (l, n = 4; m, WT-mCherry, WT-WT, PATKO-WT n = 8; WT-3xM, PATKO-3xM n = 7; PATKO-mCherry n = 6). n, Ucp1 mRNA expression is restored when human WT PGRMC2, but not the heme-binding mutant 3xM, is expressed in PATKO cells (n = 3). o, Levels of mouse and human Pgrmc2 mRNA in primary adipocytes used in panels l-n (n = 3). a-o, Biologically independent samples. Representative results from two (j-o) or three (a-i) independent experiments. Data presented as mean ± s.d. *p<0.05, **p<0.01, ***p<0.001 vs. WT; ###p<0.001 vs. Veh determined by two-way ANOVA with multiple comparisons and a Bonferroni’s post-test.
Extended Data Fig. 5 |. PGRMC2-mediated transport of endogenous labile heme regulates mitochondrial function in primary brown adipocytes.
a-b, Inhibition for 48 hr of endogenous heme synthesis with 0.5 mM succinylacetone (FBS +SA), but not exogenous heme depletion (Heme-depleted FBS), in WT primary brown adipocytes phenocopies the mitochondrial defects of PATKO cells (a, n = 8; b, n = 4). c-d, Treatment with SA (0.5 mM) dramatically reduces Ucp1 mRNA and protein levels (n = 3). e, Exogenous hemin (20 μM) does not correct mitochondrial dysfunction in PATKO cells (n = 3). f, PATKO brown adipocytes show higher levels of Rev-Erbα and BACH1 protein. g, Dual knockdown of Rev-Erbα and BACH1 in mature PATKO adipocytes restores mitochondrial respiration (n = 5). h, Pgrmc2, Rev-Erbα, and Bach1 mRNA in control and knockdown cells. a-h, Biologically independent samples. Representative results from two independent experiments. Data presented as mean ± s.d. **p<0.01, ***p<0.001 vs. WT; ###p<0.001 vs. Scramble determined by two-way ANOVA with multiple comparisons and a Bonferroni’s post-test.
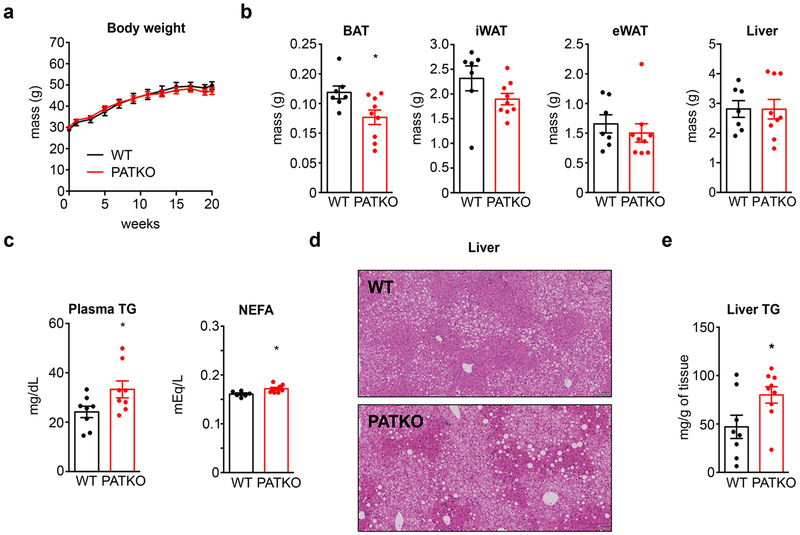
Extended Data Fig. 6 |. Body composition of PATKO mice fed a high-fat diet.
WT and PATKO mice were fed HFD for 20 weeks. a, Body weight progression (WT n = 7; PATKO n = 9). b, BAT of PATKO mice fed HFD is smaller compared to BAT of HFD-fed WT mice. No difference was seen in iWAT, eWAT, or liver weight (WT n = 7; PATKO n = 9). c, PATKO mice fed HFD had higher levels of plasma triglycerides and non-esterified fatty acids (NEFA) (WT n = 7; PATKO n = 8). d, H&E stain images of liver show increased steatosis in PATKO mice. Scale bar is 100 μm. Representative images of 7 biologically independent samples. e, PATKO mice fed HFD had more lipid accumulation in liver. (n = 8). a-e, Biologically independent samples. Data presented as mean ± s.e.m. *p<0.05 vs. WT determined by two-tailed Student’s t-test.
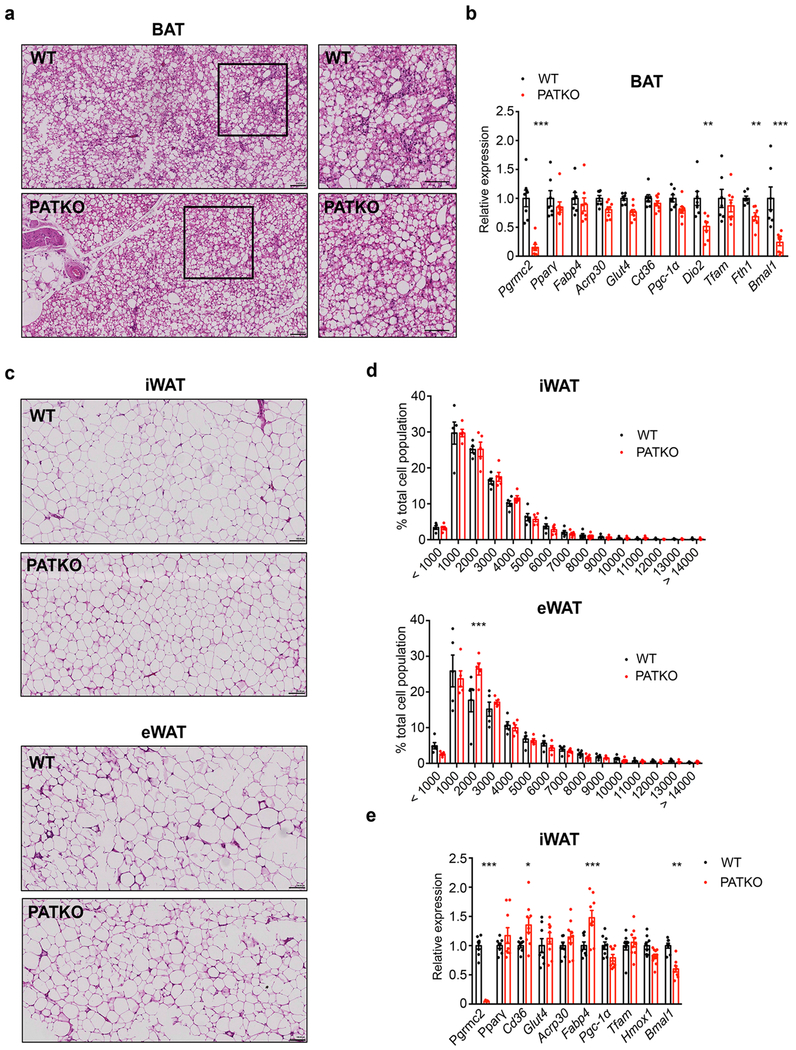
Extended Data Fig. 7 |. Analysis of adipose depots of PATKO mice fed a high-fat diet.
WT and PATKO mice were fed HFD for 20 weeks. a, H&E stain images of BAT from WT and PATKO mice fed HFD show similar morphology. Insets are magnified on the right. Scale bar is 100 μm. Representative images of 7 biologically independent samples. b, Gene expression analysis in BAT shows reduced levels of Fth1 and Bmal1, targets of BACH1 and Rev-Erbα respectively, in PATKO BAT (WT n = 7; PATKO n = 8). c, H&E stain images of iWAT and eWAT from WT and PATKO mice fed HFD do not show clear differences. Scale bar is 100 μm. Representative images of 7 biologically independent samples. d, Size analysis of iWAT and eWAT adipocytes from HFD-fed WT and PATKO mice. X axis indicates μm2 (n = 5 images of biologically independent samples). e, Gene expression analysis in iWAT reveals a modest increase in expression of genes involved in lipid handling. Similar to BAT, Bmal1 expression is significantly reduced in iWAT of PATKO mice (WT n = 7; PATKO n = 9). a-e, Biologically independent samples. Data presented as mean ± s.e.m. *p<0.05, **p<0.01, ***p<0.001 vs. WT determined by two-way ANOVA with multiple comparisons and a Bonferroni’s post-test.
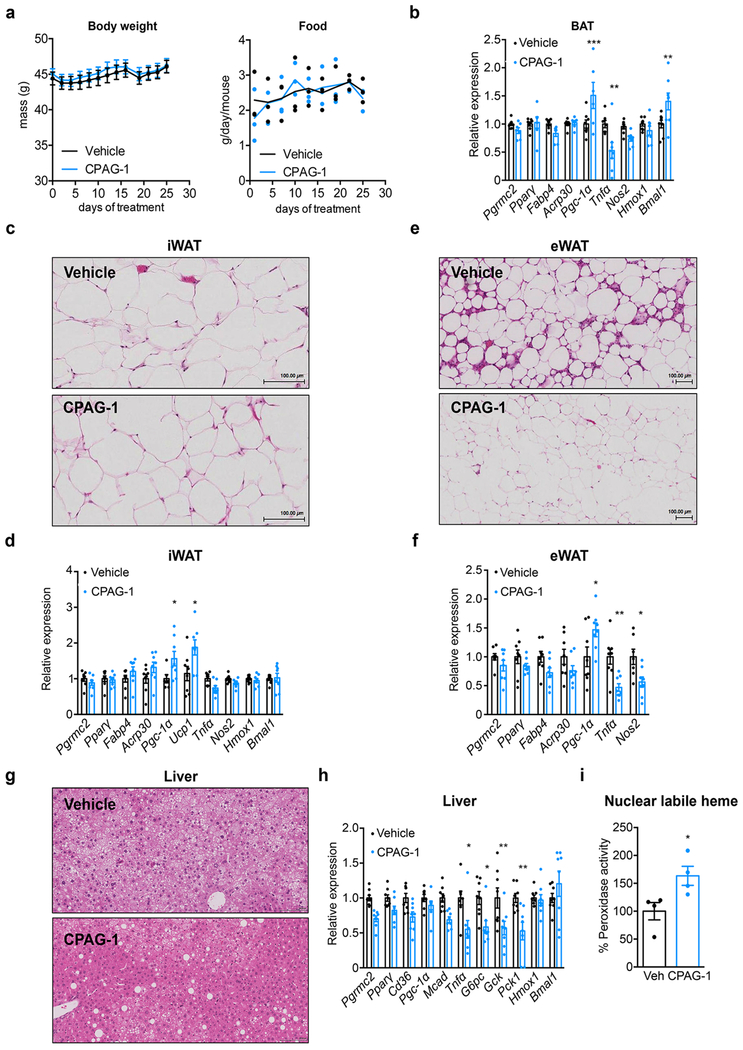
Extended Data Fig. 8 |. Impact of pharmacological activation of PGRMC2 in DIO mice.
DIO mice were treated with CPAG-1 for 30 days. a, Body weight (left) and food intake (right) progression (n = 8). b, Expression of Pgc-1α and Bmal1 is increased in BAT of treated DIO mice (n = 8). c, H&E stain images of iWAT show no difference between Vehicle- and CPAG-1-treated DIO mice. Scale bar is 100 μm. d, Gene expression analysis reveals increased expression of Pgc-1α and Ucp1 in iWAT of CPAG-1-treated DIO mice (n = 8). e, H&E stain images show reduced fibrosis and immune cell infiltration in eWAT of DIO mice treated with CPAG-1. Scale bar is 100 μm. f, Gene expression analysis shows decreased expression of markers of inflammation in eWAT of treated mice (n = 8). g, H&E stain images of liver show CPAG-1 treatment modestly reduces lipid deposition. Scale bar is 100 μm. h, Hepatic gene expression analysis shows decreased levels of gluconeogenic genes and inflammation markers in liver of treated mice (n = 8). i, Treatment with CPAG-1 for 4 days significantly increases nuclear labile heme levels in the liver of DIO mice (n = 4). a-i, Biologically independent samples. d, e and g, Representative images of 8 biologically independent samples per group. Data presented as mean ± s.e.m. *p<0.05, **p<0.01, ***p<0.001 vs. Veh determined by two-way ANOVA with multiple comparisons and a Bonferroni’s post-test.
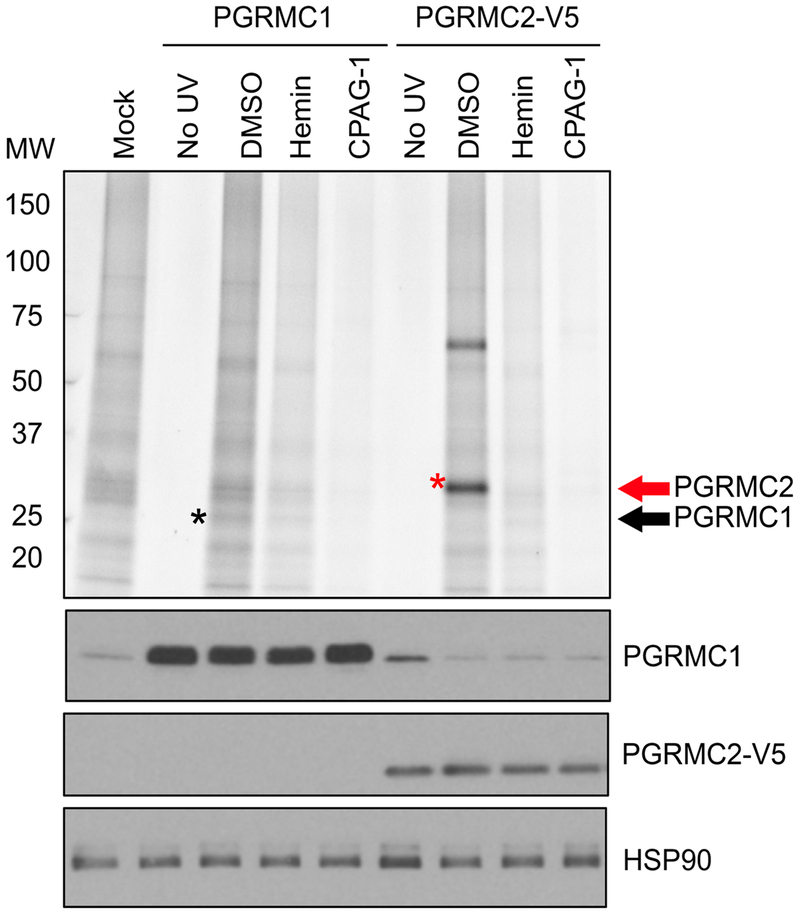
Extended Data Fig. 9 |. Evaluation of interaction of CPAG-1 with PGRMC1 and PGRMC2 in live cells.
a, HEK293T cells transfected with expression vectors for either PGRMC1 or PGRMC2 were treated with 10 μM probe 25 (the photoreactive form of CPAG-1) and DMSO, 100 μM hemin, or 100 μM CPAG-1 for 30 min followed by UV-photocrosslinking, lysis, and conjugation of labeled proteomes to a TAMRA-azide tag. Labeled proteomes were separated by SDS-PAGE and visualized by in-gel fluorescence scanning. The intensity of the signals indicates the affinity of probe 25 for the overexpressed proteins. The black asterisk marks PGRMC1 protein and the red one PGRMC2 protein. Though detectable, PGRMC1 shows very poor labeling with probe 25 relative to PGRMC2. Both interactions can be competed by hemin or CPAG-1. Western blot analysis confirms expression of PGRMC1 and PGRMC2 in transfected cells. Representative results from two independent experiments.
Extended Data Fig. 10 |. PGRMC2 is an intracellular heme chaperone critical for adipocyte function.
Model of the proposed role for PGRMC2 in heme dynamics in brown adipocytes. PGRMC2 acquires heme from PGRMC1, which forms a complex with FECH, the last enzyme in heme synthesis. PGRMC2, located in the ER and the nuclear envelope, facilitates delivery of labile heme to the nucleus. Nuclear labile heme alters expression of genes regulated by heme-responsive transcriptional repressors, such as REV-ERBα and BACH1, that impact mitochondrial bioenergetics. Also shown are FVLCR1b, a mitochondrial heme exporter identified in erythrocytes, and HRG-1, a plasma-membrane heme importer characterized in macrophages. FVLCR1b and HRG-1 are both expressed in brown adipocytes, but their role in heme dynamics in this cell type remains to be defined.
Supplementary Material
Acknowledgements.
We thank Iqbal Hamza for labile heme reporter plasmids, Anastasia Kralli, Alan Saghatelian, Peter Tontonoz, R. Luke Wiseman, Larry Gerace, Jonathan Z. Long, and John Hogenesch for critical input, Malcom R. Wood and Theresa Fassel (Core Microscopy Facility at Scripps Research) for assistance with electron microscopy, and Nasun Hah (Next Generation Sequencing Core, The Salk Institute) for aid with RNAseq studies. R.S. thanks the UCLA QCBio Collaboratory community directed by Matteo Pellegrini. This work was funded by NIH grants DK099810 and DK114785 (ES and BFC), DK121196 and S10OD016357 (ES), and OD016564 (JKP and JJP). BPK and VA were supported by fellowships 15POST25100007 and 17POST33660833 from the American Heart Association.
Footnotes
Competing interests. The authors declare no competing interests
Data availability. Source data tables are provided for Figs. 1–4 and Extended Data Figs. 1–8. Full scans of all western blots are shown in Supplementary Information. RNAseq data are available in GEO under accession number GSE124621. All other data supporting the findings in this study are available from the corresponding author upon request.
References
- 1.Severance S & Hamza I Trafficking of heme and porphyrins in metazoa. Chem Rev 109, 4596–4616, (2009). [DOI] [PMC free article] [PubMed] [Google Scholar]
- 2.Mense SM & Zhang L Heme: a versatile signaling molecule controlling the activities of diverse regulators ranging from transcription factors to MAP kinases. Cell Res 16, 681–692 (2006). [DOI] [PubMed] [Google Scholar]
- 3.Donegan RK, Moore CM, Hanna DA & Reddi AR Handling heme: The mechanisms underlying the movement of heme within and between cells. Free Radic Biol Med 133, 88–100, (2019). [DOI] [PMC free article] [PubMed] [Google Scholar]
- 4.Reddi AR & Hamza I Heme Mobilization in Animals: A Metallolipid’s Journey. Acc Chem Res 49, 1104–1110 (2016). [DOI] [PMC free article] [PubMed] [Google Scholar]
- 5.Parker CG et al. Ligand and Target Discovery by Fragment-Based Screening in Human Cells. Cell 168, 527–541 (2017). [DOI] [PMC free article] [PubMed] [Google Scholar]
- 6.Gerdes D, Wehling M, Leube B & Falkenstein E Cloning and tissue expression of two putative steroid membrane receptors. Biol Chem 379, 907–911 (1998). [DOI] [PubMed] [Google Scholar]
- 7.Wendler A & Wehling M PGRMC2, a yet uncharacterized protein with potential as tumor suppressor, migration inhibitor, and regulator of cytochrome P450 enzyme activity. Steroids 78, 555–558 (2013). [DOI] [PubMed] [Google Scholar]
- 8.Juhlen R, Landgraf D, Huebner A & Koehler K Identification of a novel putative interaction partner of the nucleoporin ALADIN. Biol Open 5, 1697–1705, (2016). [DOI] [PMC free article] [PubMed] [Google Scholar]
- 9.Kimura I et al. Functions of MAPR (membrane-associated progesterone receptor) family members as heme/steroid-binding proteins. Curr Protein Pept Sci 13, 687–696 (2012). [DOI] [PubMed] [Google Scholar]
- 10.Chen JJ & London IM Hemin enhances the differentiation of mouse 3T3 cells to adipocytes. Cell 26, 117–122 (1981). [DOI] [PubMed] [Google Scholar]
- 11.Chawla A & Lazar MA Induction of Rev-ErbA, an orphan receptor encoded on the opposite strand of the alpha-thyroid hormone receptor gene, during adipocyte differentiation. J Biol Chem 268, 16265–16269 (1993). [PubMed] [Google Scholar]
- 12.Kojetin DJ & Burris TP A role for rev-erbalpha ligands in regulation of adipogenesis. Curr Pharm Des 17, 320–324 (2011). [DOI] [PubMed] [Google Scholar]
- 13.Wang J & Lazar MA Bifunctional role of Rev-erbA in adipocyte differentiation. Mol Cell Biol 28, 2213–2220 (2008). [DOI] [PMC free article] [PubMed] [Google Scholar]
- 14.Raghuram S et al. Identification of heme as the ligand for the orphan nuclear receptors REV-ERBalpha and REV-ERBbeta. Nat Struct Mol Biol 14, 1207–1213 (2007). [DOI] [PMC free article] [PubMed] [Google Scholar]
- 15.Yin L et al. Rev-ErbA, a heme sensor that coordinates metabolic and circadian pathways. Science 318, 1786–1789 (2007). [DOI] [PubMed] [Google Scholar]
- 16.Sweeny EA et al. Glyceraldehyde-3-phosphate dehydrogenase is a chaperone that allocates labile heme in cells. J Biol Chem 293, 14557–14568 (2018). [DOI] [PMC free article] [PubMed] [Google Scholar]
- 17.Yuan X et al. Regulation of intracellular heme trafficking revealed by subcellular reporters. Proc Natl Acad Sci U S A 113, E5144–5152 (2016). [DOI] [PMC free article] [PubMed] [Google Scholar]
- 18.Ebert PS, Hess RA, Frykholm BC & Tschudy DP Succinylacetone, a potent inhibitor of heme biosynthesis: effect on cell growth, heme content and delta-aminolevulinic acid dehydratase activity of malignant murine erythroleukemia cells. Biochemical and biophysical research communications 88, 1382–1390 (1979). [DOI] [PubMed] [Google Scholar]
- 19.Piel RB 3rd et al. A Novel Role for Progesterone Receptor Membrane Component 1 (PGRMC1): A Partner and Regulator of Ferrochelatase. Biochemistry 55, 5204–5217 (2016). [DOI] [PMC free article] [PubMed] [Google Scholar]
- 20.Peluso JJ, Griffin D, Liu X & Horne M Progesterone receptor membrane component-1 (PGRMC1) and PGRMC-2 interact to suppress entry into the cell cycle in spontaneously immortalized rat granulosa cells. Biol Reprod 91, 1–12 (2014). [DOI] [PMC free article] [PubMed] [Google Scholar]
- 21.Hung V et al. Proteomic mapping of cytosol-facing outer mitochondrial and ER membranes in living human cells by proximity biotinylation. Elife 6, e24463 (2017). [DOI] [PMC free article] [PubMed] [Google Scholar]
- 22.Medlock AE et al. Identification of the Mitochondrial Heme Metabolism Complex. PLoS One 10, e0135896 (2015). [DOI] [PMC free article] [PubMed] [Google Scholar]
- 23.Carter EL, Gupta N & Ragsdale SW High Affinity Heme Binding to a Heme Regulatory Motif on the Nuclear Receptor Rev-erbbeta Leads to Its Degradation and Indirectly Regulates Its Interaction with Nuclear Receptor Corepressor. J Biol Chem 291, 2196–2222 (2016). [DOI] [PMC free article] [PubMed] [Google Scholar]
- 24.Zenke-Kawasaki Y et al. Heme induces ubiquitination and degradation of the transcription factor Bach1. Mol Cell Biol 27, 6962–6971 (2007). [DOI] [PMC free article] [PubMed] [Google Scholar]
- 25.Everett LJ & Lazar MA Nuclear receptor Rev-erbalpha: up, down, and all around. Trends Endocrinol Metab 25, 586–592 (2014). [DOI] [PMC free article] [PubMed] [Google Scholar]
- 26.Gerhart-Hines Z et al. The nuclear receptor Rev-erbalpha controls circadian thermogenic plasticity. Nature 503, 410–413 (2013). [DOI] [PMC free article] [PubMed] [Google Scholar]
- 27.Kazak L et al. UCP1 deficiency causes brown fat respiratory chain depletion and sensitizes mitochondria to calcium overload-induced dysfunction. Proc Natl Acad Sci U S A 114, 7981–7986 (2017). [DOI] [PMC free article] [PubMed] [Google Scholar]
- 28.Moreno-Navarrete JM et al. Heme Biosynthetic Pathway is Functionally Linked to Adipogenesis via Mitochondrial Respiratory Activity. Obesity (Silver Spring) 25, 1723–1733 (2017). [DOI] [PubMed] [Google Scholar]
- 29.Kajimura S & Saito M A new era in brown adipose tissue biology: molecular control of brown fat development and energy homeostasis. Annu Rev Physiol 76, 225–249 (2014). [DOI] [PMC free article] [PubMed] [Google Scholar]
- 30.Breitkopf SB et al. A relative quantitative positive/negative ion switching method for untargeted lipidomics via high resolution LC-MS/MS from any biological source. Metabolomics 13, doi: 10.1007/s11306-016-1157-8 (2017). [DOI] [PMC free article] [PubMed] [Google Scholar]
- 31.Demoz A, Garras A, Asiedu DK, Netteland B & Berge RK Rapid method for the separation and detection of tissue short-chain coenzyme A esters by reversed-phase high-performance liquid chromatography. J Chromatogr B Biomed Appl 667, 148–152 (1995). [DOI] [PubMed] [Google Scholar]
- 32.Li Q, Zhang S, Berthiaume JM, Simons B & Zhang GF Novel approach in LC-MS/MS using MRM to generate a full profile of acyl-CoAs: discovery of acyl-dephospho-CoAs. J Lipid Res 55, 592–602 (2014). [DOI] [PMC free article] [PubMed] [Google Scholar]
- 33.Liu X et al. High-Resolution Metabolomics with Acyl-CoA Profiling Reveals Widespread Remodeling in Response to Diet. Mol Cell Proteomics 14, 1489–1500 (2015). [DOI] [PMC free article] [PubMed] [Google Scholar]
- 34.Neubauer S et al. LC-MS/MS-based analysis of coenzyme A and short-chain acyl-coenzyme A thioesters. Anal Bioanal Chem 407, 6681–6688 (2015). [DOI] [PubMed] [Google Scholar]
- 35.Isidor MS et al. An siRNA-based method for efficient silencing of gene expression in mature brown adipocytes. Adipocyte 5, 175–185 (2016). [DOI] [PMC free article] [PubMed] [Google Scholar]
- 36.Zhou Y et al. Metascape provides a biologist-oriented resource for the analysis of systems-level datasets. Nat Commun 10, 1523, doi: 10.1038/s41467-019-09234-6 (2019). [DOI] [PMC free article] [PubMed] [Google Scholar]
- 37.Clark NC et al. Conditional Ablation of Progesterone Receptor Membrane Component 2 Causes Female Premature Reproductive Senescence. Endocrinology 158, 640–651 (2017). [DOI] [PMC free article] [PubMed] [Google Scholar]
- 38.Eguchi J et al. Transcriptional control of adipose lipid handling by IRF4. Cell Metab 13, 249–259 (2011). [DOI] [PMC free article] [PubMed] [Google Scholar]
- 39.McCallum ML et al. Conditional Ablation of Progesterone Receptor Membrane Component 1 Results in Subfertility in the Female and Development of Endometrial Cysts. Endocrinology 157, 3309–3319 (2016). [DOI] [PMC free article] [PubMed] [Google Scholar]
- 40.Kok BP et al. Intestinal bitter taste receptor activation alters hormone secretion and imparts metabolic benefits. Mol Metab 16, 76–87 (2018). [DOI] [PMC free article] [PubMed] [Google Scholar]
- 41.Sanchez-Alavez M, Bortell N, Galmozzi A, Conti B & Marcondes MC Reactive oxygen species scavenger N-acetyl cysteine reduces methamphetamine-induced hyperthermia without affecting motor activity in mice. Temperature (Austin) 1, 227–241 (2014). [DOI] [PMC free article] [PubMed] [Google Scholar]
- 42.Riemer J, Hoepken HH, Czerwinska H, Robinson SR, Dringen R Colorimetric ferrozine-based assay for the quantitation of iron in cultured cells. Anal Biochem 331, 370–375 (2004). [DOI] [PubMed] [Google Scholar]
Associated Data
This section collects any data citations, data availability statements, or supplementary materials included in this article.


