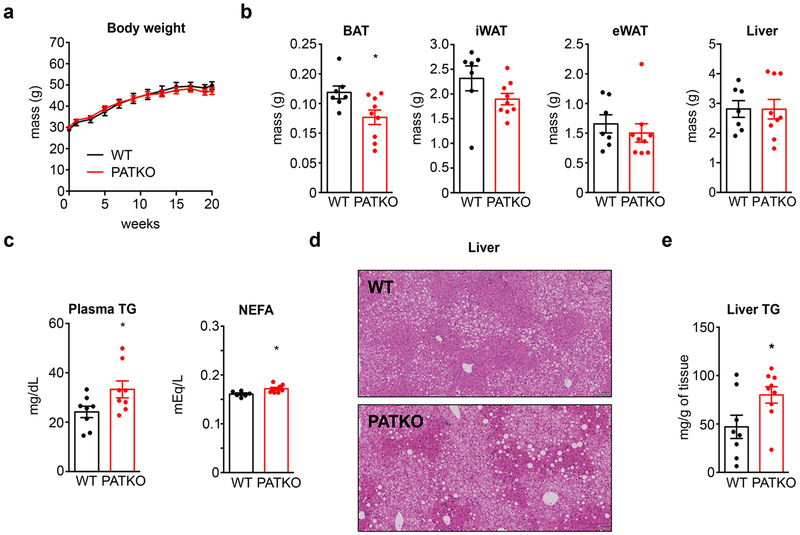
Extended Data Fig. 6 |. Body composition of PATKO mice fed a high-fat diet.
WT and PATKO mice were fed HFD for 20 weeks. a, Body weight progression (WT n = 7; PATKO n = 9). b, BAT of PATKO mice fed HFD is smaller compared to BAT of HFD-fed WT mice. No difference was seen in iWAT, eWAT, or liver weight (WT n = 7; PATKO n = 9). c, PATKO mice fed HFD had higher levels of plasma triglycerides and non-esterified fatty acids (NEFA) (WT n = 7; PATKO n = 8). d, H&E stain images of liver show increased steatosis in PATKO mice. Scale bar is 100 μm. Representative images of 7 biologically independent samples. e, PATKO mice fed HFD had more lipid accumulation in liver. (n = 8). a-e, Biologically independent samples. Data presented as mean ± s.e.m. *p<0.05 vs. WT determined by two-tailed Student’s t-test.

