

Abstract
Epidemiological studies in high-incidence areas of esophageal cancer in China suggest that environmental carcinogen N-nitrosomethylbenzylamine (NMBA) and riboflavin (RBF) deficiency may be the main risk factors for esophageal cancer. However, it is not clear that the combination induces cancer. Here, experiment (Exp) 1 evaluated the effects of NMBA and RBF deficiency individually or in combination on esophageal tumorigenesis. Male F344 rats were randomly assigned to 4 groups into a 2 (no NMBA vs. NMBA) × 2 (normal RBF vs. RBF-deficient) factorial design, including normal RBF (6 mg/kg, R6), RBF-deficient (0 mg/kg, R0), normal RBF combined with NMBA (R6N), and RBF-deficient combined with NMBA (R0N) groups. The Exp 2 explored the effects of RBF deficiency at different doses combined with NMBA (0.6 mg/kg, R0.6N; 0.06 mg/kg, R0.06N) on esophageal tumorigenesis. Results showed that R0N enhanced the incidence of esophageal intraepithelial neoplasia (EIN, 53.3%, P = 0.06), including carcinoma in situ, whereas R6N mainly induced the occurrence of esophageal benign hyperplasia (38.9%) and EIN (16.7%). RBF deficiency promotes EIN in a dose-dependent manner, and R0.06N significantly increases the incidence of EIN (57.9%, P < 0.05). Gene expression profiling demonstrated that inflammatory cytokines were highly expressed in R0N EIN tissues, whereas R6N EIN tissues had a proliferation and differentiation gene signature (fold-change > 1.5). Furthermore, RBF deficiency aggravated oxidative DNA damage (8-OHdG) and double-strand breaks (γH2AX) (P < 0.05). Our results suggest that RBF deficiency causes chronic inflammation-associated genomic instability contributes to NMBA-induced esophageal tumorigenesis.
Keywords: Esophageal cancer, rat model, esophageal intraepithelial neoplasia, inflammatory cytokines, 8-OHdG, γH2AX
Introduction
Esophageal cancer is the eighth most common and sixth most lethal cancer worldwide, having a 5-year survival rate between 15-25% [1]. Esophageal squamous cell carcinoma (ESCC) is the predominant histological subtype of esophageal cancer and accounts for approximately 90% of esophageal cancer cases [2,3]. Development and progression of ESCC involves multiple stages, individually known as low-grade intraepithelial neoplasia, high-grade intraepithelial neoplasia, subsequent invasive ESCC, and final metastasis [4]. Esophageal intraepithelial neoplasia is graded according to the proportion of epithelial dysplasia involved, with the lower third to two-thirds being referred to as low-grade intraepithelial neoplasia, and above two-thirds or carcinoma in situ being referred to as high-grade intraepithelial neoplasia [5-7]. At the initial stage, squamous epithelial cells exhibit nuclear atypia and abnormal maturation. This stage is known as dysplasia, and is believed to precede ESCC [6]. From a genomic perspective, little is known about the evolution from dysplasia to ESCC, especially how and at which stage the key carcinogenic events are acquired.
Epidemiological and etiological studies have shown that ESCC has a striking geographic distribution worldwide, suggesting that environmental factors play crucial roles in esophageal carcinogenesis [8]. The major risk factors for ESCC are chronic alcohol consumption, tobacco use, nutritional deficiency, and exposure to environmental carcinogens, such as N-nitrosomethylbenzylamine (NMBA) [9,10]. NMBA has been widely used to induce esophageal tumors in rodents [11-13]. A typical esophageal tumorigenesis chemoprevention study showed that weekly administration of low doses of NMBA for 15 weeks (cumulative dose = 7.5 mg/kg) produces a 100% incidence of squamous papilloma, but without ESCC development [14]. Combination with other risk factors, such as nutritional deficiency (zinc deficiency, vitamin E deficiency), alcohol, and arecoline, can greatly increase the incidence of ESCC [12,15-17]. Multiple risk factors are involved in the development of ESCC.
Riboflavin (RBF) is the precursor of the coenzymes flavin mononucleotide and flavin adenine dinucleotide, which participate in a wide range of biological oxidation-reduction reaction. RBF deficiency may result in disease, such as cancer [18]. The blood concentration of RBF in Kazak ESCC patients is lower than that in healthy controls [19]. Our early studies demonstrated that plasma RBF levels of ESCC patients are significantly lower than that of healthy controls in the Chaoshan area of Guangdong Province [20]. Moreover, we observed that enhanced subcutaneous tumorigenicity in NU/NU mice following injection of RBF-depleted HEK293T cells [21].
In this study, we established a rat models to evaluate the effects of NMBA and RBF deficiency individually or in combination on esophageal tumorigenesis. Furthermore, we reveal the potential molecular mechanisms of RBF deficiency combined with NMBA inducing esophageal tumors.
Materials and methods
Animals and diets
Five-week-old male F344 rats were obtained from the Vital River Laboratory Animal Technology Co., Ltd. (Beijing, China). Rats were housed in a controlled environment and were allowed access to water ad libitum. The normal RBF diets were AIN-93M purified diet, which contains RBF 6 mg/kg (R6). RBF-deficient diets were made with the same formula, but contained RBF 0 mg/kg (R0), 0.6 mg/kg (R0.6), or 0.06 mg/kg (R0.06) (Trophic Animal Feed High-Tech Co., Ltd., Nantong, China) [22,23]. The concentration of RBF in the diets was analyzed by reversed-phase high-performance liquid chromatography (HPLC, Agilent 1200 system). N-nitrosomethylbenzylamine (NMBA, CAS NO. 937-40-6) was purchased from Shi Ruikai Technology Co., Ltd. (Wuhan, China).
Experimental design
This study was approved by the Institutional Animal Care and Use Committee of Shantou University. The Exp 1 design is shown in Figure 1A. Sixty-nine male F344 rats were randomly assigned to 4 groups (n = 15-18/group) into a 2 (no NMBA vs. NMBA) × 2 (normal RBF vs. RBF-deficient) factorial design, including normal RBF (R6), RBF-deficient (R0), normal RBF combined with NMBA (R6N) and RBF-deficient combined with NMBA groups (R0N). For NMBA treatment, the rats received subcutaneous 0.1 mL injections of 20% dimethyl sulfoxide (DMSO) containing NMBA (0.35 mg/kg body weight) 3 times per week for 5 weeks. Control rats received an equivalent volume of 20% DMSO (vehicle control). All rats were euthanized by general anesthesia with an overdose of diethyl ether at week 25 to assess the development of esophageal lesions.
Figure 1.
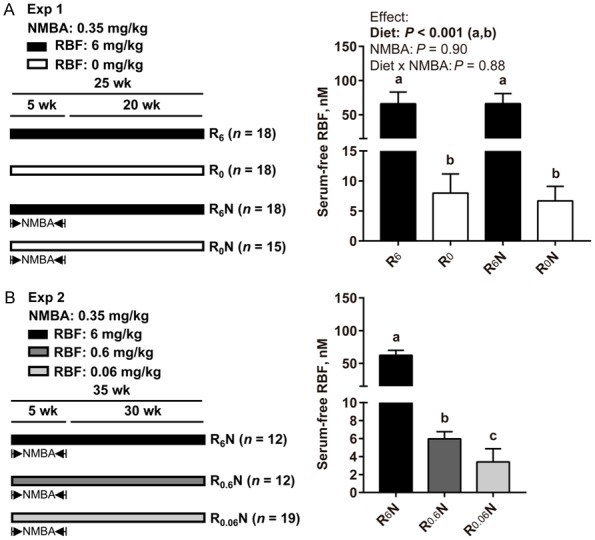
Establishment of a rat model induced by RBF deficiency combined with NMBA. (A, left) Exp 1. Sixty-nine male F344 rats were randomly assigned to 4 groups (n = 15-18/group) into a 2 (no NMBA vs. NMBA) × 2 (normal RBF vs. RBF-deficient) factorial design, including R6, R0, R6N, and R0N groups. NMBA (0.35 mg/kg body weight) subcutaneous injection 3 times per week for 5 weeks. Rats were euthanized at 25 weeks. (B, left) Exp 2. Forty-three male rats were randomly assigned to 3 groups (n = 12-19/group), including R6N, R0.6N, and R0.06N groups. Rats were euthanized at 35 weeks. (A, B, right) Serum free RBF levels in rats (nM). Values are means ± SD. Exp 1 different letters (a and b for diet effect) are significantly different by two-way ANOVA and LSD test (P < 0.05). Exp 2 different letters (a, b and c) are significantly different from each other by one-way ANOVA and LSD test (P < 0.05).
The Exp 2 design is shown in Figure 1B. Forty-three male F344 rats were randomized into 3 groups (n = 12-19/group), including R6N, R0.6N and R0.06N groups. All rats were euthanized at 35 week to assess the development of esophageal lesions.
Serum free RBF
Analysis of serum free RBF was performed using HPLC as described previously [24]. Briefly, proteins were removed from plasma by acid precipitation, and an aliquot of the resulting supernatant was analyzed by reversed-phase HPLC. Impurities were separated from RBF isocratically, and the target material was detected fluorometrically (excitation 450 nm; emission 520 nm).
Histopathological analysis
Tissue was fixed in 4% paraformaldehyde for 6 hours. After paraffin embedding, serial 4-μm tissue sections were cut for staining. Hematoxylin and eosin (HE)-stained sections were used for histological diagnosis.
Immunohistochemical staining and quantitative analysis
Immunohistochemistry (IHC) was performed using a 2-step protocol (PV-9000 Polymer Detection System; ZSGB-BIO, China) according to the manufacturer’s instructions and has been described in our previous studies [25]. Then, the esophageal sections were incubated with primary antibody for pan-Cytokeratin (1:250, Abcam, ab7753, UK), Ki67 (prediluted, Abcam, ab21700, UK), 8-hydroxy-2’-deoxyguanosine (8-OHdG) (1:16,000, Abcam, ab62623, UK), γH2AX (1:2,000, Novus Biologicals, NB100-384, USA) overnight at 4°C. Cells with a brown reaction product were defined as positive. Stain-positive cells were analyzed by a PerkinElmer Vectra system (PerkinElmer, PerkinElmer Vectra, USA). The percentage of positive cells of each group was calculated as the number of positive cells divided by the total number of basal cells.
RNA extraction and gene chip analysis
Comparative transcriptomic analysis of esophageal intraepithelial neoplasia (EIN) tissues vs. adjacent normal tissues in the R6N and R0N groups (n = 2 rats/group) was performed using GeneChip® Rat Transcriptome Array 1.0 (also known as the Clariom™ D Assay; Thermo Fisher Scientific Inc., 902634). (GEO accession numbers: GSE111207). HE-stained tissue was observed under a microscope, and the tissue of interest was isolated with a manual tissue arrayer and placed in a 1.5-mL microcentrifuge tube. The RNA extraction and gene chip analysis were performed by Shanghai Biotechnology Corporation (Shanghai, China) and in accordance with relevant protocols.
Expression data analysis
Raw data was normalized using the quantile normalization of the robust multi-array average (RMA) method in Expression Console (software provided by Affymetrix). Fold change was used to identify differentially-expressed mRNAs. Significantly up-regulated genes were defined by a fold change > 1.5, and significantly down-regulated genes were defined by a fold change < 0.66.
Gene ontology and pathway analysis
To explore the biological functions of the identified differentially-expressed genes, Gene Ontology (GO) and Kyoto Encyclopedia of Genes and Genomes (KEGG) pathway analyses were conducted using the Database for Annotation, Visualization and Integrated Discovery (DAVID) [26,27]. Significant GO terms and KEGG pathways were selected as the enriched terms based on values with P < 0.05.
Quantitative real-time reverse transcription polymerase chain reaction (qRT-PCR)
All primer sequences are shown in Supplementary Table 1. PCR amplifications were performed using SYBR Green Premix (TaKaRa Bio Inc., RR420B) according to the manufacturer’s instructions, and qRT-PCR analysis and data collection were carried out on an ABI 7500 qPCR system. For each mRNA, qRT-PCR reactions were performed in triplicate, with β-actin as the internal control gene for normalization. The relative mRNA expression was calculated using the 2-ΔΔCT method [28].
Enzyme-linked immunosorbent assay (ELISA)
The level of serum inflammatory cytokines S100A8, S100A9, and tumor necrosis factor alpha (TNF-α) were assayed using an ELISA kit (CSB-EL020641RA, CSB-EL020642RA and CSB-E11987r; Cusabio, China). ELISAs were performed according to the manufacturer’s instructions. The optical density value of each well was detected using a microplate reader set to 450 nm.
Routine blood tests
Collect rat post-glomus venous plexus blood and send it to the Department of Clinical Laboratory of the Cancer Hospital of Shantou University Medical College. Red blood cells, white blood cells, platelets and other indicators were detected by automatic biochemical analyzer (LH780, BECKMAN-COULTER).
Statistical analysis
Statistical analysis was performed using SPSS 22.0 software (SPSS, Chicago, IL). Data are presented as the means ± SD. Exp 1 data were tested by two-way analysis of variance (ANOVA) followed by Least Significant Difference (LSD) post hoc test. Exp 2 data were tested by one-way ANOVA followed by LSD post hoc test. Data having unequal variances were log-transformed to achieve equal variances. Differences in tumor incidence were assessed by Fisher’s exact test. Differential expression of mRNA between esophageal intraepithelial neoplasia and normal tissue were tested by Student’s t-test. Statistical tests were two-sided and were considered significant at P < 0.05.
Results
RBF deficiency combined with NMBA increases the incidence of esophageal tumors
In Exp 1, serum free RBF levels in RBF-deficient diet-fed rats (R0 and R0N groups) were significantly lower than that in normal RBF diet-fed rats (R6 and R6N groups) at 25 weeks (P < 0.001, Figure 1A). There was no interaction between diet and NMBA on the reduction of serum free RBF levels. RBF-deficient (R0) diet causes weight loss in rats, a representative picture is shown in Supplementary Figure 1A. At week 5, R0 diet significantly reduced the rat body weight (Supplementary Figure 1B, Exp 1, P < 0.001) and no interaction between diet and NMBA was observed. In Exp 2, the serum free RBF concentration was significant differences among the three groups at 35 weeks (P < 0.05, Figure 1B), resulting in the R6N group > R0.6N group > R0.06N group. Similarly, there were significant differences among the three groups in rat body weight at week 10 (Supplementary Figure 1B, Exp 2, P < 0.05). The above results indicate that a RBF-deficient diet establishes RBF deficiency in our model.
Representative images of esophageal papilloma (R6N) and carcinoma in situ (R0N) are shown in Figure 2A. In Exp 1, no benign hyperplasia (including hyperplasia and papilloma) occurred in either R6 or R0 group (0/18, 0%, respectively). R0 group induced a case of esophageal intraepithelial neoplasia (1/18, 5.6%), while R6 group did not induce. There was no significant difference between the R6 group and R0 group in esophageal tumors (P > 0.05). The results indicate that RBF deficiency alone is not sufficient to cause esophageal tumors.
Figure 2.
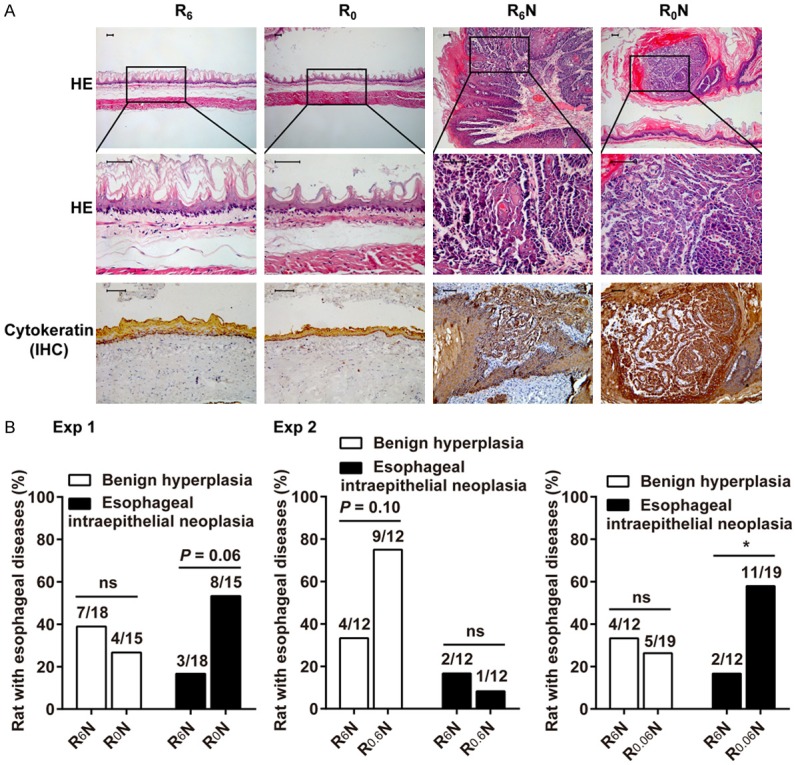
RBF deficiency combined with NMBA induces esophageal tumors in rats. A. HE staining and IHC for cytokeratin were performed on rat esophageal tissues. Representative images of esophageal papilloma (R6N) and carcinoma in situ (R0N). Scale bars, 50 μm. B. Incidence of benign hyperplasia and esophageal intraepithelial neoplasia in Exp 1 (n = 15-18/group) and Exp 2 (n = 12-19/group). Difference in incidence were assessed by Fisher’s exact test (P < 0.05). *Means differ, P < 0.05.
The incidence of pathological damage in the esophagus is summarized in Figure 2B (Exp 1). In combination with NMBA treatment, R6N mainly elicited an incidence of 38.9% benign hyperplasia and 16.7% esophageal intraepithelial neoplasia. R0N elicited an incidence of 53.3% esophageal intraepithelial neoplasia, including carcinoma in situ. The incidence of esophageal intraepithelial neoplasia in the R0N group tends to be higher than that in the R6N group (P = 0.06). Three rats in R0N group died before the end of study and were not included in the statistics. It may die from esophageal tumors. Other important organs, such as the heart, lung, liver, kidney, stomach, duodenum, jejunoileum, and colon tissues showed no histopathological lesions. Representative pictures are shown in Supplementary Figure 1C. Taken together, RBF deficiency promotes NMBA-induced esophageal tumorigenesis.
RBF deficiency promotes the incidence of esophageal tumors in a dose-dependent manner
In Exp 2, the incidence of pathological damage in the esophagus is summarized in Figure 2B (Exp 2). The results show that R6N treatment elicited a 33.3% incidence of benign hyperplasia and 16.7% incidence of esophageal intraepithelial neoplasia. Mild RBF deficiency, when combined with NMBA (R0.6N), elicited an incidence of 75.0% benign hyperplasia and 8.3% esophageal intraepithelial neoplasia. The incidence of benign hyperplasia in the R0.6N group tends to be higher than that in the R6N group (P = 0.10). Severe RBF deficiency (R0.06N) elicited an incidence of 26.3% benign hyperplasia and 57.9% esophageal intraepithelial neoplasia, including a case of carcinoma in situ. The incidence of esophageal intraepithelial neoplasia in the R0.06N group was increased above that in the R6N group (P < 0.05). Therefore, RBF deficiency promotes esophageal tumorigenesis in a dose-dependent manner.
RBF deficiency induces an inflammatory gene expression pattern in rat esophageal tumors
Hierarchical clustering analyses revealed that R0N esophageal intraepithelial neoplasia (EIN) tissues had distinct gene expression patterns when compared with R6N EIN tissues, although the expression profile exhibited a 2-branch partition with the 4 EIN samples clustered together and well separated from their matched normal controls (Figure 3A, 3B). Overall, a total of 163 genes (128 up- and 35 downregulated) were identified to be specifically differentially expressed in the R6N group; a total of 101 genes (36 up- and 65 downregulated) were identified to be specifically differentially expressed in the R0N group. The 2 sets of genes shared 8 common genes (Figure 3B). Among them, S100a8, Il36g, and Olr459 were upregulated, and Cav3 was downregulated in the 2 groups; Akr1b8, Fgfbp1, Rad23b, and Gspt1 were upregulated in the R6N group, but downregulated in the R0N group (Figure 3C, 3D).
Figure 3.
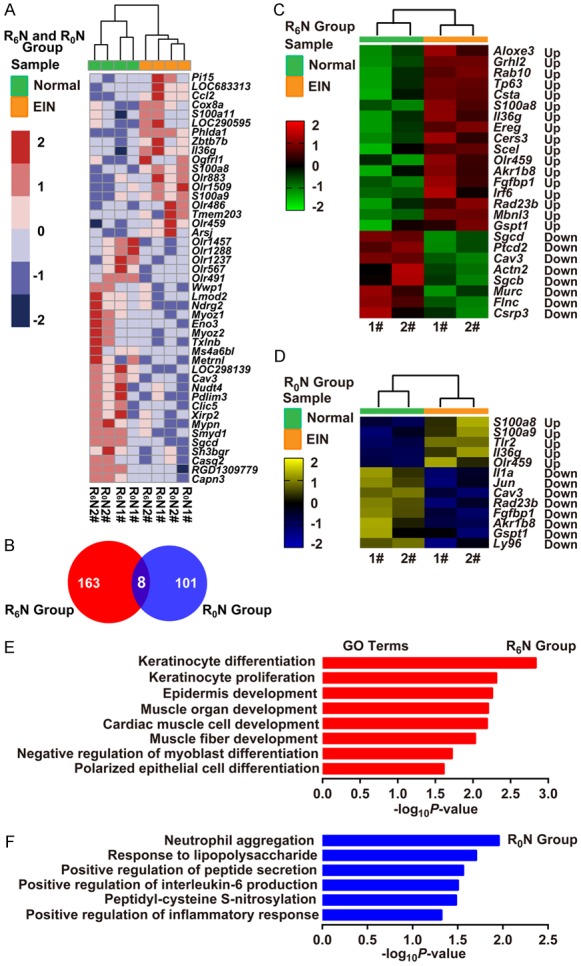
RBF deficiency induces an inflammatory gene expression profile in rat esophageal tumors. (A) Heat map showing gene expression profiling of the EIN vs. Normal tissues in the R6N and R0N groups (n = 2/group). (B) Venn diagram showing the unique and shared differentially-expressed genes between the R6N and R0N groups. (C, D) Heat map showing the differential gene expression profiling of EIN vs. Normal tissues in the R6N (C) and R0N (D) groups, respectively (n = 2/group). Log2-fold change ratios are shown in the results. (E, F) Bar diagrams showing the biological processes in the R6N (E) and R0N (F) groups. Predicted GO categories ranked by enrichment score [-log10 (P-value)]. Up, Up-regulated expression; Down, Down-regulated expression; 1# and 2#, identifier of rats.
GO and KEGG pathway annotation of differentially-expressed genes showed the R6N group was enriched in cell proliferation and differentiation terms (Figure 3E). The upregulated genes related to these terms were Aloxe3, Grhl2, Rab10, Tp63, Csta, Ereg, Cers3, Scel, and Irf6, with fold-changes ranging from 1.67- to 18.9-fold (Figure 3C). Interestingly, differentially-expressed genes in the R0N group were mainly annotated into inflammation-related terms (Figure 3F). The upregulated genes related to these terms were S100a8, S100a9, Tlr2, and Il36g, with fold-changes ranging from 1.55- to 4.3-fold. The down-regulated genes were Il1a, Jun, and Ly96 (Figure 3D). By quantitative real-time RT-PCR analysis, we validated that 4 proliferation-related genes (Aloxe3, Grhl2, Rab10, and Tp63) were highly expressed in EIN of the R6N group (Figure 4A, left). For RBF deficiency, inflammation-related genes S100a8, S100a9, and Tlr2 were highly expressed in EIN of the R0N group, while Il1a and Jun showed low expression (Figure 4A, right).
Figure 4.
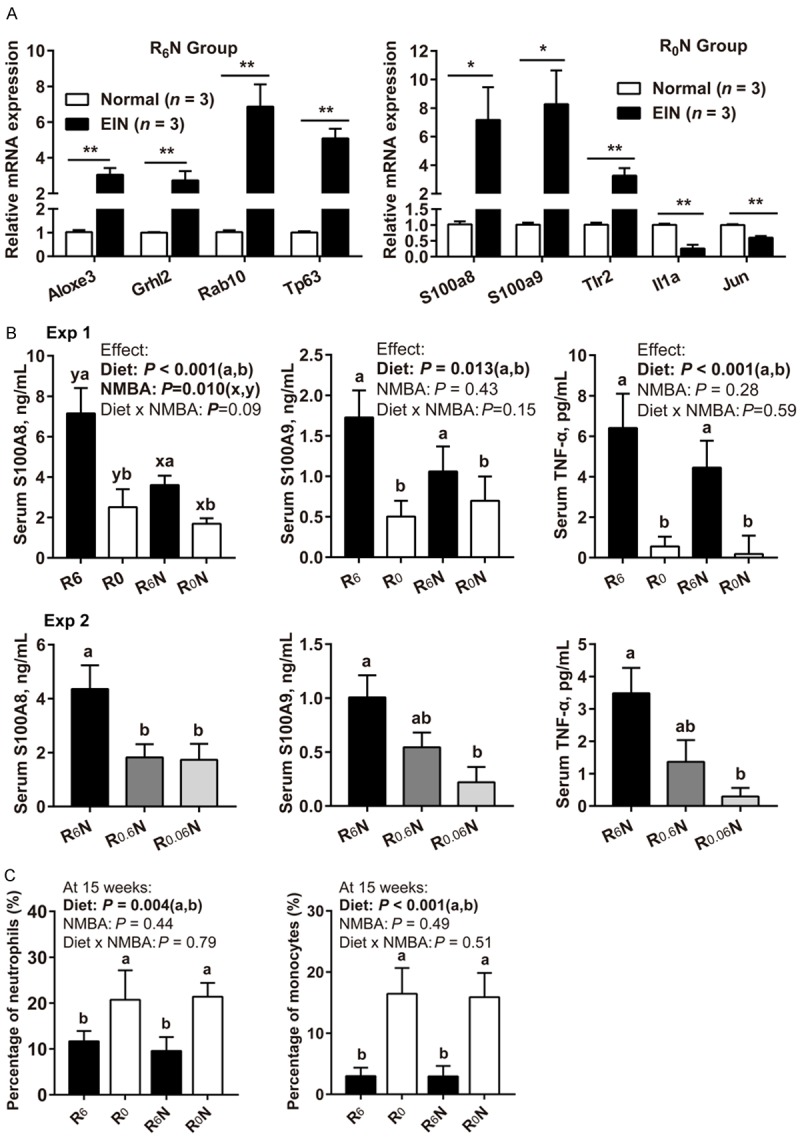
Effect of RBF deficiency on the levels of inflammatory markers in rat esophageal neoplasia tissues and peripheral blood. A. Validation of microarray data by qRT-PCR (EIN vs. Normal tissues, normalized to β-actin, n = 3/group). Data were analyzed by Student’s t-test. B. Detection of inflammatory marker expression levels in rat serum by ELISA (n = 6/group). C. At 15 weeks, the percentage of peripheral blood neutrophils, and monocytes in the total white blood cells (n = 15-18/group). Values are means ± SD. Exp 1 different letters (a and b for diet effect; x and y for NMBA effect) are significantly different by two-way ANOVA and LSD test (P < 0.05). Exp 2 different letters (a and b) are significantly different from each other by one-way ANOVA and LSD test (P < 0.05). *Means differ, P < 0.05. **Means differ, P < 0.01.
Surprisingly, the serum inflammatory cytokines S100A8, S100A9, and TNF-α were actually reduced in tumors developing under RBF deficiency (Figure 4B). In Exp 1, the serum concentrations of S100A8, S100A9, and TNF-α in the R0 diet-fed rats (R0 and R0N groups) were significantly lower than that in the R6 diet-fed rats (R6 and R6N groups) at week 25 (Figure 4B, Exp 1, P < 0.05). There was no interaction between diet and NMBA in the reduction of serum S100A8, S100A9, and TNF-α. In Exp 2, the serum concentrations of S100A8, S100A9, and TNF-α were significantly lower in group R0.06N than in group R6N at week 35 (Figure 4B, Exp 2, P < 0.05). Routine blood tests found that R0 diet significantly elevated peripheral blood neutrophils, and monocytes at week 15 (Figure 4C, P < 0.01), no interaction between diet and NMBA was observed. The total number of white blood cells and percentage of lymphocytes, eosinophils, basophils did not change (Supplementary Figure 2A, 2B, P > 0.05). Taken together, these results illustrated that RBF deficiency induces an inflammatory gene expression pattern in esophageal tumors.
RBF deficiency combined with NMBA promotes DNA damage in esophageal epithelium
Representative images are shown in Figure 5A. The percentage of Ki67-positive cells in the NMBA treatment group (R6N and R0N groups) were significantly higher than that in the NMBA untreated group (R6 and R0 groups) (Figure 5B, P < 0.001). There was no interaction between diet and NMBA in the elevation of Ki67-positive cells. Considering that prolonged inflammation may lead to DNA damage, we detected oxidative DNA damage biomarker 8-OHdG and double-strand breaks biomarker γH2AX [29-32]. Both diet and NMBA elevated the percentage of nuclear staining of 8-OHdG and γH2AX (Figure 5C, 5D, P < 0.05). However, we did not find any interaction between diet and NMBA in the elevation of 8-OHdG and γH2AX positive cells. These results revealed that NMBA, not RBF deficiency, is the main cause of esophageal cell proliferation. Both NMBA and RBF deficiency promote DNA damage.
Figure 5.
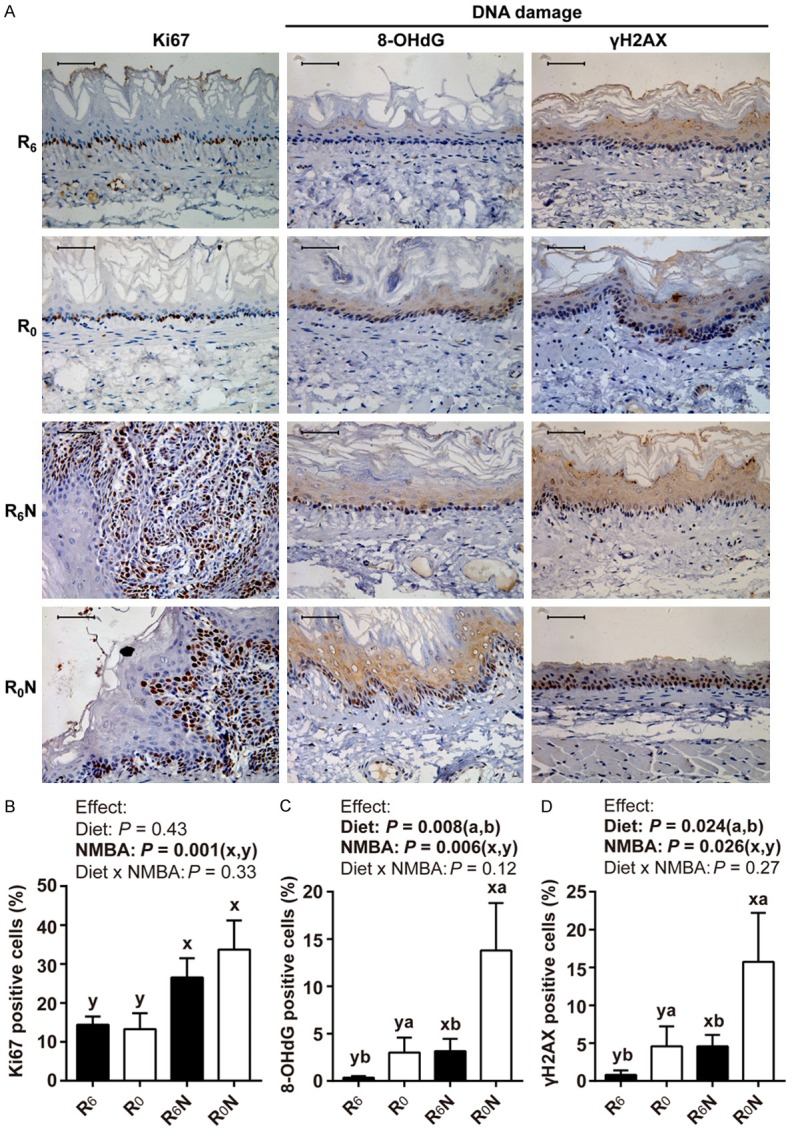
RBF deficiency combined with NMBA promotes DNA oxidative damage and double-strand breaks in the rat esophagus. A. Representative pictures of Ki67, 8-OHdG, and γH2AX immunohistochemistry in esophageal epithelium. Scale bars, 50 μm. B-D. Expression level of Ki67, 8-OHdG, and γH2AX was quantified by immunohistochemical staining, respectively (n = 15-18/group). Values are means ± SD. Different letters (a and b for diet effect; x and y for NMBA effect) are significantly different by two-way ANOVA and LSD test (P < 0.05).
Discussion
Several epidemiological studies have shown that RBF deficiency is a risk factor for esophageal cancer. Supplementation of RBF through nutritional intervention or RBF-fortified salt can effectively reduce the incidence of esophageal cancer in high-risk areas of China [33-35]. In animal studies, supplementing marginally deficient corn or wheat diets with various combinations of nicotinic acid, RBF, zinc, magnesium, molybdenum, and selenium significantly reduces NMBA-induced esophageal tumors [36,37]. In this study, our data demonstrate that RBF deficiency promotes NMBA-induced esophageal tumorigenesis. Mechanistically, RBF-deficient diet increases inflammatory markers, forming an inflammatory microenvironment in esophageal tumor tissue. Chronic inflammation-related DNA damage (as demonstrated by accumulation of DNA oxidative damage and DNA double-strand breaks) may trigger esophageal tumorigenesis.
The proposed mechanism of NMBA carcinogenicity is through microsomal activation to form benzaldehyde and an electrophilic metabolite that methylates DNA, producing O6- and 7-methylguanine adducts [38]. The occurrence of O6-methylguanine is thought to play a primary role in inducing DNA mutations [39,40]. Tp53 and Ha-Ras gene mutations are present in the majority of NMBA-induced rat esophageal papillomas [41,42]. In addition, dysregulation of TGF-alpha and EGFR expression play an important role in NMBA-induced rat esophageal tumorigenesis [43]. Our studies show that R6N esophageal intraepithelial neoplasia has a proliferation, differentiation, and development gene signature. The overall Ki67 (a cell proliferation marker) staining in esophagus of NMBA treatment group were significantly higher than that in NMBA untreated group. In summary, the primary carcinogenic mechanism of NMBA is to cause gene mutations, cell proliferation, and abnormal differentiation. DNA damage and double-strand breaks are not severe in epithelial cells of the esophagus, which may be responsible for the low tumorigenicity of NMBA.
Flavins play a central role in whole-body energy metabolism. RBF deficiency leads to low efficiency of growth energy utilization in rats [44,45]. Recently, multiple studies highlighted the pro-inflammatory effects of RBF-deficient. The expression and release of inflammatory cytokines are elevated in RBF-deficient adipocytes [46,47]. Chronic inflammation and low efficiency of growth energy utilization may be the main cause of weight loss in RBF-deficient rats. RBF deficiency elicits a pro-inflammatory gene expression profile in T lymphoma Jurkat cells [48]. Accordingly, our research shows that RBF deficiency induces an inflammatory gene expression pattern in esophageal tumors. The elevated inflammatory cytokines cause activation of NF-κB signaling pathway in ESCC cells [28]. NF-κB family members modulate the transcription of genes that regulate inflammation, proliferation, and immune regulation [49,50]. We speculate that RBF deficiency increases inflammatory cytokines and activates NF-κB, resulting in the release of cytokines, which in turn causes the activation of NF-κB. The positive feedback regulatory mechanism maintains chronic inflammation.
In humans, esophageal intraepithelial neoplasia and ESCC share high frequency of mutations and large-scale chromosome aberrations, indicating that the genetic stability of esophageal intraepithelial neoplasia has collapsed [51,52]. Chronic inflammation-related DNA damage (genomic instability) may trigger the initiation of esophageal squamous dysplasia [53]. In this study, RBF deficiency is a trigger of chronic inflammation that provides a microenvironment conducive to tumor initiation. Normal RBF combined with NMBA mainly induces the occurrence of benign esophageal hyperplasia. RBF deficiency in combination with NMBA accumulates DNA oxidative damage and DNA double-strand breaks, resulting in chronic inflammation-associated DNA damage, and promotes NMBA-induced esophageal tumorigenesis. The underlying molecular mechanisms still need to be revealed.
In conclusion, the present study demonstrates that RBF deficiency causes chronic inflammation-associated genomic instability, which may contribute to NMBA-induced esophageal tumorigenesis in rats. Our study suggests that RBF deficiency in the diet is a likely etiologic agent of chronic inflammation in the esophagus that contributes to ESCC development in humans. RBF supplementation in high incidence area of esophageal cancer has important clinical significance in reducing the incidence of esophageal cancer.
Acknowledgements
We thank Dr. Stanley Li Lin, Department of Cell Biology and Genetics, Shantou University Medical College, for assistance in revising the manuscript. We are grateful for assistance from the Central Laboratory at Shantou University Medical College, including Prof. Wen-Hong Luo, for obtaining the RBF concentration data by HPLC. This work was supported by grants from the Natural Science Foundation of China-Guangdong Joint Fund (No. U1301227), the National Cohort of Esophageal Cancer of China (2016YFC0901400).
Disclosure of conflict of interest
None.
Abbreviations
- DAVID
the Database for Annotation, Visualization and Integrated Discovery
- DMSO
dimethyl sulfoxide
- ELISA
enzyme-linked immunosorbent assay
- ESCC
esophageal squamous cell carcinoma
- EIN
esophageal intraepithelial neoplasia
- Exp
experiment
- GO
Gene Ontology
- γH2AX
the specific phosphorylation at serine 139 of the histone H2AX
- HE
hematoxylin and eosin
- 8-OHdG
8-hydroxy-2’-deoxyguanosine
- HPLC
high performance liquid chromatography
- IHC
immunohistochemistry
- KEGG
Kyoto Encyclopedia of Genes and Genomes
- NMBA or N
N-nitrosomethylbenzylamine
- RBF or R
riboflavin
- wk
week
Supporting Information
References
- 1.Pennathur A, Gibson MK, Jobe BA, Luketich JD. Oesophageal carcinoma. Lancet. 2013;381:400–412. doi: 10.1016/S0140-6736(12)60643-6. [DOI] [PubMed] [Google Scholar]
- 2.Ferlay J, Soerjomataram I, Dikshit R, Eser S, Mathers C, Rebelo M, Parkin DM, Forman D, Bray F. Cancer incidence and mortality worldwide: sources, methods and major patterns in GLOBOCAN 2012. Int J Cancer. 2015;136:E359–386. doi: 10.1002/ijc.29210. [DOI] [PubMed] [Google Scholar]
- 3.Siegel R, Ma J, Zou Z, Jemal A. Cancer statistics, 2014. CA Cancer J Clin. 2014;64:9–29. doi: 10.3322/caac.21208. [DOI] [PubMed] [Google Scholar]
- 4.Wang JD, Ma J, Wang FY, Peng LB, Wang X, Shi SS, Ma HH, Lu ZF, Lu GM, Zhou XJ. Amplification of the telomerase RNA component gene as a new genetic marker for disease progression and prognosis in esophageal squamous cell carcinoma. Dis Esophagus. 2013;26:737–745. doi: 10.1111/dote.12021. [DOI] [PubMed] [Google Scholar]
- 5.Dawsey SM, Lewin KJ, Liu FS, Wang GQ, Shen Q. Esophageal morphology from Linxian, China. Squamous histologic findings in 754 patients. Cancer. 1994;73:2027–2037. doi: 10.1002/1097-0142(19940415)73:8<2027::aid-cncr2820730803>3.0.co;2-3. [DOI] [PubMed] [Google Scholar]
- 6.Taylor PR, Abnet CC, Dawsey SM. Squamous dysplasia--the precursor lesion for esophageal squamous cell carcinoma. Cancer Epidemiol Biomarkers Prev. 2013;22:540–552. doi: 10.1158/1055-9965.EPI-12-1347. [DOI] [PMC free article] [PubMed] [Google Scholar]
- 7.Shimizu M, Nagata K, Yamaguchi H, Kita H. Squamous intraepithelial neoplasia of the esophagus: past, present, and future. J Gastroenterol. 2009;44:103–112. doi: 10.1007/s00535-008-2298-y. [DOI] [PubMed] [Google Scholar]
- 8.Abnet CC, Arnold M, Wei WQ. Epidemiology of esophageal squamous cell carcinoma. Gastroenterology. 2018;154:360–373. doi: 10.1053/j.gastro.2017.08.023. [DOI] [PMC free article] [PubMed] [Google Scholar]
- 9.Yang CS. Research on esophageal cancer in China: a review. Cancer Res. 1980;40:2633–2644. [PubMed] [Google Scholar]
- 10.Tan HZ, Lin WJ, Huang JQ, Dai M, Fu JH, Huang QH, Chen WM, Xu YL, Ye TT, Lin ZY, Lin XS, Cai JX, Dong YH, Luo HY, Chen SH, Huang YL, Yang J, Lin AX, Yuan XQ, Chen SY, Wang KS, Zhuang CY, Wang SC, Lin LL, Zou XF, Song ZH, Fang XH, Chen T, Zhang JH, Li KQ, Chen LH, Lin XP, Lin JM, Lin JN, Lin PL, Chen JT, Lin KM, Hong XC, Wang LD, Xu LY, Li EM, Zhang JJ. Updated incidence rates and risk factors of esophageal cancer in Nan’ao Island, a coastal high-risk area in southern China. Dis Esophagus. 2017;30:1–7. doi: 10.1111/dote.12468. [DOI] [PubMed] [Google Scholar]
- 11.Peiffer DS, Wang LS, Zimmerman NP, Ransom BW, Carmella SG, Kuo CT, Chen JH, Oshima K, Huang YW, Hecht SS, Stoner GD. Dietary consumption of black raspberries or their anthocyanin constituents alters innate immune cell trafficking in esophageal cancer. Cancer Immunol Res. 2016;4:72–82. doi: 10.1158/2326-6066.CIR-15-0091. [DOI] [PubMed] [Google Scholar]
- 12.Taccioli C, Chen H, Jiang Y, Liu XP, Huang K, Smalley KJ, Farber JL, Croce CM, Fong LY. Dietary zinc deficiency fuels esophageal cancer development by inducing a distinct inflammatory signature. Oncogene. 2012;31:4550–4558. doi: 10.1038/onc.2011.592. [DOI] [PMC free article] [PubMed] [Google Scholar]
- 13.Sun J, Liu J, Pan X, Quimby D, Zanesi N, Druck T, Pfeifer GP, Croce CM, Fong LY, Huebner K. Effect of zinc supplementation on N-nitrosomethylbenzylamine-induced forestomach tumor development and progression in tumor suppressor-deficient mouse strains. Carcinogenesis. 2011;32:351–358. doi: 10.1093/carcin/bgq251. [DOI] [PMC free article] [PubMed] [Google Scholar]
- 14.Stoner GD, Gupta A. Etiology and chemoprevention of esophageal squamous cell carcinoma. Carcinogenesis. 2001;22:1737–1746. doi: 10.1093/carcin/22.11.1737. [DOI] [PubMed] [Google Scholar]
- 15.Xu M, Yang H, Zhang Q, Lu P, Feng Y, Geng X, Zhang L, Jia X. Alpha-tocopherol prevents esophageal squamous cell carcinoma by modulating PPARgamma-Akt signaling pathway at the early stage of carcinogenesis. Oncotarget. 2017;8:95914–95930. doi: 10.18632/oncotarget.21437. [DOI] [PMC free article] [PubMed] [Google Scholar]
- 16.Wu IC, Chen YK, Wu CC, Cheng YJ, Chen WC, Ko HJ, Liu YP, Chai CY, Lin HS, Wu DC, Wu MT. Overexpression of ATPase Na+/+ transporting alpha 1 polypeptide, ATP1A1, correlates with clinical diagnosis and progression of esophageal squamous cell carcinoma. Oncotarget. 2016;7:85244–85258. doi: 10.18632/oncotarget.13267. [DOI] [PMC free article] [PubMed] [Google Scholar]
- 17.Tatematsu K, Koide A, Morimura K, Fukushima S, Mori Y. The enhancing effect of ethanol on the mutagenic activation of N-nitrosomethylbenzylamine by cytochrome P450 2A in the rat oesophagus. Mutagenesis. 2013;28:161–169. doi: 10.1093/mutage/ges066. [DOI] [PubMed] [Google Scholar]
- 18.Rivlin RS. Riboflavin and cancer: a review. Cancer Res. 1973;33:1977–1986. [PubMed] [Google Scholar]
- 19.Ainiwaer J, Tuerhong A, Hasim A, Chengsong D, Liwei Z, Sheyhidin I. Association of the plasma riboflavin levels and riboflavin transporter (C20orf54) gene statuses in Kazak esophageal squamous cell carcinoma patients. Mol Biol Rep. 2013;40:3769–3775. doi: 10.1007/s11033-012-2453-7. [DOI] [PubMed] [Google Scholar]
- 20.Li SS, Xu YW, Wu JY, Tan HZ, Wu ZY, Xue YJ, Zhang JJ, Li EM, Xu LY. Plasma riboflavin level is associated with risk, relapse, and survival of esophageal squamous cell carcinoma. Nutr Cancer. 2017;69:21–28. doi: 10.1080/01635581.2017.1247890. [DOI] [PubMed] [Google Scholar]
- 21.Long L, He JZ, Chen Y, Xu XE, Liao LD, Xie YM, Li EM, Xu LY. Riboflavin depletion promotes tumorigenesis in HEK293T and NIH3T3 cells by sustaining cell proliferation and regulating cell cycle-related gene transcription. J Nutr. 2018;148:834–843. doi: 10.1093/jn/nxy047. [DOI] [PubMed] [Google Scholar]
- 22.Tanabe R, Haraikawa M, Sogabe N, Sugimoto A, Kawamura Y, Takasugi S, Nagata M, Nakane A, Yamaguchi A, Iimura T, Goseki-Sone M. Retention of bone strength by feeding of milk and dairy products in ovariectomized rats: involvement of changes in serum levels of 1alpha, 25(OH)2D3 and FGF23. J Nutr Biochem. 2013;24:1000–1007. doi: 10.1016/j.jnutbio.2012.07.004. [DOI] [PubMed] [Google Scholar]
- 23.Fotschki B, Juskiewicz J, Jurgonski A, Rigby N, Sojka M, Kolodziejczyk K, Mackie A, Zdunczyk Z. Raspberry pomace alters cecal microbial activity and reduces secondary bile acids in rats fed a high-fat diet. J Nutr Biochem. 2017;46:13–20. doi: 10.1016/j.jnutbio.2017.03.004. [DOI] [PubMed] [Google Scholar]
- 24.Petteys BJ, Frank EL. Rapid determination of vitamin B(2) (riboflavin) in plasma by HPLC. Clin Chim Acta. 2011;412:38–43. doi: 10.1016/j.cca.2010.08.037. [DOI] [PubMed] [Google Scholar]
- 25.He JZ, Wu ZY, Wang SH, Ji X, Yang CX, Xu XE, Liao LD, Wu JY, Li EM, Zhang K, Xu LY. A decision tree-based combination of ezrin-interacting proteins to estimate the prognostic risk of patients with esophageal squamous cell carcinoma. Hum Pathol. 2017;66:115–125. doi: 10.1016/j.humpath.2017.06.003. [DOI] [PubMed] [Google Scholar]
- 26.Da WH, Sherman BT, Lempicki RA. Systematic and integrative analysis of large gene lists using DAVID bioinformatics resources. Nat Protoc. 2009;4:44. doi: 10.1038/nprot.2008.211. [DOI] [PubMed] [Google Scholar]
- 27.Wei HD, Sherman BT, Lempicki RA. Bioinformatics enrichment tools: paths toward the comprehensive functional analysis of large gene lists. Nucleic Acids Res. 2009;37:1. doi: 10.1093/nar/gkn923. [DOI] [PMC free article] [PubMed] [Google Scholar]
- 28.Long L, Pang XX, Lei F, Zhang JS, Wang W, Liao LD, Xu XE, He JZ, Wu JY, Wu ZY, Wang LD, Lin DC, Li EM, Xu LY. SLC52A3 expression is activated by NF-kappaB p65/Rel-B and serves as a prognostic biomarker in esophageal cancer. Cell Mol Life Sci. 2018;75:2643–2661. doi: 10.1007/s00018-018-2757-4. [DOI] [PMC free article] [PubMed] [Google Scholar]
- 29.Mantovani A, Allavena P, Sica A, Balkwill F. Cancer-related inflammation. Nature. 2008;454:436–444. doi: 10.1038/nature07205. [DOI] [PubMed] [Google Scholar]
- 30.Geric M, Gajski G, Garaj-Vrhovac V. Gamma-H2AX as a biomarker for DNA double-strand breaks in ecotoxicology. Ecotoxicol Environ Saf. 2014;105:13–21. doi: 10.1016/j.ecoenv.2014.03.035. [DOI] [PubMed] [Google Scholar]
- 31.Dabrowska N, Wiczkowski A. Analytics of oxidative stress markers in the early diagnosis of oxygen DNA damage. Adv Clin Exp Med. 2017;26:155–166. doi: 10.17219/acem/43272. [DOI] [PubMed] [Google Scholar]
- 32.Anuja K, Roy S, Ghosh C, Gupta P, Bhattacharjee S, Banerjee B. Prolonged inflammatory microenvironment is crucial for pro-neoplastic growth and genome instability: a detailed review. Inflamm Res. 2017;66:119–128. doi: 10.1007/s00011-016-0985-3. [DOI] [PubMed] [Google Scholar]
- 33.Taylor PR, Li B, Dawsey SM, Li JY, Yang CS, Guo W, Blot WJ. Prevention of esophageal cancer: the nutrition intervention trials in Linxian, China. Linxian Nutrition Intervention Trials Study Group. Cancer Res. 1994;54:2029s–2031s. [PubMed] [Google Scholar]
- 34.Dawsey SM, Wang GQ, Taylor PR, Li JY, Blot WJ, Li B, Lewin KJ, Liu FS, Weinstein WM, Wiggett S, et al. Effects of vitamin/mineral supplementation on the prevalence of histological dysplasia and early cancer of the esophagus and stomach: results from the dysplasia trial in Linxian, China. Cancer Epidemiol Biomarkers Prev. 1994;3:167–172. [PubMed] [Google Scholar]
- 35.He Y, Ye L, Shan B, Song G, Meng F, Wang S. Effect of riboflavin-fortified salt nutrition intervention on esophageal squamous cell carcinoma in a high incidence area, China. Asian Pac J Cancer Prev. 2009;10:619–622. [PubMed] [Google Scholar]
- 36.van Rensburg SJ, Hall JM, du Bruyn DB. Effects of various dietary staples on esophageal carcinogenesis induced in rats by subcutaneously administered N-nitrosomethylbenzylamine. J Natl Cancer Inst. 1985;75:561–566. [PubMed] [Google Scholar]
- 37.van Rensburg SJ, Hall JM, Gathercole PS. Inhibition of esophageal carcinogenesis in corn-fed rats by riboflavin, nicotinic acid, selenium, molybdenum, zinc, and magnesium. Nutr Cancer. 1986;8:163–170. doi: 10.1080/01635588609513890. [DOI] [PubMed] [Google Scholar]
- 38.Fong LY, Lin HJ, Lee CL. Methylation of DNA in target and non-target organs of the rat with methylbenzylnitrosamine and dimethylnitrosamine. Int J Cancer. 1979;23:679–682. doi: 10.1002/ijc.2910230514. [DOI] [PubMed] [Google Scholar]
- 39.Bedell MA, Lewis JG, Billings KC, Swenberg JA. Cell specificity in hepatocarcinogenesis: preferential accumulation of O6-methylguanine in target cell DNA during continuous exposure to rats to 1,2-dimethylhydrazine. Cancer Res. 1982;42:3079–3083. [PubMed] [Google Scholar]
- 40.Doniger J, Day RS, DiPaolo JA. Quantitative assessment of the role of O6-methylguanine in the initiation of carcinogenesis by methylating agents. Proc Natl Acad Sci U S A. 1985;82:421–425. doi: 10.1073/pnas.82.2.421. [DOI] [PMC free article] [PubMed] [Google Scholar]
- 41.Liston BW, Gupta A, Nines R, Carlton PS, Kresty LA, Harris GK, Stoner GD. Incidence and effects of Ha-ras codon 12 G-->A transition mutations in preneoplastic lesions induced by N-nitrosomethylbenzylamine in the rat esophagus. Mol Carcinog. 2001;32:1–8. doi: 10.1002/mc.1058. [DOI] [PubMed] [Google Scholar]
- 42.Wang D, Weghorst CM, Calvert RJ, Stoner GD. Mutation in the p53 tumor suppressor gene in rat esophageal papillomas induced by N-nitrosomethylbenzylamine. Carcinogenesis. 1996;17:625–630. doi: 10.1093/carcin/17.4.625. [DOI] [PubMed] [Google Scholar]
- 43.Wang QS, Sabourin CL, Bijur GN, Robertson FM, Stoner GD. Alterations in transforming growth factor-alpha and epidermal growth factor receptor expression during rat esophageal tumorigenesis. Mol Carcinog. 1996;15:144–153. doi: 10.1002/(SICI)1098-2744(199602)15:2<144::AID-MC7>3.0.CO;2-J. [DOI] [PubMed] [Google Scholar]
- 44.Olpin SE, Bates CJ. Lipid metabolism in riboflavin-deficient rats. Br J Nutr. 1982;47:589–596. doi: 10.1079/bjn19820070. [DOI] [PubMed] [Google Scholar]
- 45.Duerden JM, Bates CJ. Effect of riboflavin deficiency on reproductive performance and on biochemical indices of riboflavin status in the rat. Br J Nutr. 1985;53:97–105. doi: 10.1079/bjn19850014. [DOI] [PubMed] [Google Scholar]
- 46.Mazur-Bialy AI, Pochec E. Vitamin B2 deficiency enhances the pro-inflammatory activity of adipocyte, consequences for insulin resistance and metabolic syndrome development. Life Sci. 2017;178:9–16. doi: 10.1016/j.lfs.2017.04.010. [DOI] [PubMed] [Google Scholar]
- 47.Mazur-Bialy AI, Pochec E. Riboflavin reduces pro-inflammatory activation of adipocyte-macrophage co-culture. Potential application of vitamin B2 enrichment for attenuation of insulin resistance and metabolic syndrome development. Molecules. 2016;21 doi: 10.3390/molecules21121724. [DOI] [PMC free article] [PubMed] [Google Scholar]
- 48.Liu D, Zempleni J. Low activity of LSD1 elicits a pro-inflammatory gene expression profile in riboflavin-deficient human T Lymphoma Jurkat cells. Genes Nutr. 2014;9:422. doi: 10.1007/s12263-014-0422-6. [DOI] [PMC free article] [PubMed] [Google Scholar]
- 49.Hayden MS, Ghosh S. Shared principles in NF-kappaB signaling. Cell. 2008;132:344–362. doi: 10.1016/j.cell.2008.01.020. [DOI] [PubMed] [Google Scholar]
- 50.Sun SC. The noncanonical NF-kappaB pathway. Immunol Rev. 2012;246:125–140. doi: 10.1111/j.1600-065X.2011.01088.x. [DOI] [PMC free article] [PubMed] [Google Scholar]
- 51.Chen XX, Zhong Q, Liu Y, Yan SM, Chen ZH, Jin SZ, Xia TL, Li RY, Zhou AJ, Su Z, Huang YH, Huang QT, Huang LY, Zhang X, Zhao YN, Yun JP, Wu QL, Lin DX, Bai F, Zeng MS. Genomic comparison of esophageal squamous cell carcinoma and its precursor lesions by multi-region whole-exome sequencing. Nat Commun. 2017;8:524. doi: 10.1038/s41467-017-00650-0. [DOI] [PMC free article] [PubMed] [Google Scholar]
- 52.Liu X, Zhang M, Ying S, Zhang C, Lin R, Zheng J, Zhang G, Tian D, Guo Y, Du C, Chen Y, Chen S, Su X, Ji J, Deng W, Li X, Qiu S, Yan R, Xu Z, Wang Y, Guo Y, Cui J, Zhuang S, Yu H, Zheng Q, Marom M, Sheng S, Zhang G, Hu S, Li R, Su M. Genetic alterations in esophageal tissues from squamous dysplasia to carcinoma. Gastroenterology. 2017;153:166–177. doi: 10.1053/j.gastro.2017.03.033. [DOI] [PubMed] [Google Scholar]
- 53.Lin R, Zhang C, Zheng J, Tian D, Lei Z, Chen D, Xu Z, Su M. Chronic inflammation-associated genomic instability paves the way for human esophageal carcinogenesis. Oncotarget. 2016;7:24564–24571. doi: 10.18632/oncotarget.8356. [DOI] [PMC free article] [PubMed] [Google Scholar]
Associated Data
This section collects any data citations, data availability statements, or supplementary materials included in this article.