Abstract
Background: Thyroid carcinoma (TC) is a common malignancy of the endocrine system. This research aimed to examine the expression levels of miR-136-5p and metadherin (MTDH) in TC and unveil their potential targeting relationship. Methods: TC microRNA (miRNA) microarray and miRNA-sequencing data were collected to evaluated miR-136-5p expression. We assessed the comprehensive expression of miR-136-5p by calculating the standard mean difference (SMD) and summary receiver operating characteristic curves (sROC). Subsequently, the miR-136-5p mimic and inhibitor were transfected into the TC B-CPAP cell, Thiazolyl Blue Tetrazolium Bromide (MTT) assay and cell apoptosis assay by FACS with Annexin V-/7-AAD double staining were performed to explore the biological role of miR-136-5p in the B-CPAP cell line. Prediction of target genes and potential biological function analysis of miR-136-5p were made using miRWalk2.0 and DAVID, respectively. Through target gene prediction, MTDH may be the candidate target gene of miR-136-5p. Subsequently, gene microarrays and RNA-sequencing data were also leveraged for MTDH expression. The meta-analysis method was conducted to evaluate the comprehensive expression level of MTDH. In addition, MTDH protein expression was identified using immunohistochemistry. The MTDH protein levels post-miR-136-5p transfection were verified by western blot, and the dual luciferase reporter assay was adapted to confirm the direct targeting relation between miR-136-5p and MTDH. Results: The miR-136-5p level was remarkably downregulated in TC, the pooled SMD was -0.47 (95% CI: -0.70 to -0.23, I2=36.6%, P=0.192) and the area under the curve (AUC) of the sROC was 0.67 based on 543 cases of TC. MTT indicated that the overexpression of miR-136-5p dramatically inhibited the proliferation of B-CPAP cells. The cell apoptosis increased in the miR-136-5p mimic group compared to the negative control group. In addition, both MTDH mRNA and protein levels were markedly overexpressed, with the pooled SMD being 0.94 (95% CI: -0.35 to 2.24, I2=98.8%, P<0.001), and the AUC of the sROC being 0.85 with 1054 cases of TC. The MTDH protein level was significantly up-regulated in TC than in the non-carcinomic tissues by immunohistochemistry (8.292±1.717 vs. 2.618±2.570, P<0.001). Western blot indicated that MTDH protein expression was suppressed by miR-136-5p mimic in the B-CPAP cell line, which was further supported by the dual luciferase reporter assay. Conclusion: The miR-136-5p/MTDH axis may play a vital role in modulating TC tumorigenesis, providing new insight into possible molecular mechanisms of TC oncogenesis.
Keywords: MiR-136-5p, MTDH, thyroid carcinoma, microRNA microarray and microRNA-sequencing, proliferation, apoptosis
Introduction
Thyroid carcinoma (TC) is a frequently occurring endocrine tumor, accounting for approximately 3.1% of all human malignancies [1]. Papillary thyroid carcinoma (PTC) is the most frequent pathological subtype of TC, making up for about 80% cases, and its incident rate is greater than several other subtypes, such as anaplastic thyroid carcinoma, follicular thyroid carcinoma and medullary thyroid carcinoma [2-6]. The incident rate of TC is different between men and women; the risk of women is more than three times that of men. Over the past few decades, the occurrence of TC has shown an upward trend in many countries [7,8]. Although the general mortality rate of TC is relatively low, with the five-year survival rate reaching 98% [9-11], the clinical outcome of advanced TC is still unsatisfactory. Nearly half of patients with distant TC metastasis die within five years after diagnosis [12,13]. Recurrence and lung metastasis remain the leading causes of TC death, but the molecular mechanisms of TC oncogenesis and development are still barely understood [14-16].
Clarifying the molecular mechanism of TC using microRNA (miRNA) has received extensive attention in recent years [17-20]. By combining the 3’ untranslated region (3’-UTR) of its target gene, miRNA can induce mRNA degradation or inhibit mRNA translation, thereby exerting a corresponding biological effect [21-25]. Some studies have documented that certain miRNAs are abnormally expressed in TC. However, in TC, there are still plenty of miRNAs with unknown functions that are awaiting exploration. Among the numerous TC miRNA studies, only one study reported the expression of miR-136-5p in PTC. Peng et al. used four highly-invasive PTCs, four low-invasive PTCs, and four benign thyroid nodular goiters for miRNA microarray detection. They revealed that the miR-136-5p levels were higher in the highly-invasive PTC group than in the other two groups. However, in a subsequent real time RT-qPCR validation, they found that the delta CT of the miR-136-5p in 15 cases of benign thyroid nodular goiter was -2.43 and -2.62 in the PTC, indicating no remarkable differences in the miR-136-5p levels between the benign thyroid lesions and PTC (P=0.973) [26]. Because of the small sample size of this investigation, the clinical implications and specific molecular biological mechanisms of miR-136-5p in TC require clarification.
The development of microarrays and RNA-sequencing technologies has led to a trend in analyzing genome-wide miRNA expression profiles. In this study, we combined miRNA microarray and miRNA-sequencing data to determine the clinical value of miR-136-5p in TC. Thiazolyl Blue Tetrazolium Bromide (MTT) and apoptosis assay were performed to assess the biological role of miR-136-5p in TC. After predicting its potential target genes, we found that MDTH may be a potential downstream molecule of miR-136-5p, which we selected for in-depth validation. The expression trends of MTDH in TC were comprehensively analyzed using gene microarrays, RNA-sequencing, Immunohistochemistry (IHC) and meta-analyses. IHC was conducted to assess the protein expression of MTDH, which was validated using western blot. Simultaneously, the negative regulatory relation between miR-136-5p and MTDH was confirmed by a dual luciferase reporter assay.
Materials and methods
MiR-136-5p expression levels in TC based on miRNA-microarray and miRNA-sequencing datasets databases
MiRNA-microarray and miRNA-sequencing datasets were gathered from the Gene Expression Omnibus (GEO) and ArrayExpress by utilizing the following keywords: (thyroid) AND (cancer OR carcinoma OR tumor* OR neoplas* OR malignan*) AND (MicroRNA OR miRNA). In addition, for the sake of further mining expression data of miR-136-5p and clinicopathological features, published articles concerning miR-136-5p expression assessed through miRNA-microarray, miRNA-sequencing or RT-qPCR before October 25, 2019 were identified using PubMed, PMC, Web of sciences, EMBASE, Google Scholar, Wanfang, Qvip and CNKI databases. In addition, data for miRNA-seq and clinical parameter information of miRNAs from TCGA was downloaded, which was adapted to assess miR-136-5p expression in TC compared to adjacent non-carcinomic tissues and to evaluate the connection between miR-136-5p expression and clinicopathologic features. Meanwhile, we also conducted the meta-analysis of the included microarray’s data.
Cell culture
The TC cell line B-CPAP was purchased from Shanghai Institutes for Biological Sciences (China), which was cultured at 37°C in an atmosphere of 5% CO2 in a 1640 medium (Procell Life Science & Technology Co, Ltd.) including 10% fetal bovine serum (Gibco Company, USA) and 1% pen/strep (Genview, Beijing). All the experiments were repeated three times independently.
Cell transfection with miR-136-5p mimic, miR-136-5p inhibitor and their corresponding negative controls
B-CPAP cells in the logarithmic growth phase were collected and digested with 0.25% trypsin. According to the density of 3×10⁵ cells/well, the cell suspension inoculated in 6-well plates and plated for 18-24 h. Five μl of Lipofectamine 3000 and 2.5 μg plasmid with 5 μl P3000 were added to 125 μl of serum-free and non-antibody-based basal medium, respectively, to prepare two premixed liquids, which were then mixed together. After standing at room temperature for 10 minutes, the mixed liquid was transferred into six wells, cultured at 37°C, 5% CO2 for 6 h. In the following experiments, we constructed four groups: miR-136-5p mimic, mimic NC (NC), miR-136-5p inhibitor and inhibitor NC.
RT-qPCR analysis
The miRNA expression level was quantitatively measured by the Taqman MicroRNA Assays (Applied Biosystems, CA, USA) with particular primers of miR-136-5p on B-CPAP cells. A reverse transcription reaction was started from 5 μg of total RNA by primer. And then, RT-qPCR analysis was performed through the ABI7500 detection system. The change in the amount of the product from each cycle amplification in the PCR amplification reaction was detected in real time. The initial template could be quantitatively analyzed through the analysis of the Ct value and standard curve, the fold changes were counted by the 2-ΔΔCt method.
Proliferation assessed by MTT assay
For the purpose of probing the influence of miR-136-5p on TC cells proliferation, B-CPAP cells transfected with different plasmids were planted in 96-well plates with a density of 8000 cells/wells. After the transplasmid graft plate, steady adherence of cells to the wall was defined as 0 hour. The MTT assay was carried out at 24 h, 48 h, 72 h and 96 h after treatment. The absorbency of each sample was detected by an enzyme-linked immune monitor at 490 nm. To record the results of this experiment, the cell growth curve was drafted with time as the x-coordinate and cell relative survival rate as the y-coordinate.
Cell apoptosis experiment by flow cytometry
After the transfection, the cells were cultured for another 24-48 hours. Then the cells were collected and washed twice with pre-cooled phosphate buffer saline. Subsequently, 100 μl of cells were suspended in a 5 ml flow tube and mixed with 5 μl Annexin V-PE and 5 μl 7-AAD, respectively. These were cultured at ambient temperatures for 15 minutes. The percent of apoptotic cells was evaluated using flow cytometry (FACS).
Prediction of target genes and potential biological function analysis of miR-136-5p
To further reveal the potential biological mechanisms of miR-136-5p, miRWalk2.0 containing PITA, RNAhybrid, Targetscan, MicroT4 and miRMap were used to predict potential target genes of miR-136-5p [27]. Predicted genes were used to perform GO, KEGG and PANTHER analyses using DAVID to uncover the biological function of miR-136-5p. Among the many predicted target genes, we concentrated on metadherin (MTDH) because it has been reported as a cancer-causing gene for various carcinomas. We found that MTDH could be a crucial target gene in TC, so we further studied the expression level of MTDH in TC while probing its targeted relationship with miR-136-5p and the potential molecular function in TC. In addition, the protein interaction network of MTDH was constructed to predict its biological effects using GeneMANIA, a website for constructing biological network to predict gene functions [28].
Evaluation of MTDH expression in TC using various datasets
RNA microarray or sequencing datasets were gathered from the GEO database and Array Express and utilized the following keywords: (thyroid) AND (cancer OR carcinoma OR tumo* OR neoplas* OR malignan*) AND (mRNA OR gene OR “messenger RNA”). Articles published before October 25, 2019 were identified using PubMed, Web of Sciences, EMBASE, Google Scholar, Wanfang, Qvip and CNKI databases. In addition, RNA-Seq data of MTDH from TCGA and GTEx were downloaded. TCGA and GTEx data were combined using R language (limma package), and the batch effect was processed. Subsequently, merged data (GEO, TCGA, GTEx and IHC) was used to assess the MTDH expression level in TC and adjacent non-carcinomic tissues. The expression of MTDH in TC was analyzed in different pathological subtypes; the pooled standard mean difference (SMD) with a 95% CI and a summary receiver operating characteristic curves (sROC) were drawn based on included datasets.
Immunohistochemistry for MTDH
Evaluation of MTDH protein expression level in TC tissues based on previous reports
We extracted data related to MTDH protein expression levels in TC from published literature. The retrieval strategy was the same as described above. We separated expression levels of the MTDH protein into positive and negative groups that were used to calculated positive and negative rates.
Verified MTDH expression level in TC tissues based on IHC
Two tissue arrays (THC961 and THC1021) were purchased from Fanpu Biotech, Inc. (Guilin, China). Among them, 25 cases were non-carcinomic thyroid tissues, and 125 cases were TC tissues. Another 64 cases were non-carcinomic thyroid tissues, and 46 TC cases were gathered from the Department of Pathology, First Affiliated Hospital of Guangxi Medical University from March 1 to December 1, 2018. Altogether, the current IHC study included 89 non-carcinomic and 171 TC tissues. The Ethical Committee of the First Affiliated Hospital of Guangxi Medical University approved this research. All patients offered written informed consent to use these samples for research.
An IHC analysis of formalin fixed and paraffin-embedded TC tissues and non-carcinomic thyroid tissues was conducted to assess MTDH protein expression level in TC tissues compared with non-carcinomic tissues and to reveal a relationship between MTDH protein expression and a clinicopathologic feature. Experiments were conducted in strict accordance with the manufacturer’s instructions. An MTDH rabbit polyclonal antibody was purchased from Santa Cruz Biotechnology, Inc. (Heidelberg Germany). Two experienced pathologists (Yu-yan Pang and Gang Chen) evaluated the intensity and positive proportion of MTDH staining in a double-blind manner. The MTDH IHC results were independently assessed by the above pathologists in terms of the intensity and positive proportion of staining. The scoring criteria for staining intensity are as follows: 0 (negative), 1 (weak), 2 (medium) and 3 (strong). Positive staining proportion was defined as 1 for <1/4, 2 for 1/4 to 1/2, 3 for 1/2 to 3/4 and 4 for >3/4. The overall score was calculated according to a previously described method [29,30] that was equal to the product of positive percentage and staining intensity.
Confirmation of MTDH protein expression level in TC tissues based on The Human Protein Atlas (THPA)
We downloaded IHC results for MTDH from THPA to confirm the MTDH protein expression level in TC and compared them with the following IHC experimental results. THPA is a pathology tool for examining normal and carcinomic tissues based on antibody proteomics [31].
Western blotting
Western blot analysis was conducted, as described in the previous report [32], with anti-MTDH and β-actin (Proteintech Group, Inc, Wuhan, Hubei, China) antibodies, respectively. For quantification of experimental result, ImageJ software was used to quantify the western blotting bands after background subtraction. The protein expression was normalized relative to GAPDH expression.
Dual luciferase reporter assay
PsiCHECK-MTDH and psiCHECK-MTDH-mut 3’ UTRs were constructed and validated by DNA sequencing. 293 T cells (5 × 10⁴ per well) were seeded in 24-well plates and grown to a density of 70-80%. Cotransfection of cells was performed using 50 nM mimic RNA-136-5p, which was purchased from GenePharma (Shanghai, China), mimic RNA control or a 0.5 µg reporter vector, including either psiCHECK-MTDH1 3’UTRs or psiCHECK-MTDH-1 mut 3’UTRs. After 48 hours of incubation, the ratio of luciferase activity of the Renilla and firefly was determined by the dual luciferase assay according to the instructions. Data is exhibited as the average luciferase ratio of the Renilla and firefly.
Statistical analysis
The difference between groups was analyzed via an independent sample t-test and a one-way ANOVA. All statistical analyses were performed with SPSS 23.0 and GraphPad Prism 7.0. Evaluations of the pooled SMDs with 95% CI using STATA 12.0 in fixed-effects model and random-effects model were performed, while the sROC curves were created using the aforementioned software. The results were regarded as significant with a P<0.05, and all of the data was calculated independently twice.
Results
miR-136-5p exhibits low expression in TC based on various public databases
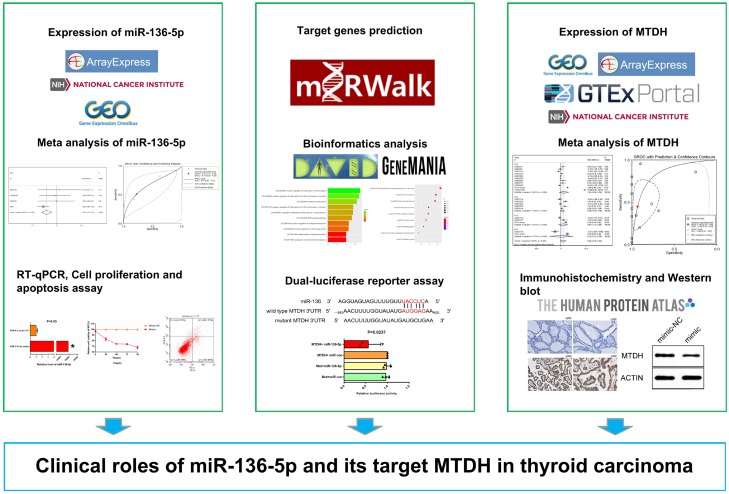
The technical flow chart for this study is shown in Figure 1. After mining public databases, the following microarrays were included in our study: GS40874, GSE73182, GSE62054 and E-MATE-736; these were used to assess the miR-136-5p expression in TC tissues and adjacent non-carcinomic tissues (Figure 2A-C). The results show that miR-136-5p expression was remarkably decreased in TC than in adjacent non-carcinomic tissues. According to data obtained from TCGA, miR-136-5p expression was significantly down-regulated in TC when compared to adjacent non-carcinomic tissues (2.6547±1.4021 vs. 3.4937±0.9704, t=-5.943, P<0.001; Table 1; Figure 2D). Furthermore, we integrated the data from TCGA, ArrayExpress and GEO for a meta-analysis.
Figure 1.
Research flow chart of this study.
Figure 2.
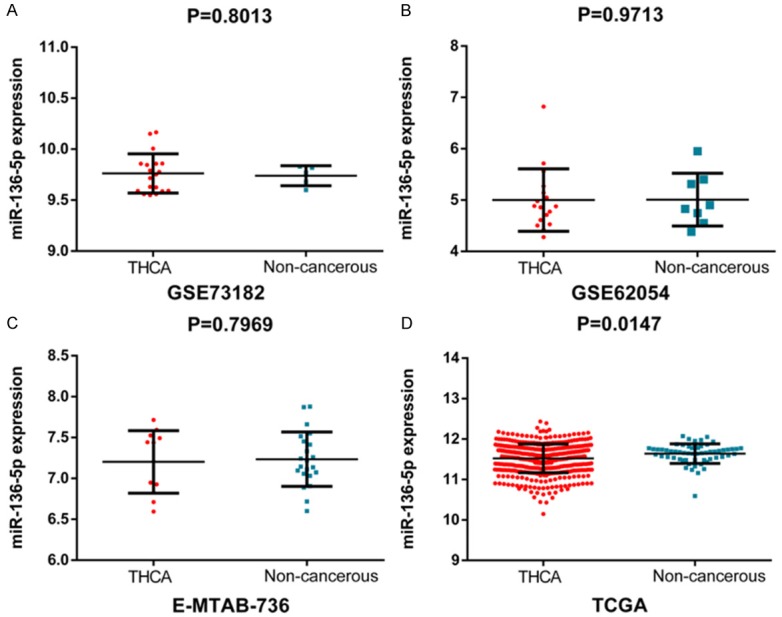
Scatter plots of miR-136-5p expression based on included GEO, ArrayExpress and TCGA. MiR-136-5p expression was analyzed in the included dataset: GSE73182 (A), GSE62054 (B), E-MTAB-736 (C) and TCGA (D).
Table 1.
Relationship between miR-136-5p expression and clinicopathological features from TCGA
| Clinicopathological feature | N | miR-136-5p expression of TCGA database | |||
|---|---|---|---|---|---|
|
| |||||
| M ± SD | T | P | |||
| Tissue | Adjacent non-carcinomic tissues | 59 | 3.4937±0.9704 | -5.943a | <0.001a |
| TC | 495 | 2.6547±1.4021 | |||
| Gender | Male | 131 | 2.5431±1.3393 | -1.011a | 0.312a |
| Female | 358 | 2.6880±1.4296 | |||
| Pathologic tumor grade | Stage I-II | 325 | 2.4396±1.2757 | -4.552a | <0.001a |
| Stage III-IV | 162 | 3.081±1.5513 | |||
| Age (years) | >50 | 207 | 2.8134±1.4702 | 2.193a | 0.029a |
| ≤50 | 282 | 2.5287±1.3433 | |||
| TNM stage | T1+T2 | 303 | 2.4844±1.2966 | -3.179a | <0.001a |
| T3+T4 | 184 | 2.9152±1.5352 | |||
| Lymph node metastasis | No | 221 | 2.4402±1.3914 | 4.123a | <0.001a |
| Yes | 220 | 2.9822±1.3687 | |||
| Distant metastasis | No | 273 | 2.8815±1.4009 | 4.123a | <0.001a |
| Yes | 9 | 2.1385±2.3264 | |||
| Race | White | 320 | 2.7705±1.3877 | 1.225b | 0.295b |
| African American | 27 | 2.3961±1.5205 | |||
| Asian | 52 | 2.9109±1.4001 | |||
Student’s paired t-test;
One-way analysis of variance (ANOVA).
Due to the high heterogeneity in the integrated meta-analyses with a random effects model, a sensitivity analysis was adopted to identify sources of heterogeneity among the included studies (Figure 3A). GSE40874 was eliminated due to its high heterogeneity. The pooled SMD of miR-136-5p was -0.47 (95% CI: -0.70 to -0.23, I2=36.6%, P=0.192, Figure 3B) with the fixed-effects model, and the AUC of sROC was 0.67 (Figure 3C), respectively.
Figure 3.
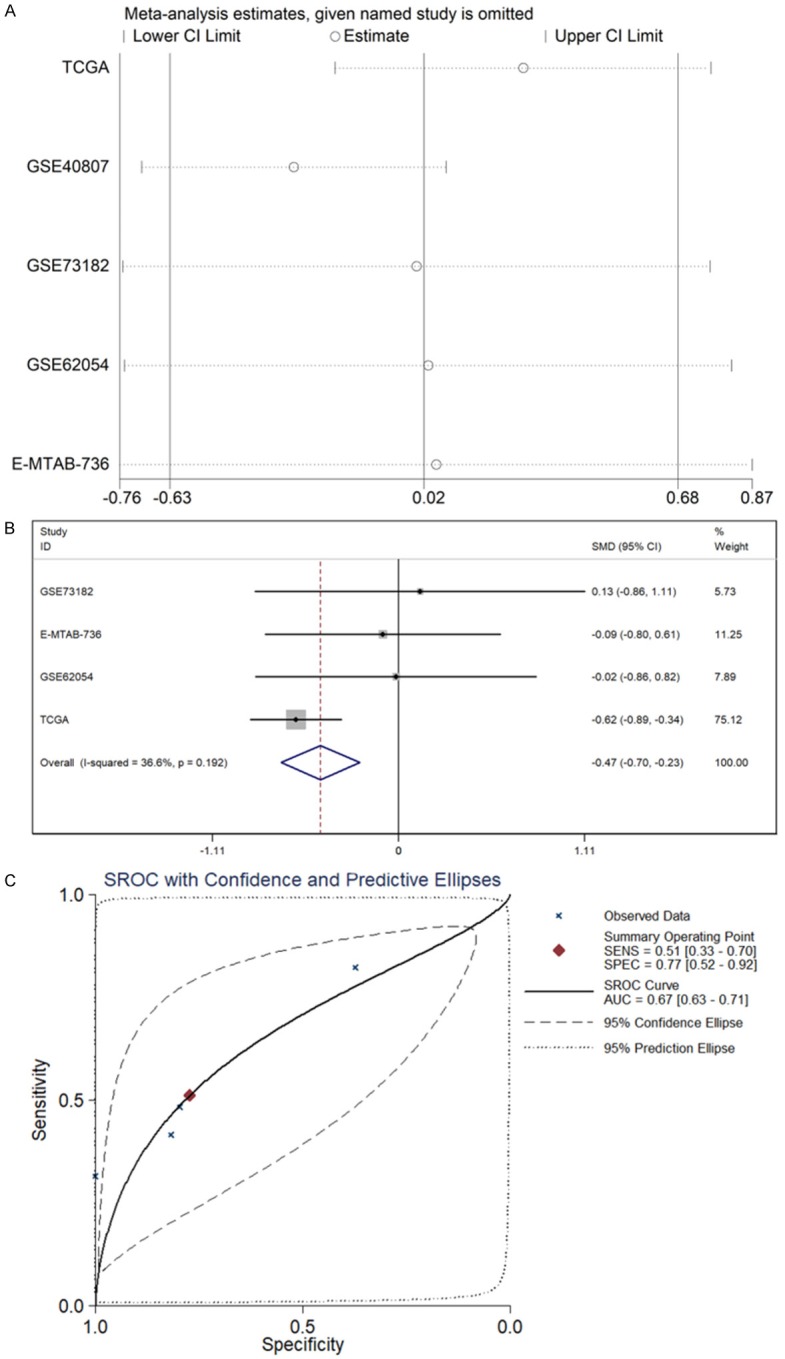
Meta-analysis based on GEO, ArrayExpress and TCGA datasets. A. Sensitivity analysis was also performed to identify sources of heterogeneity among included studies. B. Forest plot of standard mean difference (SMD) manifests that miR-136-5p has a tendency for low expression in TC. C. The area under the curve (AUC) of the summary receiver operating characteristic (sROC) curve was 0.67.
Confirmation of expression and clinical effects of miR-136-5p in TC from TCGA
Data for 495 TC cases and 59 adjacent non-tumor was extracted from the TCGA. To probe the potential role of miR-136-5p in TC oncogenesis, we analyzed the association between miR-136-5p expression and clinical pathological features. Not only were significantly different expression values of miR-136-5p observed in different pathologic tumor grades, but age groups were also distinct (Table 1). With respect to its pathologic tumor grades, miR-136-5p expression levels were low in samples with stages I-II compared to stages III-IV (2.4396±1.2757 vs. 3.081±1.5513, P<0.001, Table 1). Samples from patients less than 50 years old versus greater than 50 years old exhibited downregulated miR-136-5p levels (2.5287±1.3433 vs. 2.8134±1.4702, P=0.029, Table 1). In addition, among different TNM stages, lymph node metastasis and distant metastasis, there was a significantly different expression with the T1+T2 compared to the T3+T4 (2.4844±1.2966 vs. 2.9152±1.5352 P<0.001, Table 1); lymph node metastasis vs. no lymph node metastasis (2.9822±1.3687 vs. 2.4402±1.3914, P<0.001, Table 1) and distant metastasis vs. no distant metastasis were significantly different (2.1385±2.3264 vs. 2.8815±1.4009, P<0.001, Table 1). Nevertheless, miR-136-5p expression levels were not significantly associated with other clinicopathological characteristics.
Overexpression of miR-136-5p inhibits thyroid carcinoma cell proliferation and promotes thyroid carcinoma cell apoptosis
RT-qPCR in B-CPAP indicated that miR-136-5p was up-regulated in cells transfected with miR-136-5p mimic than NC (Figure 4A). MiR-136-5p expression in the mimic group was 19,516 times greater than that of the NC group, while the miR-136-5p inhibitor suppressed the miRNA level to a limited degree (data not shown), which could be due to the basic expression of miR-136-5p in B-CAPB. Hence, in the subsequent tests, we focused on the effects of miR-136-5p mimic. The artificially overexpression of miR-136-5p dramatically inhibited the proliferation of B-CPAP cells (Figure 4B). Furthermore, the cell apoptosis increased remarkably in the miR-136-5p mimic group compared to the NC group (Figure 4C). Collectively, these results demonstrated that miR-136-5p may play a crucial role in the proliferation and apoptosis of TC.
Figure 4.
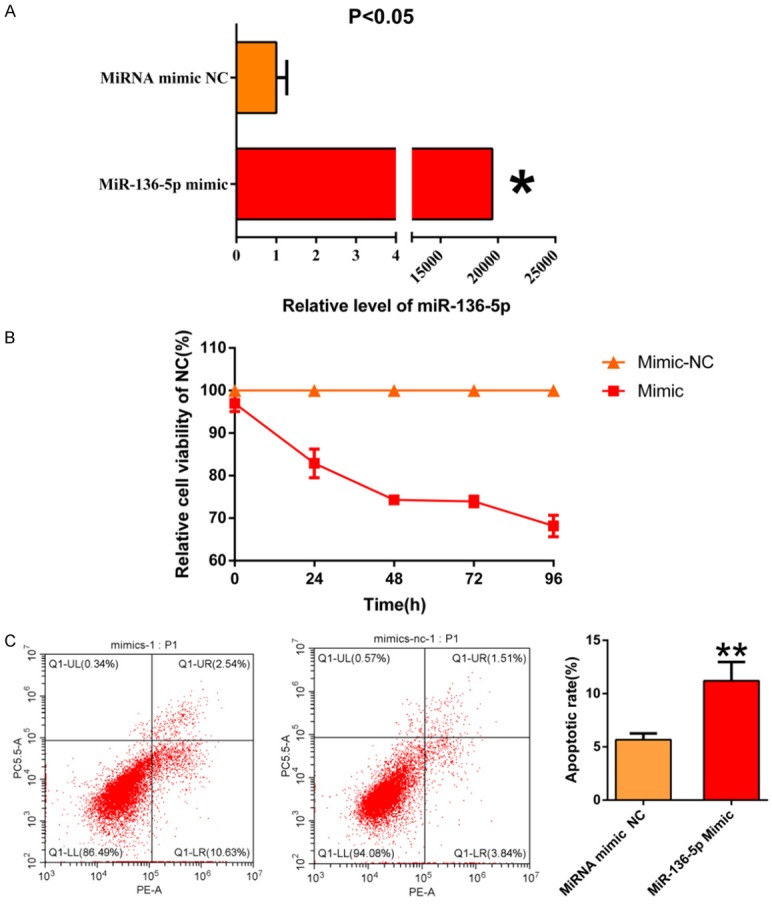
A. MiR-136-5p was remarkably overexpression in B-CPAP cells transfected with miR-136-5p mimic when compared to the negative control (NC). B. MiR-136-5p significantly inhibited TC cells’ proliferation that was transfected with miR-136-5p mimic compared to NC. C. MiR-136-5p promoted TC cells apoptosis transfected with miR-136-5p mimic relative to NC.
Enrichment analyses of potential target genes and PPI network construction analysis
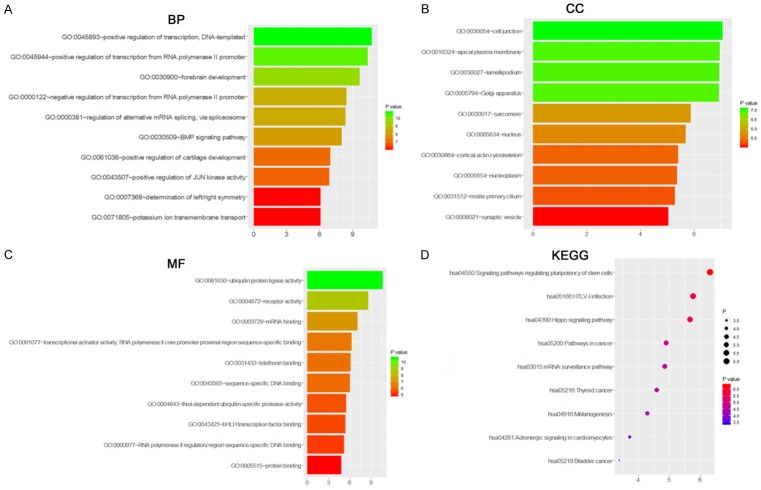
A total of 522 target genes of miR-136-5p were acquired from five online prediction platforms. Subsequently, all target genes were used to identify GO annotations, KEGG and PANTHER pathways by DAVID. From the results, “Positive regulation of transcription, DNA-templated” was the most remarkably assembled biological process (P<0.001; Figure 5A). For cellular components, genes were significantly enriched at cell junction, apical plasma membrane and lamellipodium (P<0.001, Figure 5B). Regarding molecular function, genes were concentrated onubiquitin protein ligase activity (P<0.001, Figure 5C). The PANTHER pathway was primarily enriched in the signaling pathways regulating pluripotency of stem cells, HTLV-I infection and Hippo signaling pathway (P<0.001, Figure 5D). The top 10 terms from each analysis and corresponding description are shown in Tables 2 and 3. Apart from the enrichment analysis, the protein-protein interaction networks of MTDH was established, and the interaction between genes was predicted by GeneMANIA (Figure 6).
Figure 5.
Significantly enriched annotation of GO and KEGG pathway analysis of potential targets of miR-136-5p. Predicted target genes of miR-136-5p are enriched in various biological processes (A), cellular components (B), molecular functions (C) and KEGG (D), which are ranked according to their P values. From the bottom to the top, its significance gradually increases.
Table 2.
GO analysis of target genes of miR-136-5p Category Term (a) BP, (b) CC and (c) MF
| Category | Term | Count | P Value |
|---|---|---|---|
| GOTERM_BP_DIRECT | GO:0045893~positive regulation of transcription, DNA-templated | 28 | 5.80E-04 |
| GOTERM_BP_DIRECT | GO:0045944~positive regulation of transcription from RNA polymerase II promoter | 44 | 7.55E-04 |
| GOTERM_BP_DIRECT | GO:0030900~forebrain development | 7 | 0.001248761 |
| GOTERM_BP_DIRECT | GO:0000122~negative regulation of transcription from RNA polymerase II promoter | 33 | 0.002861675 |
| GOTERM_BP_DIRECT | GO:0000381~regulation of alternative mRNA splicing, via spliceosome | 6 | 0.00305962 |
| GOTERM_BP_DIRECT | GO:0030509~BMP signaling pathway | 8 | 0.00387334 |
| GOTERM_BP_DIRECT | GO:0061036~positive regulation of cartilage development | 4 | 0.007907442 |
| GOTERM_BP_DIRECT | GO:0043507~positive regulation of JUN kinase activity | 5 | 0.008555415 |
| GOTERM_BP_DIRECT | GO:0007368~determination of left/right symmetry | 6 | 0.014739908 |
| GOTERM_BP_DIRECT | GO:0071805~potassium ion transmembrane transport | 9 | 0.014882492 |
| GOTERM_CC_DIRECT | GO:0030054~cell junction | 22 | 0.007473917 |
| GOTERM_CC_DIRECT | GO:0016324~apical plasma membrane | 16 | 0.008063623 |
| GOTERM_CC_DIRECT | GO:0030027~lamellipodium | 11 | 0.008085509 |
| GOTERM_CC_DIRECT | GO:0005794~Golgi apparatus | 35 | 0.008211005 |
| GOTERM_CC_DIRECT | GO:0030017~sarcomere | 5 | 0.017008275 |
| GOTERM_CC_DIRECT | GO:0005634~nucleus | 160 | 0.019236079 |
| GOTERM_CC_DIRECT | GO:0030864~cortical actin cytoskeleton | 5 | 0.023578095 |
| GOTERM_CC_DIRECT | GO:0005654~nucleoplasm | 88 | 0.024092939 |
| GOTERM_CC_DIRECT | GO:0031512~motile primary cilium | 3 | 0.025527525 |
| GOTERM_CC_DIRECT | GO:0008021~synaptic vesicle | 7 | 0.030297585 |
| GOTERM_MF_DIRECT | GO:0061630~ubiquitin protein ligase activity | 15 | 6.24E-04 |
| GOTERM_MF_DIRECT | GO:0004872~receptor activity | 15 | 0.00254895 |
| GOTERM_MF_DIRECT | GO:0003729~mRNA binding | 10 | 0.007236579 |
| GOTERM_MF_DIRECT | GO:0001077~transcriptional activator activity, RNA polymerase II core promoter proximal region sequence-specific binding | 14 | 0.012823117 |
| GOTERM_MF_DIRECT | GO:0031433~telethonin binding | 3 | 0.014208887 |
| GOTERM_MF_DIRECT | GO:0043565~sequence-specific DNA binding | 24 | 0.015403247 |
| GOTERM_MF_DIRECT | GO:0004843~thiol-dependent ubiquitin-specific protease activity | 7 | 0.021887456 |
| GOTERM_MF_DIRECT | GO:0043425~bHLH transcription factor binding | 4 | 0.02375109 |
| GOTERM_MF_DIRECT | GO:0000977~RNA polymerase II regulatory region sequence-specific DNA binding | 12 | 0.027343121 |
| GOTERM_MF_DIRECT | GO:0005515~protein binding | 260 | 0.035097746 |
Table 3.
KEGG and PANTHER pathway analysis of target genes of miR-136-5p
| Category | Term | Count | P Value |
|---|---|---|---|
| KEGG_PATHWAY | hsa04550:Signaling pathways regulating pluripotency of stem cells | 10 | 0.012496448 |
| KEGG_PATHWAY | hsa05166:HTLV-I infection | 14 | 0.018332049 |
| KEGG_PATHWAY | hsa04390:Hippo signaling pathway | 10 | 0.019630251 |
| KEGG_PATHWAY | hsa05200:Pathways in carcinoma | 18 | 0.033399422 |
| KEGG_PATHWAY | hsa03015:mRNA surveillance pathway | 7 | 0.034569481 |
| KEGG_PATHWAY | hsa05216:PTC | 4 | 0.041324385 |
| KEGG_PATHWAY | hsa04916:Melanogenesis | 7 | 0.050937058 |
| KEGG_PATHWAY | hsa04261:Adrenergic signaling in cardiomyocytes | 8 | 0.076249101 |
| KEGG_PATHWAY | hsa05219:Bladder carcinoma | 4 | 0.095868466 |
Figure 6.
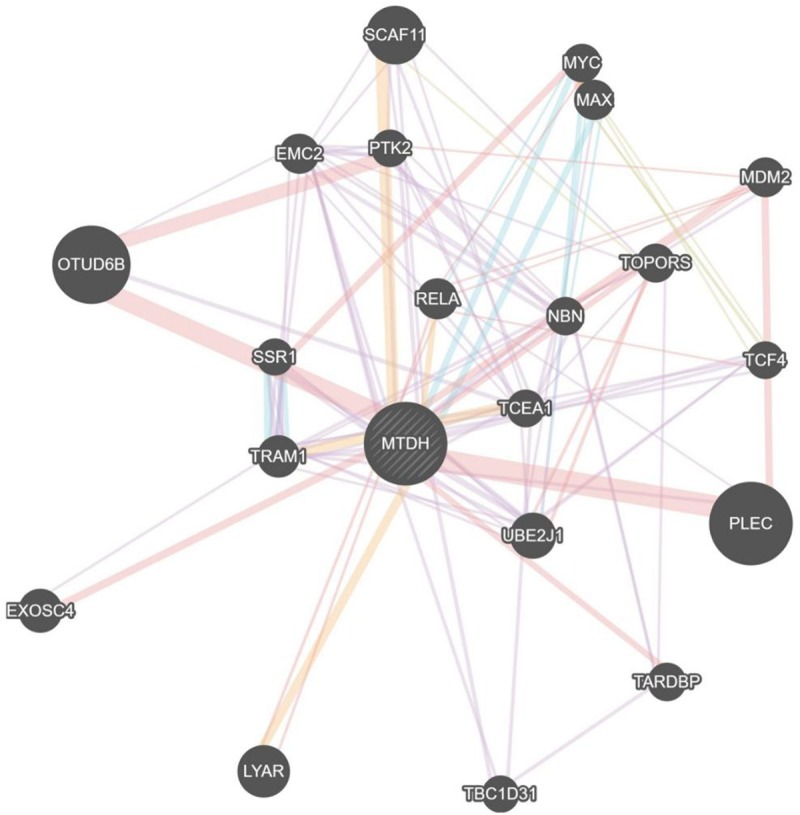
Protein interaction network analysis of MTDH. Each dot represents a protein, and each line represents the interaction between proteins.
MTDH exhibits high expression in TC based on various public databases
In order to ensure the principle of consistent text and figures, we have adjusted the order of the text in this paragraph, as follows: After examining public databases, 510 TC cases and 58 adjacent non-carcinomic tissues from TCGA and 279 normal thyroid tissues from GTEx were merged using R language. Based on the above data, expression of MTDH is increased in TC compared to adjacent non-carcinomic tissues (4.7767±0.8759 vs. 4.7291± 0.5025, t=1.004, P=0.316, Figure 7A). Next, 11 microarrays were included in our study that provided MTDH expression values in TC tissues and adjacent non-carcinomic tissues (Figure 7B-L). According to the results, we found that MTDH expression was higher in TC compared to adjacent non-carcinomic tissues.
Figure 7.
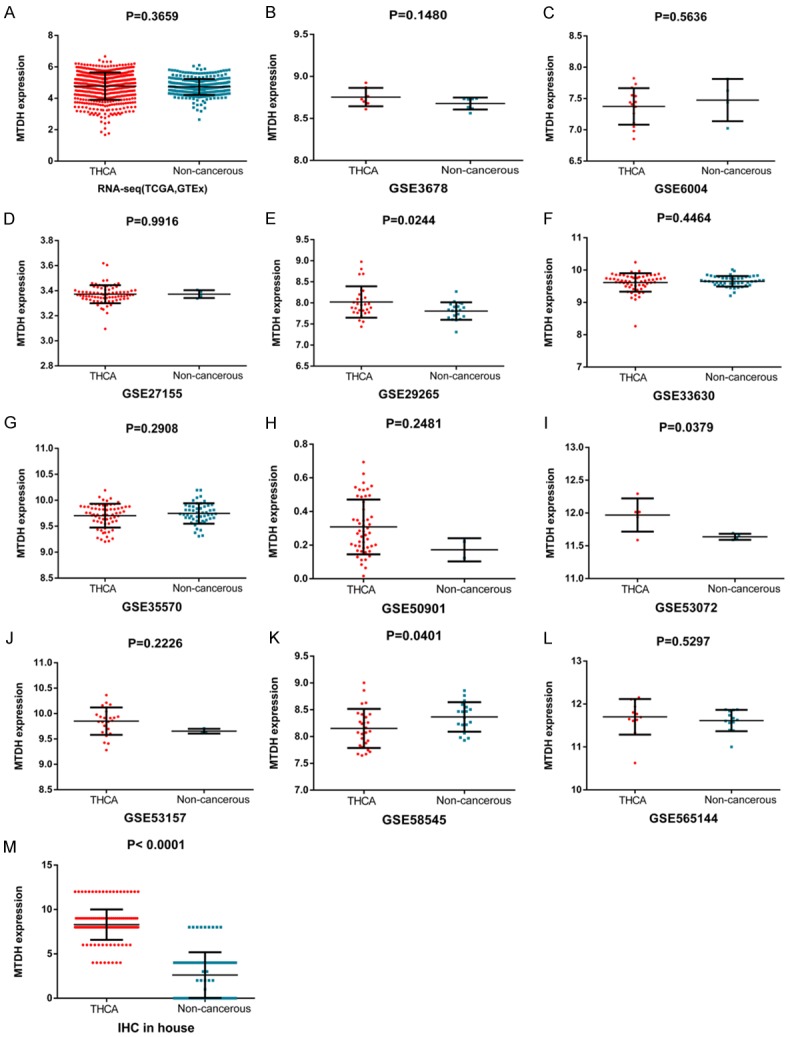
Scatter plots of MTDH based on various public databases and IHC. MTDH expression was analyzed in each included dataset: TCGA and GETx (A), GSE3678 (B), GSE6004 (C), GSE27155 (D), GSE29265 (E), GSE33630 (F), GSE35570 (G), GSE50901 (H), GSE53072 (I), GSE53157 (J), GSE58545 (K), GSE565144 (L) and IHC in-house (M).
MTDH protein expression was notably up-regulated in TC compared with non-carcinomic tissues
Through a literature search, we found that MTDH protein expression was notably up-regulated in TC compared with non-carcinomic tissues. Moreover, Wen-Fang Li et al. revealed that the up-regulation of MTDH in TC was positively associated with TNM staging [33].
IHC results demonstrated that the MTDH protein was positively expressed in 171 TC tissues (100%), which was significantly higher than that in the 89 non-carcinomic tissues (8.292±1.717 vs. 2.618±2.570, P<0.001, Figure 7M). Furthermore, we integrated data from the TCGA, GTEx, GEO and IHC by meta-analyses. Among the results of the subgroup analysis, in PTC, ATC, FTC and MTC, MTDH was a high expression trend in TC compared to adjacent non-carcinomic tissues. In the random-effects model, the pooled SMD of MTDH was 0.94 (95% CI: -0.35 to 2.24, I2=98.8%, P<0.001, Figure 8A), the AUC of sROC was 0.85 (Figure 8B).
Figure 8.
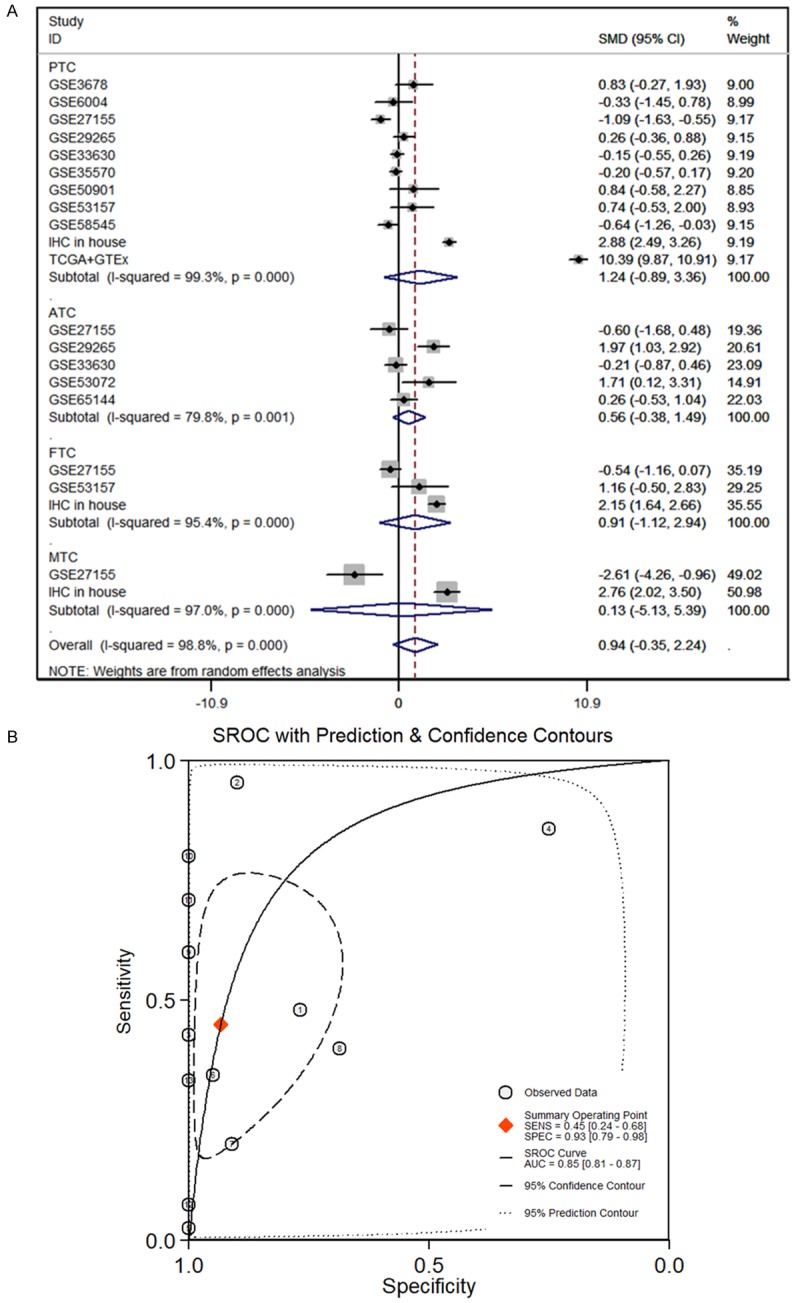
Continuous variable meta-analysis based on GEO, TCGA and GTEx datasets. A. Forest plot of SMD manifests that MDTH has a tendency for overexpression in TC. B. The AUC of sROC curve was 0.85, which manifested MTDH probably plays an important role in distinguishing TC from non-cancerous tissues. PTC: papillary thyroid cancer; ATC: anaplastic thyroid carcinoma; FTC: follicular thyroid carcinoma; MTC: medullary thyroid cancer; TC: thyroid carcinoma.
Clinicopathological information from 171 TC patients and 89 non-carcinomic patients is shown in Table 4. MTDH also exhibited significantly higher expressions in male patients than in female patients (7.478±3.386 vs. 5.959±3.304, P<0.001; Table 4). Meanwhile, significantly lower MTDH expression was observed in patients with T1+T2 compared to patients with T3+T4 (8.037±1.489 vs. 8.677±2.014, P=0.042, Table 4). Furthermore, we proved that the up-regulation of MTDH in TC was remarkably correlated with both lymph node metastasis (P<0.001, Table 4) and distant metastasis (P=0.030, Table 4).
Table 4.
Relationship between MTDH protein expression and Clinicopathological variables based on IHC
| Clinicopathological variables | N | MTDH protein expression | |||
|---|---|---|---|---|---|
|
| |||||
| M±SD | T | P | |||
| Tissue | TC | 171 | 8.292±1.717 | 18.766a | <0.001a |
| Adjacent non-carcinomic tissues | 89 | 2.618±2.570 | |||
| Gender | Male | 67 | 7.478±3.386 | 3.222a | <0.001a |
| Female | 193 | 5.959±3.304 | |||
| Age (years) | ≥50 | 103 | 6.252±3.463 | 0.376a | 0.707a |
| <50 | 157 | 6.414±3.342 | |||
| TNM stage | T1+T2 | 109 | 8.037±1.489 | 2.062a | 0.042a |
| T3+T4 | 62 | 8.677±2.014 | |||
| Lymph node metastasis | No | 129 | 7.705±1.175 | 7.790a | <0.001a |
| Yes | 42 | 10.095±1.872 | |||
| Distant metastasis | No | 170 | 8.271±1.699 | 2.189a | 0.030a |
| Yes | 1 | 12 | |||
Student’s paired t test.
The THPA database demonstrated that the MTDH protein was highly expressed in TC tissues. MTDH was strongly positive in the cytoplasm of TC cells and moderately positive in the cytoplasm of normal thyroid tissues using the antibody CAB068204 (Figure 9A-D). According to the scoring criteria, TC tissues were strongly positive, with a score of 12, while normal thyroid tissues were moderately positive, with a score of 8. Unfortunately, a statistical analysis of IHC could not be performed due to so few cases from THPA. For our immunostaining, positive staining of MTDH in TC exhibited as diffuse or intense staining in the cytoplasm of TC cells, while no MTDH immunoreactivity was detected in pneumocytes of normal thyroid tissues. Immunostaining of TC and normal tissues are shown in images at ×200 and ×400 magnifications (Figure 9E-H). The results from each source consistently indicated that the expression of MTDH is significantly higher in TC tissues compared to non-carcinomic tissues.
Figure 9.
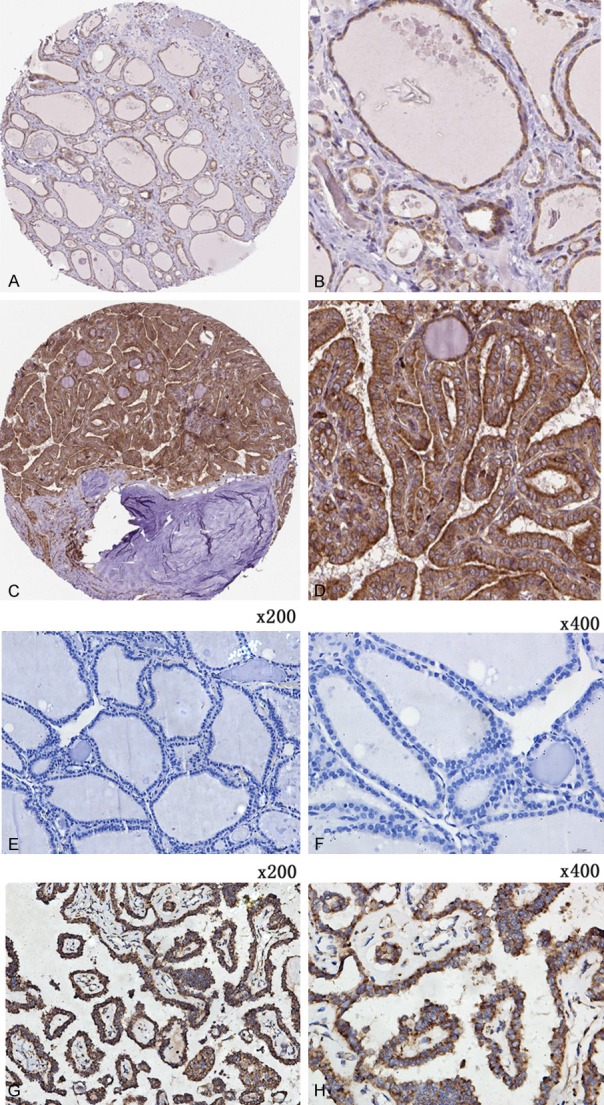
Representative staining pattern of MTDH in TC tissues and non-carcinomic tissues. The immunostaining images (A-D) were acquired from THPA database and the immunostaining images (E-H) were acquired from the First Affiliated Hospital of Guangxi Medical University. (A, B) Moderate positive of MTDH in the cytoplasm of TC cells. (C, D) Strong positive of MTDH in the cytoplasm of TC tissues. (E, F) Non-carcinomic TC tissues showed weak or no MTDH expression. (G, H) MTDH expression was clearly scanned in the cytoplasm of PTC tissues. The magnification of (E and G) is 200× and the magnification of (F and H) is 400×.
The targeted regulation relationship between miR-136-5p and MTDH confirmed by western blot and dual luciferase reporter assay
Western blot indicated that the MTDH protein was more decreased in the miR-136-5p mimic group than in the NC group (Figure 10A). We further determined a binding site for miR-136-5p in the 3-UTR of MTDH mRNA (Figure 10B). The targeting regulatory relationship between them was verified by a dual luciferase reporter assay in HEK-293T cells. We discovered that the luciferase activity of HEK-293T cells cotransfected with psiCHECK-2/MTDH 3’-UTR and miR-136-5p-5p mimics was markedly reduced when compared to the control group (Figure 10C). These results indicate that there is a targeted regulatory relationship between MTDH and miR-136-5p, and MTDH is a direct target for miR-136-5p.
Figure 10.
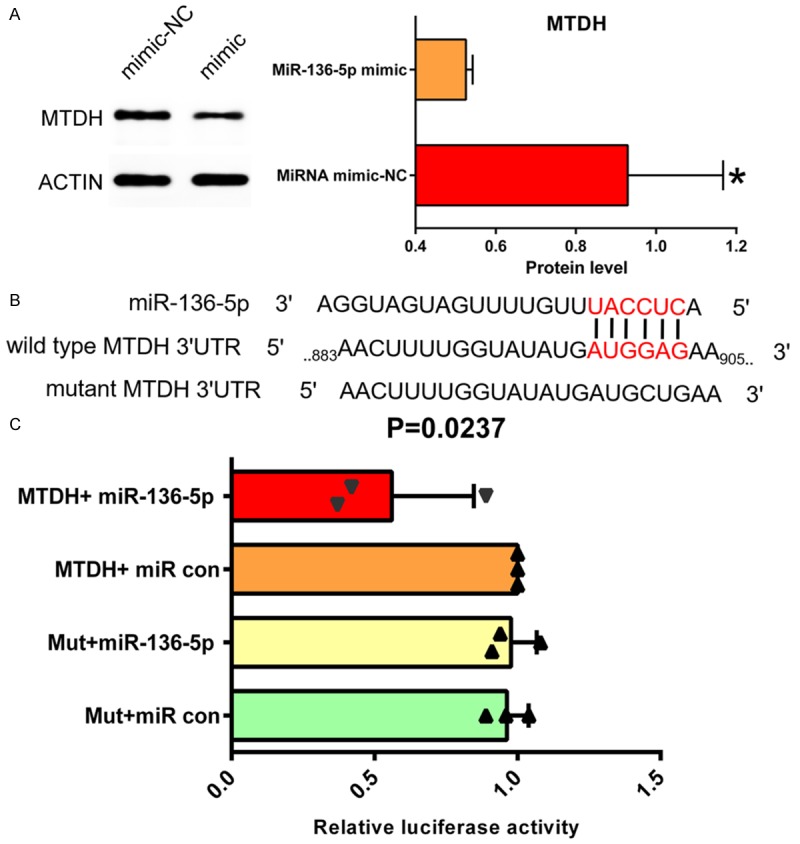
A. Western blot indicated that MTDH protein status was obviously decreased more in the miR-136-5p mimic group than in the NC group. B. Sequence complementary graph of miR-136-5p and MTDH. C. Relative luciferase activity of miR-136-5p and MTDH. P=0.0237.
Discussion
From the present study, we found that miR-136-5p exhibited significantly lower expression in TC compared to non-carcinomic tissues. MTT and apoptosis assay illuminated that the overexpression of miR-136-5p inhibits proliferation of TC cells and promotes tumor cell apoptosis. The in silico target gene prediction, MTDH, was selected by us for further research, based on various public databases; both MTDH mRNA and protein levels were markedly overexpressed in TC than in non-carcinomic tissues. IHC demonstrated the protein expression of MTDH being significantly higher expression in TC when compared with the corresponding control group and western bolt indicated that MTDH protein expression was suppressed by miR-136-5p mimic in B-CPAP cell line. In addition, dual luciferase assay elucidated that miR-136-5p may regulate the tumorigenesis of TC by targeting MTDH. Based on the above results, the miR-136-5p/MTDH axis may play a vital part in modulating TC tumorigenesis.
Recently, increasing evidence has emphasized that microRNA (miRNA) plays a crucial part in the oncogenesis of TC by altering biological behavior in TC. For instance, miR-152-3p, miR-148a, miR-130b and miR-15b are pivotal miRNAs in TC. The upregulation of miR-152-3p suppresses the growth and development of TC [34]. Liu F et al. pointed out that the expression of miR-214 in TC tissues and cells is remarkably lower than in normal tissues and was markedly related with TNM stage. The upregulation of miR-214 markedly reduces proliferation of TC cell lines in vitro and promotes apoptosis and cell cycle arrest [35]. Gao X et al. discovered that miR-129 inhibits MLA expression through combining with its 3’ untranslated region (3’UTR) and inhibiting proliferation and infiltration of TC [36]. In the past study about miR-136-5p in TC, which was studied in only one article, miR-136-5p was differentially expressed in the high invasion compared to the low invasion group [26]. The main limitation of the study was the small sample size. Therefore, the clinical value and the specific biological functions of miR-136-5p in TC still need to be elucidated.
In our current research, we first evaluated miR-136-5p expression in TC from TCGA while assessing the link between miR-136-5p and clinicopathological characteristics. The above results demonstrated that miR-136-5p expression was dramatically down-regulated in TC tissues compared to non-carcinomic tissues. The above results were verified by the data from the GEO and ArrayExpress databases. Moreover, as far as the relation between miR-136-5p expression and clinicopathological parameters, we found that the significant overexpression of miR-136-5p in TC was associated with several clinicopathological characteristics including gender, pathologic tumor grade, age (years), TNM stage, lymph node metastasis and distant metastasis. Through in vitro experiments, we assessed the influence of miR-136-5p on proliferation and apoptosis of TC cells, which implied that miR-136-5p plays a negative role in the cell growth and progression of TC. Therefore, we hypothesized that miR-136-5p inhibits the development and progression of TC.
In order to deeply understand the molecular mechanism of miR-136-5p, we performed GO, KEGG and PANTHER analyses to identify the biological functions of target genes. Based on the results above, we found that the predicted target genes of miR-136-5p may be involved in the positive moderation of transcription, DNA-templated, cell junction and ubiquitin protein ligase activity. In terms of the KEGG analysis, the results displayed predicted target genes of miR-136-5p were notably concentrated on the signaling pathways regulating pluripotency of stem cells and HTLV-I infection and Hippo signaling pathway. The study by Huo and his colleagues found that drugs significantly inhibited tumorigenesis, proliferation and invasion of human breast carcinoma cells via regulating autophagy induced by the HIPPO/YAP signaling pathway [37]. There are multiple targets for miRNA. In addition to those that have already been reported, there may be many other targets of miR-136-5p. 522 target genes were obtained by prediction. In this study, we primarily concentrated on MTDH probing its significance in TC and the targeted regulatory relationship between miR-136-5p and MTDH which was confirmed by a dual luciferase reporter assay. In TC, the down-regulation of miR-136-5p may increase the expression of MTDH, thus promoting the tumorigenesis, which may be achieved through a similar model regulated through the HIPPO/YAP signaling pathway. However, more studies are needed to confirm above assumption.
There are abundant studies reporting that MTDH is a target gene for a variety of carcinomas, including gastric carcinoma [38], osteosarcoma [39], glioma [40,41], hepatocellular carcinoma [42] and lung squamous carcinoma [43]. Recent studies have reported that the overexpression of MTDH is considered a crucial incident in diverse carcinomas. Abnormal expression of MTDH was found in breast cancer, prostate cancer, esophageal tumor and neuroblastoma [44-46]. Robertson et al. demonstrated that MTDH is essential for tumorigenesis and metastasis of hepatocellular carcinoma and activation of NF-kappa B [47]. The above findings shed light on the involvement of MTDH in carcinoma-specific metastasis and are suggestive of the potential application of MTDH in tumor treatment. However, the specific functions and mechanisms of MTDH in TC progression are not fully understood. In our study, expression of MTDH was assessed in TC and normal thyroid tissues. Meanwhile, the upregulation of MTDH was correlated with clinical pathological features including TNM stage, lymph node metastasis and distant metastasis in TC. Meanwhile, our research revealed significantly higher MTDH protein expression in males compared to females. Moreover, multiple databases and IHC demonstrate that MTDH had significantly higher expression in TC compared with non-carcinomic tissues. Western blot indicated that MTDH protein was remarkably decreased in the miR-136-5p mimic group compare with NC group, which is in agreement with the results above. Hence, our study illustrates that MTDH may play a crucial part in the genesis and progression of TC, which is in keeping with other reports. The luciferase reporter assay offers proof that MTDH is directly targeted by miR-136-5p. Based on these findings, we speculated that downregulated miR-136-5p may be conducive to the initiation and development of TC by upregulation of MTDH.
Of course, our research also has some limitations. The amount of collected data is not large enough, and the experimental researches are not sufficient. In addition, the study lacks depth on the relationship and accurate mechanism between miR-136-5p and MTDH. In the future, we hope to further study the relationship and functional mechanism between these two and propose a new scheme for the clinical management of TC.
In summary, we discovered that miR-136-5p had a low expression status and MTDH had a high expression status in TC. The entire study illustrates that miR-136-5p and MTDH may be used as novel molecular biomarkers for the early detection of TC and a prospective therapeutic target. Our data supports the assumption that miR-136-5p may serve as a tumor-inhibition factor in TC tumorigenesis and progression by down-regulating MTDH. These findings enable us to explore additional novel prognostic markers and targets supporting potential therapeutic strategies against TC in the near future.
Acknowledgements
The study was supported by the Fund of Natural Science Foundation of Guangxi, China (2017GXNSFAA198253), Innovation Project of Guangxi Graduate Education (YCSW2018104), Guangxi Medical University Training Program for Distinguished Young Scholars, Medical Excellence Award Funded by the Creative Research Development Grant from the First Affiliated Hospital of Guangxi Medical University, and Guangxi Degree and Postgraduate Education Reform and Development Research Projects, China (JGY2019050), and Guangxi Zhuang Autonomous Region Health and Family Planning Commission Self-financed Scientific Research Project (Z20180979).
Disclosure of conflict of interest
None.
References
- 1.Rusinek D, Chmielik E, Krajewska J, Jarzab M, Oczko-Wojciechowska M, Czarniecka A, Jarzab B. Current advances in thyroid cancer management. Are we ready for the epidemic rise of diagnoses? Int J Mol Sci. 2017;18 doi: 10.3390/ijms18081817. [DOI] [PMC free article] [PubMed] [Google Scholar]
- 2.Gucer H, Mete O. Positivity for GATA3 and TTF-1 (SPT24), and negativity for monoclonal PAX8 expand the biomarker profile of the solid cell nests of the thyroid gland. Endocr Pathol. 2018;29:49–58. doi: 10.1007/s12022-017-9511-6. [DOI] [PubMed] [Google Scholar]
- 3.Ke Z, Liu Y, Zhang Y, Li J, Kuang M, Peng S, Liang J, Yu S, Su L, Chen L, Sun C, Li B, Cao J, Lv W, Xiao H. Diagnostic value and lymph node metastasis prediction of a custommade panel (thyroline) in thyroid cancer. Oncol Rep. 2018;40:659–668. doi: 10.3892/or.2018.6493. [DOI] [PMC free article] [PubMed] [Google Scholar]
- 4.Melo DH, Mamede RCM, Neder L, Silva WA Jr, Barros-Filho MC, Kowalski LP, Pinto CAL, Zago MA, Figueiredo DLA, Jungbluth AA. Expression of cancer/testis antigens MAGE-A, MAGE-C1, GAGE and CTAG1B in benign and malignant thyroid diseases. Oncol Lett. 2017;14:6485–6496. doi: 10.3892/ol.2017.7072. [DOI] [PMC free article] [PubMed] [Google Scholar]
- 5.Baloch ZW, LiVolsi VA. Special types of thyroid carcinoma. Histopathology. 2018;72:40–52. doi: 10.1111/his.13348. [DOI] [PubMed] [Google Scholar]
- 6.Cabanillas ME, McFadden DG, Durante C. Thyroid cancer. Lancet. 2016;388:2783–2795. doi: 10.1016/S0140-6736(16)30172-6. [DOI] [PubMed] [Google Scholar]
- 7.Kitahara CM, Sosa JA. The changing incidence of thyroid cancer. Nat Rev Endocrinol. 2016;12:646–653. doi: 10.1038/nrendo.2016.110. [DOI] [PMC free article] [PubMed] [Google Scholar]
- 8.Roman BR, Morris LG, Davies L. The thyroid cancer epidemic, 2017 perspective. Curr Opin Endocrinol Diabetes Obes. 2017;24:332–336. doi: 10.1097/MED.0000000000000359. [DOI] [PMC free article] [PubMed] [Google Scholar]
- 9.Wei WJ, Zhang GQ, Luo QY. Postsurgical management of differentiated thyroid cancer in China. Trends Endocrinol Metab. 2018;29:71–73. doi: 10.1016/j.tem.2017.10.008. [DOI] [PubMed] [Google Scholar]
- 10.Fu G, Polyakova O, MacMillan C, Ralhan R, Walfish PG. Programmed death - ligand 1 expression distinguishes invasive encapsulated follicular variant of papillary thyroid carcinoma from noninvasive follicular thyroid neoplasm with papillary-like nuclear features. EBioMedicine. 2017;18:50–55. doi: 10.1016/j.ebiom.2017.03.031. [DOI] [PMC free article] [PubMed] [Google Scholar]
- 11.Lin P, He Y, Wen DY, Li XJ, Zeng JJ, Mo WJ, Li Q, Peng JB, Wu YQ, Pan DH, Li HY, Mo QY, Wei YP, Yang H, Chen G. Comprehensive analysis of the clinical significance and prospective molecular mechanisms of differentially expressed autophagy-related genes in thyroid cancer. Int J Oncol. 2018;53:603–619. doi: 10.3892/ijo.2018.4404. [DOI] [PMC free article] [PubMed] [Google Scholar]
- 12.Wang TS, Sosa JA. Thyroid surgery for differentiated thyroid cancer - recent advances and future directions. Nat Rev Endocrinol. 2018;14:670–683. doi: 10.1038/s41574-018-0080-7. [DOI] [PubMed] [Google Scholar]
- 13.Xiong Y, Zhao Q, Liu C, Wang S, Liu Z, Huang T. Prognosis of patients with TX stage differentiated thyroid cancer: propensity scored matching analysis of the SEER database 2004-2013. Am J Transl Res. 2018;10:2004–2014. [PMC free article] [PubMed] [Google Scholar]
- 14.Yakushina VD, Lerner LV, Lavrov AV. Gene fusions in thyroid cancer. Thyroid. 2018;28:158–167. doi: 10.1089/thy.2017.0318. [DOI] [PubMed] [Google Scholar]
- 15.Baloch Z, Mete O, Asa SL. Immunohistochemical biomarkers in thyroid pathology. Endocr Pathol. 2018;29:91–112. doi: 10.1007/s12022-018-9532-9. [DOI] [PubMed] [Google Scholar]
- 16.Sahli ZT, Smith PW, Umbricht CB, Zeiger MA. Preoperative molecular markers in thyroid nodules. Front Endocrinol (Lausanne) 2018;9:179. doi: 10.3389/fendo.2018.00179. [DOI] [PMC free article] [PubMed] [Google Scholar]
- 17.Pishkari S, Paryan M, Hashemi M, Baldini E, Mohammadi-Yeganeh S. The role of microRNAs in different types of thyroid carcinoma: a comprehensive analysis to find new miRNA supplementary therapies. J Endocrinol Invest. 2018;41:269–283. doi: 10.1007/s40618-017-0735-6. [DOI] [PubMed] [Google Scholar]
- 18.Zhao J, Li Z, Chen Y, Zhang S, Guo L, Gao B, Jiang Y, Tian W, Hao S, Zhang X. MicroRNA766 inhibits papillary thyroid cancer progression by directly targeting insulin receptor substrate 2 and regulating the PI3K/Akt pathway. Int J Oncol. 2019;54:315–325. doi: 10.3892/ijo.2018.4615. [DOI] [PubMed] [Google Scholar]
- 19.Pan D, Lin P, Wen D, Wei Y, Mo Q, Liang L, Chen G, He Y, Chen J, Yang H. Identification of down-regulated microRNAs in thyroid cancer and their potential functions. Am J Transl Res. 2018;10:2264–2276. [PMC free article] [PubMed] [Google Scholar]
- 20.Wang J, Yang H, Si Y, Hu D, Yu Y, Zhang Y, Gao M, Zhang H. Iodine promotes tumorigenesis of thyroid cancer by suppressing Mir-422a and up-regulating MAPK1. Cell Physiol Biochem. 2017;43:1325–1336. doi: 10.1159/000481844. [DOI] [PubMed] [Google Scholar]
- 21.Cai P, Mu Y, Olveda RM, Ross AG, Olveda DU, McManus DP. Circulating miRNAs as footprints for liver fibrosis grading in schistosomiasis. EBioMedicine. 2018;37:334–343. doi: 10.1016/j.ebiom.2018.10.048. [DOI] [PMC free article] [PubMed] [Google Scholar]
- 22.Yang X, Chen Y, Chen L. The versatile role of microRNA-30a in human cancer. Cell Physiol Biochem. 2017;41:1616–1632. doi: 10.1159/000471111. [DOI] [PubMed] [Google Scholar]
- 23.Wang Z, Wu Z, Huang P. The function of miRNAs in hepatocarcinogenesis induced by hepatitis B virus X protein (Review) Oncol Rep. 2017;38:652–664. doi: 10.3892/or.2017.5716. [DOI] [PubMed] [Google Scholar]
- 24.Ji D, Qiao M, Yao Y, Li M, Chen H, Dong Q, Jia J, Cui X, Li Z, Xia J, Gu J. Serum-based microRNA signature predicts relapse and therapeutic outcome of adjuvant chemotherapy in colorectal cancer patients. EBioMedicine. 2018;35:189–197. doi: 10.1016/j.ebiom.2018.08.042. [DOI] [PMC free article] [PubMed] [Google Scholar]
- 25.Paladino S, Conte A, Caggiano R, Pierantoni GM, Faraonio R. Nrf2 pathway in age-related neurological disorders: insights into MicroRNAs. Cell Physiol Biochem. 2018;47:1951–1976. doi: 10.1159/000491465. [DOI] [PubMed] [Google Scholar]
- 26.Peng Y, Li C, Luo DC, Ding JW, Zhang W, Pan G. Expression profile and clinical significance of microRNAs in papillary thyroid carcinoma. Molecules. 2014;19:11586–11599. doi: 10.3390/molecules190811586. [DOI] [PMC free article] [PubMed] [Google Scholar]
- 27.Dweep H, Gretz N. miRWalk2.0: a comprehensive atlas of microRNA-target interactions. Nat Methods. 2015;12:697. doi: 10.1038/nmeth.3485. [DOI] [PubMed] [Google Scholar]
- 28.Franz M, Rodriguez H, Lopes C, Zuberi K, Montojo J, Bader GD, Morris Q. GeneMANIA update 2018. Nucleic Acids Res. 2018;46:W60–w64. doi: 10.1093/nar/gky311. [DOI] [PMC free article] [PubMed] [Google Scholar]
- 29.He R, Gao L, Ma J, Peng Z, Zhou S, Yang L, Feng Z, Dang Y, Chen G. The essential role of MTDH in the progression of HCC: a study with immunohistochemistry, TCGA, meta-analysis and in vitro investigation. Am J Transl Res. 2017;9:1561–1579. [PMC free article] [PubMed] [Google Scholar]
- 30.Zhang Y, Li ZY, Hou XX, Wang X, Luo YH, Ying YP, Chen G. Clinical significance and effect of AEG-1 on the proliferation, invasion, and migration of NSCLC: a study based on immunohistochemistry, TCGA, bioinformatics, in vitro and in vivo verification. Oncotarget. 2017;8:16531–16552. doi: 10.18632/oncotarget.14972. [DOI] [PMC free article] [PubMed] [Google Scholar]
- 31.Uhlen M, Bjorling E, Agaton C, Szigyarto CA, Amini B, Andersen E, Andersson AC, Angelidou P, Asplund A, Asplund C, Berglund L, Bergstrom K, Brumer H, Cerjan D, Ekstrom M, Elobeid A, Eriksson C, Fagerberg L, Falk R, Fall J, Forsberg M, Bjorklund MG, Gumbel K, Halimi A, Hallin I, Hamsten C, Hansson M, Hedhammar M, Hercules G, Kampf C, Larsson K, Lindskog M, Lodewyckx W, Lund J, Lundeberg J, Magnusson K, Malm E, Nilsson P, Odling J, Oksvold P, Olsson I, Oster E, Ottosson J, Paavilainen L, Persson A, Rimini R, Rockberg J, Runeson M, Sivertsson A, Skollermo A, Steen J, Stenvall M, Sterky F, Stromberg S, Sundberg M, Tegel H, Tourle S, Wahlund E, Walden A, Wan J, Wernerus H, Westberg J, Wester K, Wrethagen U, Xu LL, Hober S, Ponten F. A human protein atlas for normal and cancer tissues based on antibody proteomics. Mol Cell Proteomics. 2005;4:1920–1932. doi: 10.1074/mcp.M500279-MCP200. [DOI] [PubMed] [Google Scholar]
- 32.Lan D, Wang L, He R, Ma J, Bin Y, Chi X, Chen G, Cai Z. Exogenous glutathione contributes to cisplatin resistance in lung cancer A549 cells. Am J Transl Res. 2018;10:1295–1309. [PMC free article] [PubMed] [Google Scholar]
- 33.Li WF, Wang G, Zhao ZB, Liu CA. High expression of metadherin correlates with malignant pathological features and poor prognostic significance in papillary thyroid carcinoma. Clin Endocrinol (Oxf) 2015;83:572–580. doi: 10.1111/cen.12683. [DOI] [PubMed] [Google Scholar]
- 34.Kang YY, Liu Y, Wang ML, Guo M, Wang Y, Cheng ZF. Construction and analyses of the microRNA-target gene differential regulatory network in thyroid carcinoma. PLoS One. 2017;12:e0178331. doi: 10.1371/journal.pone.0178331. [DOI] [PMC free article] [PubMed] [Google Scholar]
- 35.Liu F, Lou K, Zhao X, Zhang J, Chen W, Qian Y, Zhao Y, Zhu Y, Zhang Y. miR-214 regulates papillary thyroid carcinoma cell proliferation and metastasis by targeting PSMD10. Int J Mol Med. 2018;42:3027–3036. doi: 10.3892/ijmm.2018.3902. [DOI] [PMC free article] [PubMed] [Google Scholar]
- 36.Gao X, Chen Z, Li A, Zhang X, Cai X. MiR-129 regulates growth and invasion by targeting MAL2 in papillary thyroid carcinoma. Biomed Pharmacother. 2018;105:1072–1078. doi: 10.1016/j.biopha.2018.06.050. [DOI] [PubMed] [Google Scholar]
- 37.Chang Y, Li B, Xu X, Shen L, Bai H, Gao F, Zhang Z, Jonas JB. Lentivirus-mediated knockdown of astrocyte elevated gene-1 inhibits growth and induces apoptosis through MAPK pathways in human retinoblastoma cells. PLoS One. 2016;11:e0148763. doi: 10.1371/journal.pone.0148763. [DOI] [PMC free article] [PubMed] [Google Scholar]
- 38.Yu L, Zhou GQ, Li DC. MiR-136 triggers apoptosis in human gastric cancer cells by targeting AEG-1 and BCL2. Eur Rev Med Pharmacol Sci. 2018;22:7251–7256. doi: 10.26355/eurrev_201811_16259. [DOI] [PubMed] [Google Scholar]
- 39.Guo T, Pan G. MicroRNA-136 functions as a tumor suppressor in osteosarcoma via regulating metadherin. Cancer Biomark. 2018;22:79–87. doi: 10.3233/CBM-170970. [DOI] [PubMed] [Google Scholar]
- 40.Wu H, Liu Q, Cai T, Chen YD, Liao F, Wang ZF. MiR-136 modulates glioma cell sensitivity to temozolomide by targeting astrocyte elevated gene-1. Diagn Pathol. 2014;9:173. doi: 10.1186/s13000-014-0173-0. [DOI] [PMC free article] [PubMed] [Google Scholar]
- 41.Yang Y, Wu J, Guan H, Cai J, Fang L, Li J, Li M. MiR-136 promotes apoptosis of glioma cells by targeting AEG-1 and Bcl-2. FEBS Lett. 2012;586:3608–3612. doi: 10.1016/j.febslet.2012.08.003. [DOI] [PubMed] [Google Scholar]
- 42.Zhao J, Wang W, Huang Y, Wu J, Chen M, Cui P, Zhang W, Zhang Y. HBx elevates oncoprotein AEG-1 expression to promote cell migration by downregulating miR-375 and miR-136 in malignant hepatocytes. DNA Cell Biol. 2014;33:715–722. doi: 10.1089/dna.2014.2376. [DOI] [PubMed] [Google Scholar]
- 43.Gao L, Li T, Gan B, Gao X, Xie Z, He R, Mo W, Chi X. MiR-136-5p is involved in the pathogenesis of LUSC through targeting MTDH a study based on RT-qPCR, IHC, public database and dual-luciferase reporter assay. Int J Clin Exp Med. 2018;10:10417–10432. [Google Scholar]
- 44.Kikuno N, Shiina H, Urakami S, Kawamoto K, Hirata H, Tanaka Y, Place RF, Pookot D, Majid S, Igawa M, Dahiya R. Knockdown of astrocyte-elevated gene-1 inhibits prostate cancer progression through upregulation of FOXO3a activity. Oncogene. 2007;26:7647–7655. doi: 10.1038/sj.onc.1210572. [DOI] [PubMed] [Google Scholar]
- 45.Li J, Zhang N, Song LB, Liao WT, Jiang LL, Gong LY, Wu J, Yuan J, Zhang HZ, Zeng MS, Li M. Astrocyte elevated gene-1 is a novel prognostic marker for breast cancer progression and overall patient survival. Clin Cancer Res. 2008;14:3319–3326. doi: 10.1158/1078-0432.CCR-07-4054. [DOI] [PubMed] [Google Scholar]
- 46.Yu C, Chen K, Zheng H, Guo X, Jia W, Li M, Zeng M, Li J, Song L. Overexpression of astrocyte elevated gene-1 (AEG-1) is associated with esophageal squamous cell carcinoma (ESCC) progression and pathogenesis. Carcinogenesis. 2009;30:894–901. doi: 10.1093/carcin/bgp064. [DOI] [PubMed] [Google Scholar]
- 47.Robertson CL, Srivastava J, Siddiq A, Gredler R, Emdad L, Rajasekaran D, Akiel M, Shen XN, Guo C, Giashuddin S, Wang XY, Ghosh S, Subler MA, Windle JJ, Fisher PB, Sarkar D. Genetic deletion of AEG-1 prevents hepatocarcinogenesis. Cancer Res. 2014;74:6184–6193. doi: 10.1158/0008-5472.CAN-14-1357. [DOI] [PMC free article] [PubMed] [Google Scholar]


