Abstract
Most cases of mRCC without an early finding are not candidates for curative therapies, which may be one of the reasons for the poor patient prognosis. Therefore, candidate markers to diagnose the disease and treatment with high efficiency are urgently demanded. Three datasets of mRNA microarray have been assessed to discover DEGs between tissues from metastatic RCC and RCC. 111 DEGs in total were identified according to the expression profile result of genes in the database of GEO. Enrichment analyses for GO and KEGG have been conducted to reveal the interacting activities in the DEGs. A network of PPI has been established to reveal the interconnection among the DEGs, and we selected 10 hub genes. Subsequently, the disease-free survival rate and total survival rate analysis for the hub genes have been carried out with the method of Kaplan-Meier curve. RCC patients with CDH11, COL3A1, COL5A1, COL5A2, COL6A3 and COL11A1 alteration showed worse overall survival. Nonetheless, RCC patients with CDH11, COL3A1, COL5A1, COL5A2 and COL11A1 alteration showed worse disease-free survival. In the Jones Renal dataset, mRNA levels of 10 hub genes were associated with metastasis, and the gene expression level in patients with mRCC was higher than that in patients without metastasis. COL5A1, COL6A3 and COL11A1 expression levels were remarkably related to RCC patient survival rate using UALCAN. COL5A1, COL6A3 and COL11A1 were positively correlated with each other in RCC. These genes have been recognized as genes with clinical relevance, revealing that they might have important roles in carcinogenesis or development of mRCC.
Keywords: Metastatic renal cell carcinoma, expression level profiling results, COL5A1, COL6A3, COL11A1
Introduction
Throughout the world, about 2.4% of all the malignancy cases are renal cell cancer (RCC). The new cancer cases annually was approximately 337,000 in total [1]. Although most patients with RCC present with early stage renal tumors, up to 30% patients suffered from advanced disease when the diagnosis was made, and the 5-year survival rate was about 12% [2]. Renal cell carcinoma (RCC) is considered to be a group of various histopathology types, among which clear cell RCC is most commonly seen [3]. Approximately 25% of the patients would first show up with incurable and advanced disease, and 1/3 of the patients would ultimately develop into metastatic renal cell carcinoma (mRCC) after initial treatment [4]. During the past ten years, the therapy of metastatic RCC has developed significantly using several agents of the family of vascular endothelial growth factor (VEGF) which specifically aimed at tyrosine kinase inhibitors (TKI) [5,6]. Nevertheless, full responses to the therapies hardly appeared (< 1%), and most patients having initial response would go through cancer development [5,7]. Hence, it is of vital importance to reveal the accurate mechanisms working in the process of proliferation, recurrence and carcinogenesis of mRCC.
In the past ten years, microarray method was used widely to measure the genes (DEGs) that expressed differentially, and also bioinformatics approaches have been applied to obtain the data about profile of gene expression which could be downloaded in the database of Gene Expression Omnibus (GEO). In our research, 3 datasets of mRNA microarray from GEO were downloaded and analyzed in order to select DEGs between tissues from mRCC and RCC. In a word, 10 hub genes and 111 DEGs in total were selected, and they might be potential biomarkers for mRCC.
Material and methods
Data of microarray
GEO is open to public and known as a useful genomics database which contains chips, microarrays and high throughout gene expression level data (http://www.ncbi.nlm.nih.gov/geo) [8]. We downloaded 3 gene expression profiles [GSE22541, GSE85258 and GSE105261] from GEO [9-11]. The GSE22541, GSE85258 and GSE105261 dataset contained RCC samples and mRCC samples (24 vs 20, 15 vs 16 and 9 vs 26, respectively) (Table 1). All the data above could be obtained freely on the internet, and there were no human or animal experiments conducted by any authors in this present research.
Table 1.
Statistics of the three microarray databases derived from the GEO database
Identification of DEGs
GEO2R (http://www.ncbi.nlm.nih.gov/geo/geo2r/) is a website allowing interaction and it is a tool which can help users make comparisons between at least two datasets in GEO series in order to select DEGs based on conditions of experiments. The genes that satisfied cutoff standard (P < 0.05 and |log FC (fold change)| ≥ 1) were recognized statistically remarkable as DEGs between RCC and mRCC samples. With the web tool Venn diagram, commonly altered DEGs in the data sets have been integrated (http://bioinformatics.psb.ugent.be/webtools/Venn/).
KEGG pathway and GO enrichment analysis for DEGs
GO is considered to be a main bioinformatics method to note on genes and make analysis on biological process of the genes [12]. As a data repository for exploring biological systems and high-level functions from a wide range of molecular datasets, KEGG is established via high-throughput experiment technology methods [13]. Interacting networks between molecules were visualized on Cytoscape (version 3.6.1), which is a software platform with an open bioinformatic source [14]. The ClueGO (Version 2.5.4) in Cytoscape was a plug-in APP to create and visualize the functionally grouped network of terms/pathways [15]. ClueGO was used to calculate analysis for GO annotation and selections of DEGs in analysis for KEGG pathway enrichment in our research. If P < 0.05, then the result was deemed statistically significant.
Construction of PPI network
We used the online database Search Tool for the Retrieval of Interacting Genes (STRING; http://string-db.org) to predict the protein-protein interaction (PPI) network [16]. We used the STRING database to establish PPI network, and an interacting activity with a total score more than 0.4 was deemed statistically significant. Subsequently, we used Cytoscape software to establish relationship network for protein interaction activities.
Hub genes selection and analysis
CytoHubba is a plugin software of cytoscape, which has been utilized to explore the maximal clique centrality (MCC) in every protein node. The genes ranking top ten were selected as the hub genes in our research. A network of the hub genes and their co-expression genes was analyzed using CytoHubba. The illness-free survival and total survival analyses for hub genes have been conducted with the curve of Kaplan-Meier in cBioPortal (website: http://www.cbioportal.org) platform [17,18]. The relationship of gene expression levels between mRCC patients and RCC patients was analyzed using online database Oncomine (http://www.oncomine.com). Correlations between gene levels and patient survival rates have been featured in UALCAN (website: http://ualcan.path.uab.edu/index.html) [19]. Available cancer genome atlas (TCGA) patient survival rate data have been applied for survival analysis using Kaplan-Meier method and to establish the graphs and tables of overall survival. Using multiple-gene signature, we analyzed its ability to predict survival using TCGA with SurvExpress.
Results
Identification of DEGs in mRCC
After standardization of three gene expression profiles, DEGs (1,912 in GSE22541, 750 in GSE85258 and 2,119 in GSE105261) were identified. We performed Venn analysis in order to obtain the DEG profiles intersection (Figure 1). Ultimately, 111 DEGs in total were remarkably expressed differentially in all 3 groups, among which 72 genes were remarkably upregulated and 39 genes were downregulated between tissues from RCC and metastatic RCC.
Figure 1.
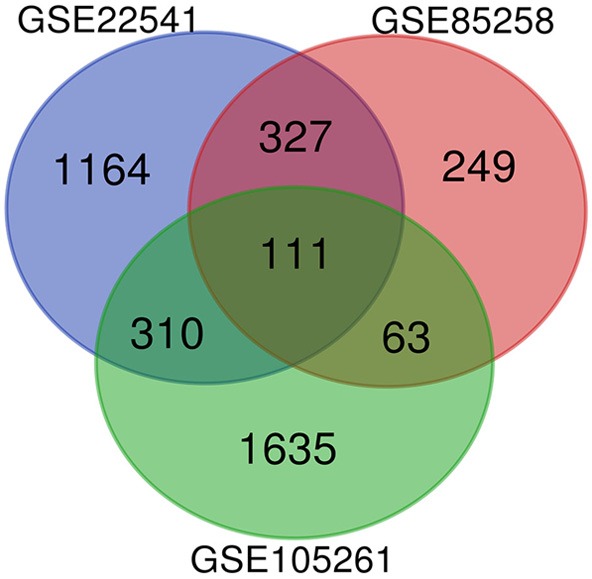
Venn diagram of DEGs (1,912 in GSE22541, 750 in GSE85258 and 2,119 in GSE105261) was used to obtain the DEG profiles intersection. 111 DEGs in total were remarkably expressed differentially in all 3 groups.
KEGG and GO enrichment analyses for DEGs
Results (Table 2) of GO analysis demonstrated that variations in biological process (BP) of DEGs have been dramatically rich in extracellular matrix organization. Variations in cellular component (CC) of DEGs have been mostly rich in banded collagen fibril. Variations in functions of molecular function (MF) mostly aggregated in Extracellular matrix structural constituent conferring tensile strength. Furthermore, the data from analysis of KEGG pathway presented that DEGs mostly aggregated in protein digestion and absorption (Table 2).
Table 2.
Significantly enriched GO terms and KEGG pathways of DEGs
| Category | Term | Description | Count in gene set | P-value |
|---|---|---|---|---|
| BP term | GO:0030198 | Extracellular matrix organization | 18 | 2.11E-11 |
| BP term | GO:0030199 | Collagen fibril organization | 7 | 2.20E-08 |
| BP term | GO:0043200 | Response to amino acid | 7 | 1.01E-05 |
| BP term | GO:0060840 | Artery development | 6 | 2.51E-05 |
| BP term | GO:0071230 | Cellular response to amino acid stimulus | 5 | 4.92E-05 |
| CC term | GO:0098643 | Banded collagen fibril | 6 | 1.03E-11 |
| CC term | GO:0005583 | Fibrillar collagen trimer | 6 | 1.03E-11 |
| CC term | GO:0098644 | Complex of collagen trimers | 6 | 5.86E-10 |
| CC term | GO:0044420 | Extracellular matrix component | 7 | 2.49E-08 |
| CC term | GO:0031258 | Lamellipodium membrane | 3 | 2.02E-03 |
| MF term | GO:0030020 | Extracellular matrix structural constituent conferring tensile strength | 7 | 2.28E-09 |
| MF term | GO:0005539 | Glycosaminoglycan binding | 13 | 2.09E-08 |
| MF term | GO:0048407 | Platelet-derived growth factor binding | 4 | 2.68E-07 |
| MF term | GO:0008201 | Heparin binding | 10 | 4.31E-07 |
| MF term | GO:0019838 | Growth factor binding | 7 | 4.25E-05 |
| KEGG pathway | hsa04974 | Protein digestion and absorption | 7 | 2.76E-06 |
| KEGG pathway | hsa04512 | ECM-receptor interaction | 6 | 2.14E-05 |
| KEGG pathway | hsa05146 | Amoebiasis | 4 | 4.54E-03 |
| KEGG pathway | hsa04933 | AGE-RAGE signaling pathway in diabetic complications | 4 | 5.25E-03 |
| KEGG pathway | hsa05150 | Staphylococcus aureus infection | 3 | 1.20E-02 |
Construction of PPI network and hub gene selection
With STRING tools and Cytoscape, we established the PPI network related to DEGs. 180 edges and 73 nodes in total were included in the network of PPI (Figure 2). The hub genes ranking top ten were identified in the PPI network by connectivity MCC using CytoHubba (Table 3). The data presented that the collagen type I alpha 1 chain (COL1A1) has been the most significant gene and its connectivity MCC = 92330. All the hub genes have an increased expression in mRCC.
Figure 2.
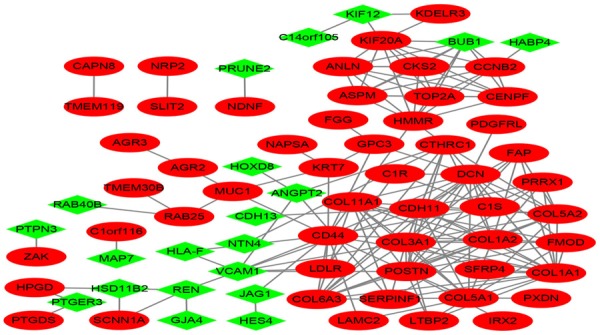
Protein-protein interaction network was constructed with the differentially expressed genes. Red nodes represent upregulated genes, and green nodes represent downregulated genes.
Table 3.
Top ten hub genes with higher MCC of connectivity
| No. | Gene symbol | Full name | Alias | MCC |
|---|---|---|---|---|
| 1 | COL1A1 | Collagen type I alpha 1 chain | OI1; OI2; OI3; OI4; EDSC; EDSARTH1 | 92330 |
| 2 | POSTN | Periostin | PN; OSF2; OSF-2; PDLPOSTN | 92313 |
| 3 | COL1A2 | Collagen type I alpha 2 chain | OI4; EDSCV; EDSARTH2 | 92304 |
| 4 | COL3A1 | Collagen type III alpha 1 chain | EDS4A; EDSVASC; PMGEDSV | 92216 |
| 5 | COL5A2 | Collagen type V alpha 2 chain | EDSC, EDSCL2 | 87120 |
| 6 | DCN | Decorin | CSCD; PG40; PGII; PGS2; DSPG2; SLRR1B | 85807 |
| 7 | COL6A3 | Collagen type VI alpha 3 chain | BTHLM1, DYT27, UCMD1 | 85800 |
| 8 | COL5A1 | Collagen type V alpha 1 chain | EDSC, EDSCL1 | 85706 |
| 9 | CDH11 | Cadherin 11 | CAD11, CDHOB, ESWS, OB, OSF-4 | 46807 |
| 10 | COL11A1 | Collagen type XI alpha 1 chain | CO11A1, COLL6, STL2 | 45384 |
Analysis for hub genes
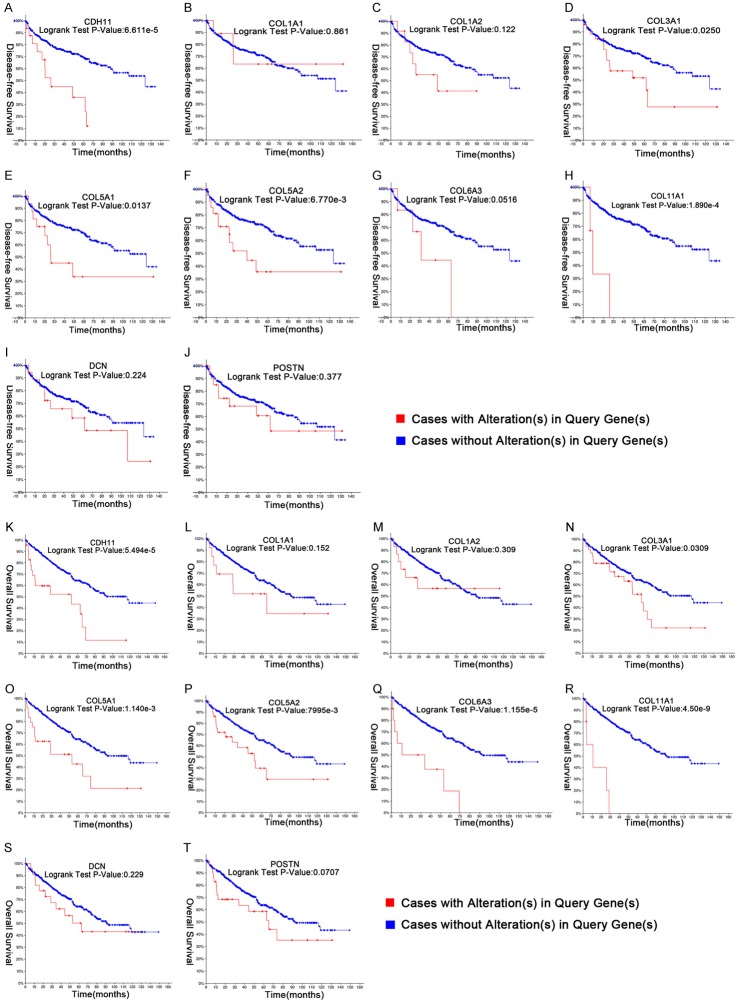
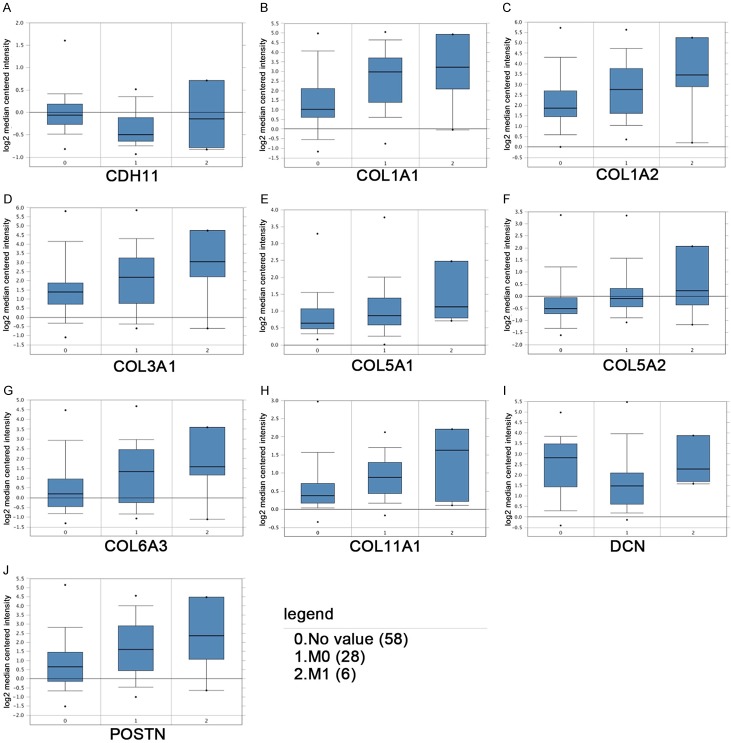
We have listed the symbol of the gene, full name and alias for the hub genes in Table 3. A hub genes network and the co-expression genes have been detected by CytoHubba (Figure 3). Subsequently, the disease-free survival rate and overall survival rate analysis of these hub genes have been conducted with the Kaplan-Meier curve using the online platform in cBioPortal. RCC patients with CDH11, COL3A1, COL5A1, COL5A2 and COL11A1 alteration showed worse disease-free survival (Figure 4A-J). Nonetheless, RCC patients with CDH11, COL3A1, COL5A1, COL5A2, COL6A3 and COL11A1 alteration showed worse overall survival (Figure 4K-T). In the Jones Renal dataset [20], mRNA levels of ten hub genes were associated with metastasis, and the gene expression level in patients with mRCC was higher than that in patients without metastasis (Figure 5). Among CDH11, COL3A1, COL5A1, COL5A2, COL6A3 and COL11A1, analyses for survival rate with Kaplan-Meier method presented that COL5A1, COL6A3 and COL11A1 expression levels were remarkably related to RCC patient survival rate Using UALCAN (Figure 6C, 6E and 6F). So, COL5A1, COL6A3 and COL11A1 have been recognized as genes related to clinical conditions, revealing that the genes might have important roles in the carcinogenesis or development of mRCC.
Figure 3.
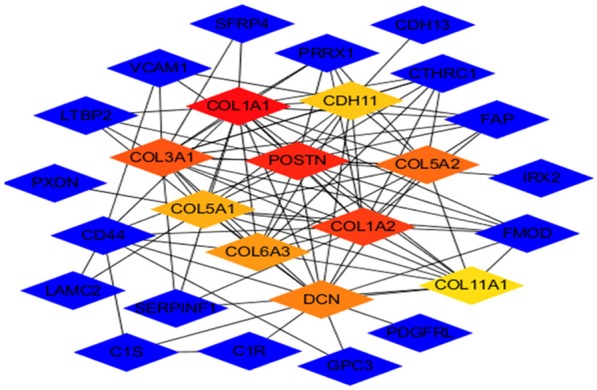
A network of the hub genes and their co-expression genes was analyzed using CytoHubba. Blue nodes represent the co-expression genes, and the others represent hub genes. Red node represents the highest MCC gene, and yellow node represents the lowest MCC gene.
Figure 4.
Disease-free survival and overall survival analyses of hub genes were performed using cBioPortal online platform. RCC patients with CDH11, COL3A1, COL5A1, COL5A2 and COL11A1 alteration showed shorter disease-free survival (P < 0.05) (A-J). Nonetheless, RCC patients with CDH11, COL3A1, COL5A1, COL5A2, COL6A3 and COL11A1 alteration showed shorter overall survival (P < 0.05) (K-T).
Figure 5.
Association between the expression of hub genes and metastasis in the Jones Renal dataset. The hub gene expression level in patients with mRCC was higher than that in patients without metastasis. M0, renal cell carcinoma without metastasis; M1, renal cell carcinoma with metastasis.
Figure 6.
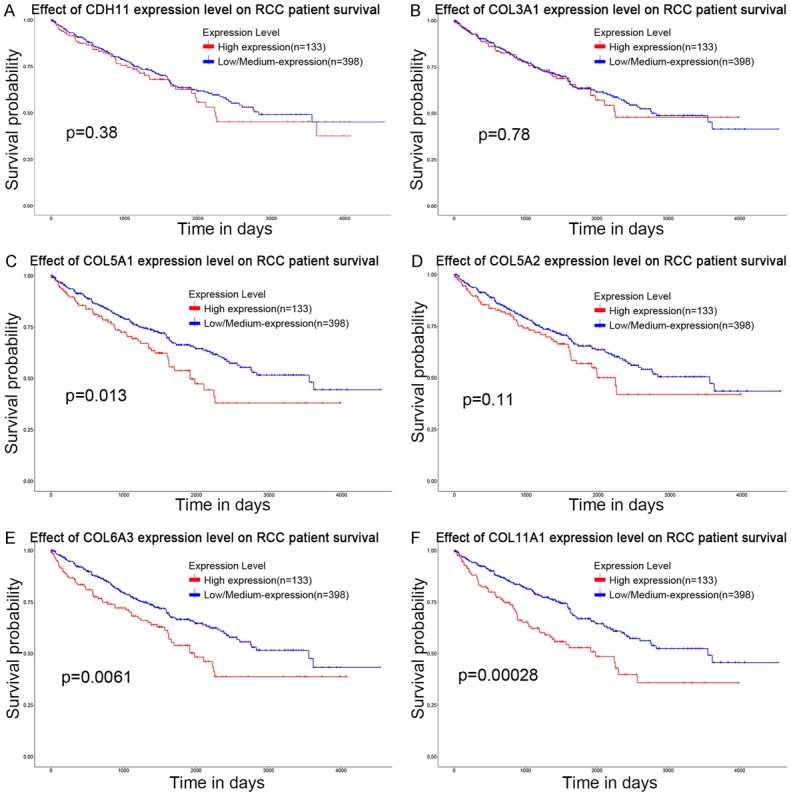
Kaplan-Meier survival plot of hub genes using data of 531 renal cell carcinoma patients from TCGA database. CDH11, COL3A1 and COL5A2 expression levels were not remarkably related to survival rates of RCC patients (A, B, D). COL5A1, COL6A3 and COL11A1 expression levels were remarkably related to survival rates of RCC patients (C, E, F).
Using three-gene signature, we analyzed its ability to predict survival using TCGA with SurvExpress. In our three-gene signature, the prognostic index (PI) of the 415 patients was 0.603-2.479, with the optimal cut-off value of 1.214. PI < 1.214 was divided into low risk group (n = 208), while PI > 1.214 high risk group (n = 207). The analysis demonstrated that a high risk was correlated with high expressions of COL5A1, COL6A3 and COL11A1, shorter survival and worse prognosis, while a low risk was correlated with low expressions of COL5A1, COL6A3 and COL11A1, longed survival and better prognosis in RCC (Figure 7A). Moreover, Kaplan-Meier survival curves showed that patients with a predicted high risk (n = 207) had significantly shorter OS than those with a low risk (n = 208) in RCC (P < 0.05) (Figure 7B). Moreover, we detected the gene expression level of COL5A1, COL6A3 and COL11A1 in high risk and low risk groups in RCC. Our results displayed that the gene expressions of COL5A1, COL6A3 and COL11A1 were higher in high risk group than those in low risk group, and all had significant differences in the three-gene signature (P = 1.02e-91, P = 4.29e-73 and P = 1.85e-34, respectively) (Figure 7C).
Figure 7.
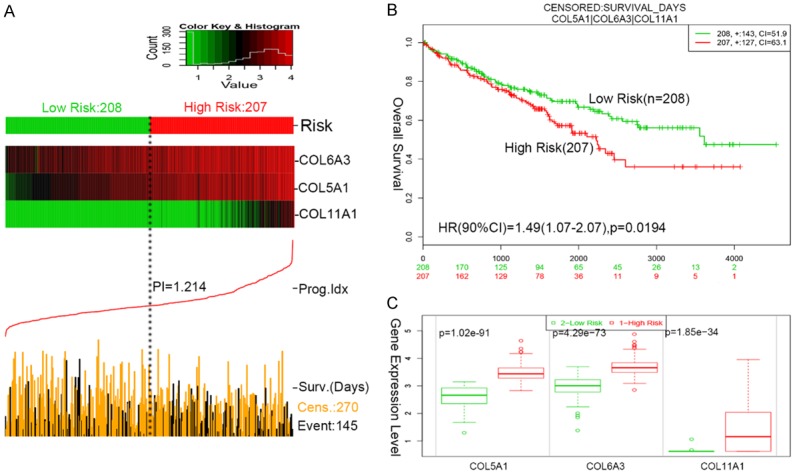
The three-gene signature predicted survival of RCC patients. A. SurvExpress was used to analyze the association of the three-gene signature with the predicted risk, survival and prognosis. B. Kaplan-Meier survival curves showed that patients with a predicted high risk had significantly shorter OS than those with a low risk. C. The gene expression level of COL5A1, COL6A3 and COL11A1 was detected in high risk and low risk groups. The gene expression of COL5A1, COL6A3 and COL11A1 was higher in high risk group than that in low risk group.
We also analyzed the association among COL5A1, COL6A3 and COL11A1 by the LinkedOmics database, and it was found that COL5A1 was both positively correlated with COL6A3 (R = 0.8917, P < 0.05) and COL11A1 (R = 0.684, P < 0.05), and COL6A3 was positively correlated with COL11A1 in RCC (R = 0.6421, P < 0.05) (Figure 8A). Furthermore, it was verified using the GEPIA dataset; surprisingly, COL5A1 was both positively correlated with COL6A3 (R = 0.77, P < 0.05) and COL11A1 (R = 0.67, P < 0.05), and COL6A3 was positively correlated with COL11A1 in RCC (R = 0.47, P < 0.05) (Figure 8B).
Figure 8.
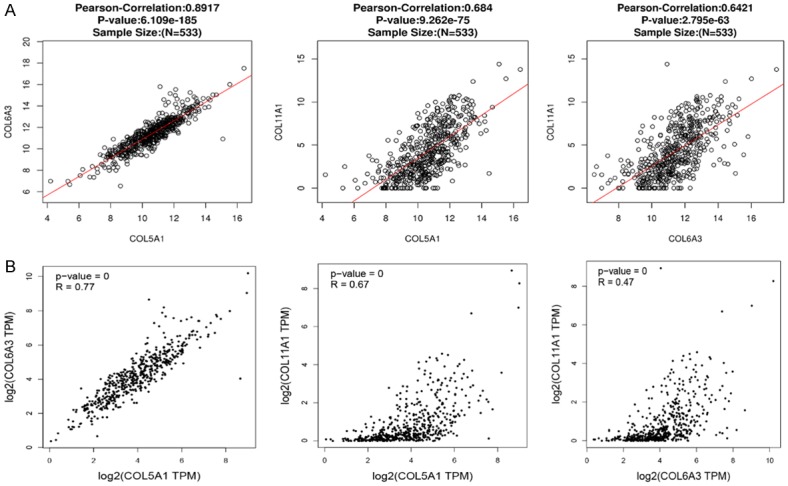
The correction between COL5A1, COL6A3 and COL11A1 in RCC. The correction between COL5A1, COL6A3 and COL11A1 in RCC was analyzed by LinkedOmics (A) and GEPIA (B), and COL5A1, COL6A3 and COL11A1 were positively correlated with each other.
Discussion
The 5-year survival rate of mRCC is no more than 10%, and the aim of the therapy is slowing down the progression of disease and managing symptoms [21]. The treatment of mRCC has changed dramatically using several agents of the TKI which is targeted by the VEGF family. Nevertheless, full responses to the therapies hardly appeared (< 1%), and most patients having initial response would suffer cancer development. Therefore, candidate markers to diagnose the disease and treatment with high efficiency are urgently demanded. Microarray technology gives us a chance to explore the gene variations in mRCC, and it was recognized as a helpful method to identify new biomarkers in other diseases.
In this research, GO enrichment analyses for the DEGs have mainly aggregated in the extracellular matrix organization, collagen fibril organization, banded collagen fibrils, and dramatically aggregated in the KEGG terms protein digestion and absorption. A network of PPI has been established to reveal the interconnection among the DEGs, and we selected 10 hub genes. All of these genes were upregulated in mRCC. RCC patients with CDH11, COL3A1, COL5A1, COL5A2, COL6A3 and COL11A1 alteration showed worse overall survival. Nonetheless, RCC patients with CDH11, COL3A1, COL5A1, COL5A2 and COL11A1 alteration showed worse disease-free survival. According to the method of Kaplan-Meier curve, alteration of all those mentioned genes has been associated with poor prognosis in renal cell carcinoma patients. The mRNA levels of ten hub genes were associated with metastasis, and the gene expression level in patients with mRCC was higher than that in patients without metastasis. Survival analyses using Kaplan-Meier method presented that COL5A1, COL6A3 and COL11A1 expression levels were remarkably related to RCC patient survival rate using UALCAN. Using TCGA with SurvExpress, expression levels of COL5A1, COL6A3 and COL11A1 were higher in high risk group than those in low risk group, and all had significant differences in the three-gene signature. The correction between COL5A1, COL6A3 and COL11A1 in RCC was analyzed by LinkedOmics and GEPIA, and COL5A1, COL6A3 and COL11A1 were positively correlated with each other. COL5A1, COL6A3 and COL11A1 have been recognized as genes with clinical relevance, revealing that they might have important roles in carcinogenesis or development of mRCC.
Upregulation of COL5A1 was discovered to involve in several tumors, including renal carcinoma, breast carcinoma and tongue squamous cell carcinoma [22]. Some researches proposed that upregulation of COL5A1 might be related to the unfavorable prognosis in the carcinomas. Feng et al. [23] showed that after COL5A1 was knocked down, cell proliferation process was remarkably suppressed, cell apoptosis process increased, cell migration ability and invasion capability enhanced in cell experiments, and tumor development was repressed in animal models. Hence, COL5A1 might become a new biomarker for prognosis and a potential therapy target in the RCC management. Yu et al. [24] presented that LMCD1-AS1 exerting oncogenic function is partly related to expression of COL6A3. Liu et al. [25] reported that COL6A3 was clinically relevant to the progression of colorectal malignancy via knocking out COL6A3. COL6A3 might become a potential target and biomarker in prognostic and therapeutic method in colorectal tumor. Arafat H et al. [26] suggested that identifying COL6A3 subtypes as pancreatic ductal adenocarcinoma-specific shed a light on future researches to discover the oncogenic function and the diagnostic capability of the selective splicing activities. Li et al. [27] suggested that COL11A1 might take part in modulating various genes which are involved in cell development process and/or invasion ability. COL11A1 may be a tumor promoter gene in gastric carcinoma and is a potential therapy target in the treatment of cancer. Shen et al. [28] suggested that COL11A1 might be a biomarker in advanced non-small cell lung cancer, and it can work as a predictor for post-surgery resection recurrence. Vázquez-Villa F et al. [29] reported that COL11A1 has been a significant biomarker in indicating tumor development and human malignancy-related stromal cells. Galván JA et al. [30] reported that high COL11A1 expression in colon adenocarcinoma patients has been related to nodal invasion, the progression of metastases to a distant part, and poor Dukes stages.
In our study, except for COL5A1, COL6A3 and COL11A1, we detected other seven hub genes associated with metastatic renal cell carcinoma, including COL1A1, POSTN, COL1A2, COL3A1, COL5A2, DCN, and CDH11. Overexpression of these genes has also been found in the breast, pancreas, colorectal, gastric, bladder and renal cancers, and may be regarded as a valuable diagnostic biomarker, treatment and prognostic marker of tumors [31-34]. COL5A1, COL6A3 and COL11A1 were overexpressed in mRCC compared to RCC tissues. Therefore, alteration in COL5A1, COL6A3 and COL11A1 was involved in worse overall and disease-free survival, indicating that these genes may function as potential prognostic markers and therapy targets in the management of mRCC. Nonetheless, further research is required to discover the function of these genes in mRCC.
Conclusion
This research aimed to select DEGs which might play a part in the carcinogenesis or progression of mRCC. DEGs and hub genes selected in our research give us a chance to have better understanding of the underlying mechanisms in the carcinogenesis and progression of mRCC. COL5A1, COL6A3 and COL11A1 may be key genes for metastatic renal cell carcinoma and might become potential targets in the diagnostic method and treatment of mRCC. Further research is required to discover the function of COL5A1, COL6A3 and COL11A1 in the treatment of mRCC.
Acknowledgements
The authors are deeply thankful to Dr. Junyi Zhang of Affiliated Hospital of Chifeng University (Chifeng, China) for his earnest guidance.
Disclosure of conflict of interest
None.
References
- 1.Siegel RL, Miller KD, Jemal A. Cancer statistics, 2019. CA Cancer J Clin. 2019;69:7–34. doi: 10.3322/caac.21551. [DOI] [PubMed] [Google Scholar]
- 2.Lambea J, Anido U, Etxaniz O, Flores L, Montesa A, Sepulveda JM, Esteban E. The wide experience of the sequential therapy for patients with metastatic renal cell carcinoma. Curr Oncol Rep. 2016;18:66. doi: 10.1007/s11912-016-0553-6. [DOI] [PubMed] [Google Scholar]
- 3.Muglia VF, Prando A. Renal cell carcinoma: histological classification and correlation with imaging findings. Radiol Bras. 2015;48:166–174. doi: 10.1590/0100-3984.2013.1927. [DOI] [PMC free article] [PubMed] [Google Scholar]
- 4.Merza H, Bilusic M. Current management strategy for metastatic renal cell carcinoma and future directions. Curr Oncol Rep. 2017;19:27. doi: 10.1007/s11912-017-0583-8. [DOI] [PubMed] [Google Scholar]
- 5.Tannir NM, Schwab G, Grunwald V. Cabozantinib: an Active novel multikinase inhibitor in renal cell carcinoma. Curr Oncol Rep. 2017;19:14. doi: 10.1007/s11912-017-0566-9. [DOI] [PMC free article] [PubMed] [Google Scholar]
- 6.Motzer RJ, Michaelson MD, Redman BG, Hudes GR, Wilding G, Figlin RA, Ginsberg MS, Kim ST, Baum CM, DePrimo SE, Li JZ, Bello CL, Theuer CP, George DJ, Rini BI. Activity of SU11248, a multitargeted inhibitor of vascular endothelial growth factor receptor and platelet-derived growth factor receptor, in patients with metastatic renal cell carcinoma. J. Clin. Oncol. 2006;24:16–24. doi: 10.1200/JCO.2005.02.2574. [DOI] [PubMed] [Google Scholar]
- 7.Gupta K, Miller JD, Li JZ, Russell MW, Charbonneau C. Epidemiologic and socioeconomic burden of metastatic renal cell carcinoma (mRCC): a literature review. Cancer Treat Rev. 2008;34:193–205. doi: 10.1016/j.ctrv.2007.12.001. [DOI] [PubMed] [Google Scholar]
- 8.Edgar R, Domrachev M, Lash AE. Gene expression omnibus: NCBI gene expression and hybridization array data repository. Nucleic Acids Res. 2002;30:207–210. doi: 10.1093/nar/30.1.207. [DOI] [PMC free article] [PubMed] [Google Scholar]
- 9.Wuttig D, Zastrow S, Fussel S, Toma MI, Meinhardt M, Kalman K, Junker K, Sanjmyatav J, Boll K, Hackermuller J, Rolle A, Grimm MO, Wirth MP. CD31, EDNRB and TSPAN7 are promising prognostic markers in clear-cell renal cell carcinoma revealed by genome-wide expression analyses of primary tumors and metastases. Int J Cancer. 2012;131:E693–704. doi: 10.1002/ijc.27419. [DOI] [PubMed] [Google Scholar]
- 10.Ho TH, Serie DJ, Parasramka M, Cheville JC, Bot BM, Tan W, Wang L, Joseph RW, Hilton T, Leibovich BC, Parker AS, Eckel-Passow JE. Differential gene expression profiling of matched primary renal cell carcinoma and metastases reveals upregulation of extracellular matrix genes. Ann Oncol. 2017;28:604–610. doi: 10.1093/annonc/mdw652. [DOI] [PMC free article] [PubMed] [Google Scholar]
- 11.Nam HY, Chandrashekar DS, Kundu A, Shelar S, Kho EY, Sonpavde G, Naik G, Ghatalia P, Livi CB, Varambally S, Sudarshan S. Integrative epigenetic and gene expression analysis of renal tumor progression to metastasis. Mol Cancer Res. 2019;17:84–96. doi: 10.1158/1541-7786.MCR-17-0636. [DOI] [PMC free article] [PubMed] [Google Scholar]
- 12.Ashburner M, Ball CA, Blake JA, Botstein D, Butler H, Cherry JM, Davis AP, Dolinski K, Dwight SS, Eppig JT, Harris MA, Hill DP, Issel-Tarver L, Kasarskis A, Lewis S, Matese JC, Richardson JE, Ringwald M, Rubin GM, Sherlock G. Gene ontology: tool for the unification of biology. The Gene ontology consortium. Nat Genet. 2000;25:25–29. doi: 10.1038/75556. [DOI] [PMC free article] [PubMed] [Google Scholar]
- 13.Kanehisa M. The KEGG database. Novartis Found Symp. 2002;247:91–101. discussion 101-103, 119-128, 244-152. [PubMed] [Google Scholar]
- 14.Smoot ME, Ono K, Ruscheinski J, Wang PL, Ideker T. Cytoscape 2.8: new features for data integration and network visualization. Bioinformatics. 2011;27:431–432. doi: 10.1093/bioinformatics/btq675. [DOI] [PMC free article] [PubMed] [Google Scholar]
- 15.Bindea G, Mlecnik B, Hackl H, Charoentong P, Tosolini M, Kirilovsky A, Fridman WH, Pages F, Trajanoski Z, Galon J. ClueGO: a Cytoscape plug-in to decipher functionally grouped gene ontology and pathway annotation networks. Bioinformatics. 2009;25:1091–1093. doi: 10.1093/bioinformatics/btp101. [DOI] [PMC free article] [PubMed] [Google Scholar]
- 16.Szklarczyk D, Morris JH, Cook H, Kuhn M, Wyder S, Simonovic M, Santos A, Doncheva NT, Roth A, Bork P, Jensen LJ, von Mering C. The STRING database in 2017: quality-controlled protein-protein association networks, made broadly accessible. Nucleic Acids Res. 2017;45:D362–D368. doi: 10.1093/nar/gkw937. [DOI] [PMC free article] [PubMed] [Google Scholar]
- 17.Gao J, Aksoy BA, Dogrusoz U, Dresdner G, Gross B, Sumer SO, Sun Y, Jacobsen A, Sinha R, Larsson E, Cerami E, Sander C, Schultz N. Integrative analysis of complex cancer genomics and clinical profiles using the cBioPortal. Sci Signal. 2013;6:pl1. doi: 10.1126/scisignal.2004088. [DOI] [PMC free article] [PubMed] [Google Scholar]
- 18.Cerami E, Gao J, Dogrusoz U, Gross BE, Sumer SO, Aksoy BA, Jacobsen A, Byrne CJ, Heuer ML, Larsson E, Antipin Y, Reva B, Goldberg AP, Sander C, Schultz N. The cBio cancer genomics portal: an open platform for exploring multidimensional cancer genomics data. Cancer Discov. 2012;2:401–404. doi: 10.1158/2159-8290.CD-12-0095. [DOI] [PMC free article] [PubMed] [Google Scholar]
- 19.Chandrashekar DS, Bashel B, Balasubramanya SAH, Creighton CJ, Ponce-Rodriguez I, Chakravarthi BVSK, Varambally S. UALCAN: a portal for facilitating tumor subgroup gene expression and survival analyses. Neoplasia. 2017;19:649–658. doi: 10.1016/j.neo.2017.05.002. [DOI] [PMC free article] [PubMed] [Google Scholar]
- 20.Jones J, Otu H, Spentzos D, Kolia S, Inan M, Beecken WD, Fellbaum C, Gu X, Joseph M, Pantuck AJ, Jonas D, Libermann TA. Gene signatures of progression and metastasis in renal cell cancer. Clin Cancer Res. 2005;11:5730–5739. doi: 10.1158/1078-0432.CCR-04-2225. [DOI] [PubMed] [Google Scholar]
- 21.Karner C, Kew K, Wakefield V, Masento N, Edwards SJ. Targeted therapies for previously treated advanced or metastatic renal cell carcinoma: systematic review and network meta-analysis. BMJ Open. 2019;9:e024691. doi: 10.1136/bmjopen-2018-024691. [DOI] [PMC free article] [PubMed] [Google Scholar]
- 22.Wu M, Sun Q, Mo CH, Pang JS, Hou JY, Pang LL, Lu HP, Dang YW, Fang SJ, Tang D, Chen G, Feng ZB. Prospective molecular mechanism of COL5A1 in breast cancer based on a microarray, RNA sequencing and immunohistochemistry. Oncol Rep. 2019;42:151–175. doi: 10.3892/or.2019.7147. [DOI] [PMC free article] [PubMed] [Google Scholar]
- 23.Feng G, Ma HM, Huang HB, Li YW, Zhang P, Huang JJ, Cheng L, Li GR. Overexpression of COL5A1 promotes tumor progression and metastasis and correlates with poor survival of patients with clear cell renal cell carcinoma. Cancer Manag Res. 2019;11:1263–1274. doi: 10.2147/CMAR.S188216. [DOI] [PMC free article] [PubMed] [Google Scholar]
- 24.Yu J, Zhang B, Zhang H, Qi Y, Wang Y, Wang W, Wang Y, Wang Y. E2F1-induced upregulation of long non-coding RNA LMCD1-AS1 facilitates cholangiocarcinoma cell progression by regulating miR-345-5p/COL6A3 pathway. Biochem Biophys Res Commun. 2019;512:150–155. doi: 10.1016/j.bbrc.2019.03.054. [DOI] [PubMed] [Google Scholar]
- 25.Liu W, Li L, Ye H, Tao H, He H. Role of COL6A3 in colorectal cancer. Oncol Rep. 2018;39:2527–2536. doi: 10.3892/or.2018.6331. [DOI] [PMC free article] [PubMed] [Google Scholar]
- 26.Arafat H, Lazar M, Salem K, Chipitsyna G, Gong Q, Pan TC, Zhang RZ, Yeo CJ, Chu ML. Tumor-specific expression and alternative splicing of the COL6A3 gene in pancreatic cancer. Surgery. 2011;150:306–315. doi: 10.1016/j.surg.2011.05.011. [DOI] [PMC free article] [PubMed] [Google Scholar]
- 27.Li A, Li J, Lin J, Zhuo W, Si J. COL11A1 is overexpressed in gastric cancer tissues and regulates proliferation, migration and invasion of HGC-27 gastric cancer cells in vitro. Oncol Rep. 2017;37:333–340. doi: 10.3892/or.2016.5276. [DOI] [PubMed] [Google Scholar]
- 28.Shen L, Yang M, Lin Q, Zhang Z, Zhu B, Miao C. COL11A1 is overexpressed in recurrent non-small cell lung cancer and promotes cell proliferation, migration, invasion and drug resistance. Oncol Rep. 2016;36:877–885. doi: 10.3892/or.2016.4869. [DOI] [PubMed] [Google Scholar]
- 29.Vázquez-Villa F, García-Ocaña M, Galván JA, García-Martínez J, García-Pravia C, Menéndez-Rodríguez P, González-del Rey C, Barneo-Serra L, de Los Toyos JR. COL11A1/(pro)collagen 11A1 expression is a remarkable biomarker of human invasive carcinoma-associated stromal cells and carcinoma progression. Tumour Biol. 2015;36:2213–2222. doi: 10.1007/s13277-015-3295-4. [DOI] [PubMed] [Google Scholar]
- 30.Galván JA, García-Martínez J, Vázquez-Villa F, García-Ocaña M, García-Pravia C, Menéndez-Rodríguez P, González-del Rey C, Barneo-Serra L, de los Toyos JR. Validation of COL11A1/procollagen 11A1 expression in TGF-beta1-activated immortalised human mesenchymal cells and in stromal cells of human colon adenocarcinoma. BMC Cancer. 2014;14:867. doi: 10.1186/1471-2407-14-867. [DOI] [PMC free article] [PubMed] [Google Scholar]
- 31.Chen PF, Wang F, Nie JY, Feng JR, Liu J, Zhou R, Wang HL, Zhao Q. Co-expression network analysis identified CDH11 in association with progression and prognosis in gastric cancer. Onco Targets Ther. 2018;11:6425–6436. doi: 10.2147/OTT.S176511. [DOI] [PMC free article] [PubMed] [Google Scholar]
- 32.Yuan L, Shu B, Chen L, Qian K, Wang Y, Qian G, Zhu Y, Cao X, Xie C, Xiao Y, Wang X. Overexpression of COL3A1 confers a poor prognosis in human bladder cancer identified by co-expression analysis. Oncotarget. 2017;8:70508–70520. doi: 10.18632/oncotarget.19733. [DOI] [PMC free article] [PubMed] [Google Scholar]
- 33.Oh HJ, Bae JM, Wen XY, Cho NY, Kim JH, Kang GH. Overexpression of POSTN in tumor stroma is a poor prognostic indicator of colorectal cancer. J Pathol Transl Med. 2017;51:306–313. doi: 10.4132/jptm.2017.01.19. [DOI] [PMC free article] [PubMed] [Google Scholar]
- 34.Chakravarthy D, Munoz AR, Su A, Hwang RF, Keppler BR, Chan DE, Halff G, Ghosh R, Kumar AP. Palmatine suppresses glutamine-mediated interaction between pancreatic cancer and stellate cells through simultaneous inhibition of survivin and COL1A1. Cancer Lett. 2018;419:103–115. doi: 10.1016/j.canlet.2018.01.057. [DOI] [PMC free article] [PubMed] [Google Scholar]


