

ABSTRACT
Background
Greater increase in 24-h energy expenditure (24EE) during overfeeding and smaller decrease in 24EE during fasting (“spendthrift” metabolic phenotype) are associated with more weight loss during sustained caloric restriction in overweight subjects.
Objectives
The aim of this study was to investigate whether these acute metabolic responses can also predict weight gain during sustained overfeeding in lean individuals.
Methods
Seven lean men participated in this study. Prior to overfeeding, 24EE responses to fasting and 200% normal-protein overfeeding were measured in a whole-room indirect calorimeter. Volunteers underwent 6 wk of 150% low-protein (2%) overfeeding followed by another wk of weight-maintaining diet, during which 24EE was revaluated. Body composition, 24EE, and various hormone concentrations, including fibroblast growth factor 21 (FGF21), were assessed at baseline, at wk 1, 3, and 6 of the overfeeding period, and 1 wk following overfeeding through the use of dual-energy X-ray absorptiometry, indirect calorimetry, and ELISA. Cumulative energy surplus was calculated from 24EE, daily physical activity, and direct measurements of calories of nutrient intake, feces, and urine by bomb calorimetry.
Results
The average weight gain during 6 wk of low-protein overfeeding was 3.8 kg (6.1%, min: +2.5%, max: +8.0%). During 24-h fasting at baseline, 24EE decreased on average (mean ± SD) by 158 ± 81 kcal/d (P = 0.007). Subjects with less 24EE decrease during fasting (more metabolically spendthrift individuals) gained less weight (r = −0.84, P = 0.03), less fat mass (r = −0.81, P = 0.049), and stored less calories (r = −0.91, P = 0.03) during overfeeding. Following overfeeding, increased 24EE above requirements for achieved body size was associated with less weight and fat mass gain (r = −0.78, P = 0.04) and with the increase in 24EE during 200% normal-protein overfeeding measured at baseline (r = 0.91, P = 0.005). Serum FGF21 concentrations increased up to 44-fold during overfeeding (P < 0.0001).
Conclusions
Low-protein overfeeding may be an important tool to identify metabolic phenotypes (spendthrift compared with thrifty) that characterize susceptibility to weight gain. This trial was registered at clinicaltrials.gov as NCT00687115.
Keywords: metabolic phenotype, obesity, FGF21, adaptive thermogenesis, metabolic adaptation, low-protein overfeeding, leptin, bomb calorimetry, thrifty, spendthrift
Introduction
We have previously demonstrated that overweight individuals can be classified as either a “thriftier” or a more “spendthrift” metabolic phenotype according to their 24-h energy expenditure (24EE) response to fasting, which predicts the extent of weight loss during caloric restriction (1). Further, in healthy, weight-stable individuals, short-term energy expenditure (EE) responses to 24-h fasting and acute (200%) overfeeding were related such that individuals with a smaller increase in 24EE during overfeeding had a greater decrease in 24EE with fasting (“thriftier” metabolic phenotype), whereas those with the greatest increase in 24EE upon overfeeding tended to have the smallest decrease in 24EE upon fasting (“more spendthrift” metabolic phenotype) (2, 3). Importantly, a smaller decrease in 24EE with fasting at baseline predicted less weight gain after 6 mo in free-living conditions (2). In an inpatient, 6-wk overfeeding study, we sought to investigate whether we could identify such phenotypes in lean, and hence more obesity-resistant, individuals by measuring their 24EE during fasting, and then relate it to weight gain during sustained overfeeding. We overfed participants with a low-protein diet that increases the cost of weight gain but also amplifies individual differences in metabolic efficiency compared with normal-protein diets (4). Thus, low-protein overfeeding may also amplify the individual susceptibility to weight gain (2, 4, 5). Additionally, our group showed that the metabolic phenotype can be characterized by the response of fibroblast growth factor 21 (FGF21) during 24-h low-protein overfeeding (6). In our study, we also included measurements of sleeping EE, diet-induced thermogenesis (DIT), and spontaneous physical activity (SPA), because overfeeding studies have shown that these 24EE components are highly influenced by dietary interventions (7–10).
In a second part of this study, we wanted to explore the relations of overfeeding-induced changes in EE and weight gain. Overfeeding studies demonstrate large intraindividual variations in weight gain, despite the same caloric intake (11–17). The changes in EE that occur during long-term overfeeding might explain these differences in weight gain. Some studies suggest that certain individuals can increase their thermogenesis above that needed to maintain achieved weight during overfeeding (14). This process of excess dissipation of energy during a period of positive energy balance is independent of body size and is often termed “adaptive thermogenesis” (14, 18, 19). Some studies have attributed the EE changes with overfeeding to changes in nonexercise activity thermogenesis or voluntary physical activity (20, 21). Another study showed that protein intake is a determinant of adaptive thermogenesis during 8 wk of daily overfeeding (11). Other researchers claim the effects of adaptive thermogenesis are more pronounced during underfeeding (22). To investigate the adaptive metabolic response to low-protein overfeeding, in this study we measured 24EE both during and following a 6-wk overfeeding period to assess the extent of changes in 24EE above that predicted by changes in body composition, a phenomenon called “metabolic adaptation” to weight gain (23, 24).
Methods
Subjects
The primary aim of this study was to investigate if EE responses to 24 h of fasting and 200% overfeeding would predict weight gain in lean individuals randomly assigned to consume either a long-term normal-protein or a low-protein overfeeding diet. This study has another arm, in which the same association was analyzed during a long-term caloric restriction diet (2). A secondary goal was to determine if hormonal markers were related to EE changes and variability in weight gain with overfeeding. Due to low recruitment and to the strong associations found in our previous study investigating these phenotypes during caloric restriction (1), we elected to analyze results in the 7 participants who had completed the low-protein overfeeding arm.
Overall, 28 individuals (26 men, 2 women) were screened for this study between 2009 and 2016. Ten healthy (based on physical examination and laboratory analysis, electrocardiography, and psychological assessment) and lean (BMI < 25 kg/m2) volunteers were enrolled in the study and admitted to our inpatient unit. The study flow chart is presented in Supplemental Figure 1. Use of nicotine or illicit drugs was excluded by screening tests at admission, and none of the subjects were taking any medication. Following admission, diabetes was ruled out by a 3-h, 75-g oral glucose tolerance test (after a 12-h overnight fast) according to the American Diabetes Association diagnostic criteria (25). Two subjects completed the normal-protein overfeeding arm but were not included in this analysis. One subject was discharged home after 5 d of overfeeding because of personal reasons. In total, 7 volunteers (4 whites, 2 Native American, and 1 Hispanic) completed the low-protein overfeeding arm and were included in this analysis. General, anthropometric, and EE characteristics of the study population are provided in Table 1. Subjects were admitted for 76 ± 4 d (mean ± SD) to the inpatient unit of the Obesity and Diabetes Clinical Research Section of the National Institute of Diabetes and Digestive and Kidney Diseases in Phoenix, AZ, where they were limited to primarily sedentary activity for the duration of the study. The research unit was kept at room temperature. Subjects were weighed in the same clothes daily upon first awakening and were asked not to exercise for the duration of their stay. Volunteers were fully informed of the nature and purpose of the study, and written informed consent was obtained before admission. The experimental protocol was approved by the institutional review board of the National Institute of Diabetes and Digestive and Kidney Diseases.
TABLE 1.
Baseline characteristics of study participants1
| Mean ± SD (range) | |
|---|---|
| Age, y | 31 ± 12 (18, 50) |
| Body composition measures | |
| Height, cm | 175 ± 7 (165, 185) |
| Body weight, kg | 62.3 ± 3.1 (57.2, 65.4) |
| BMI, kg/m2 | 20.5 ± 1.6 (17.8, 22.7) |
| Body fat, % | 17.4 ± 5.0 (7.1, 21.4) |
| FM, kg | 9.5 ± 3.4 (4.3, 13.9) |
| FFM, kg | 52.8 ± 2.4 (48.5, 55.6) |
| Energy expenditure measures | |
| 24EE during energy balance, kcal/d | 2569 ± 25 (2527, 2593) |
| 24-h respiratory quotient during energy balance, ratio | 0.85 ± 0.04 (0.77, 0.89) |
| Baseline 24EE decrease during fasting, kcal/d | −158 ± 90 (−253, −4) |
| Baseline 24EE increase during 200% overfeeding, kcal/d | 201 ± 54 (125, 285) |
| Baseline sleeping EE change during fasting, kcal/d | −34 ± 60.5 (−140, 39) |
| Baseline sleeping EE change during 200% overfeeding, kcal/d | 201 ± 115 (28, 348) |
| DIT during energy balance, kcal/d | 158 ± 90 (4, 253) |
| DIT during 200% overfeeding, kcal/d | 371 ± 101 (252, 538) |
| SPA during fasting, % | 4.3 ± 3.0 (0.4, 9.1) |
| SPA during energy balance, % | 5.4 ± 5.4 (0.7, 16.4) |
| SPA during 200% overfeeding, % | 4.8 ± 4.0 (0.7, 12.5) |
| Energy intake measures | |
| Daily intake at baseline, kcal | 2534 ± 207 (1778, 2661) |
| Daily intake during low-protein overfeeding,2 kcal | 3942 ± 248 (2951, 4712) |
| Additional energy intake during overfeeding,3 % | 51 ± 3.6 (44.8, 55.8) |
| Relative protein intake during overfeeding, g/kg | 0.36 ± 0.05 (0.24, 0.45) |
| Glycemic and hormonal measures | |
| Fasting glucose, mg/dL | 91 ± 3.6 (87, 97) |
| 2-h glucose during OGTT, mg/dL | 94 ± 23.6 (67, 130) |
| Fasting insulin, μIU/mL | 5.4 ± 1.8 (3.5, 8.5) |
| 2-h insulin during OGTT, μIU/mL | 28.6 ± 21.7 (5, 60) |
| Serum fT3, pg/mL | 3.8 ± 1.1 (2.6, 5.7) |
| Serum fT4, pg/mL | 1.3 ± 0.3 (1.0, 1.8) |
| Serum FGF21, pg/mL | 148 ± 119 (41.9, 386.3) |
| Serum leptin, ng/mL | 2.56 ± 1.61 (0.14, 5.20) |
| Urinary epinephrine, μg/24 h | 4.9 ± 3.8 (1.4, 12.5) |
| Urinary norepinephrine, μg/24 h | 21.4 ± 12.6 (6.5, 46.0) |
24EE, 24-h energy expenditure; DIT, diet-induced thermogenesis; EE, energy expenditure; FM, fat mass; FFM, fat-free mass; FGF21, fibroblast growth factor 21; fT3, free triiodothyronine 3; fT4, free triiodothyronine 4; OGTT, oral glucose tolerance test; SPA, spontaneous physical activity.
Daily intake during overfeeding as assessed by bomb calorimetry.
Compared with weight-maintaining energy needs.
Study design
Subjects underwent a 3-wk baseline weight-stabilizing period (21 ± 3 d), followed by a 42-d overfeeding period, and a 2-wk weight-stabilizing post-overfeeding period (13 ± 2 d). The study design and procedures in each period are summarized in Figure 1.
FIGURE 1.

Study design. 24EE, 24-h energy expenditure; CATE, 24-h urinary catecholamine measurements; DXA, total body dual-energy X-ray absorptiometry; EB1, 24EE assessment to determine weight-maintaining energy needs; EB2, 24EE assessment in energy balance; EB3, 24EE assessment in energy balance at new weight; FST, 24EE assessment during fasting; HOR, hormonal measurements; LP-OF, 24EE assessment during low-protein overfeeding; OF, 24EE assessment during 200% normal-protein overfeeding; WMD, weight-maintaining diet; * = in random order.
Study diets
Upon admission, volunteers were provided a standard weight-maintaining diet (WMD) with 50%, 30%, and 20% carbohydrate, fat, and protein content, respectively. Individual weight-maintaining energy needs were initially determined based on weight and sex (26), and then adjusted daily by the research dietitian to keep weight stable within 1% of baseline (admission) weight. Individual weight change during the baseline period is presented in Supplemental Figure 2A. The WMD was provided throughout the baseline period, except for four 24-h periods that volunteers spent in the whole-room indirect calorimeter for measurements of 24EE as described below.
During the subsequent 42-d overfeeding period, volunteers consumed daily a low-protein diet based on 150% of their weight-maintaining energy needs determined in the baseline period. This overfeeding diet was composed of 2% protein, 68% carbohydrate, and 30% fat. Participants were videotaped daily while eating the low-protein overfeeding diet, and tapes were reviewed by staff to ensure consumption of all food provided. Participants were also required to wait 30 min in the room following the meal.
Following the 42-d overfeeding period, volunteers were again fed a standard WMD with 20% protein content based on their achieved body weight for ∼2 wk before being discharged (26). During this post-overfeeding period, body weight was maintained stable within 1% of the weight measured on day 42 of the overfeeding period (Supplemental Figure 2B).
Body composition
Body composition [percentage body fat, fat mass (FM), and fat-free mass (FFM)] was estimated by total body dual-energy X-ray absorptiometry (DPX-L; Lunar Radiation) during the baseline period, during the overfeeding period (at the end of wk 1, wk 3, and wk 6) and again during the post-overfeeding period.
Energy expenditure
Twenty-four-hour EE was assessed in a large, open-circuit, indirect whole-room calorimeter (respiratory chamber), as previously described (1, 27). Subjects were asked to remain sedentary and not to exercise while in the respiratory chamber. The subjects’ SPA was measured by radar sensors and expressed as the percentage of time when activity was detected (28). Sleeping EE was calculated as the average EE between 1130 and 0500 when subject movement was < 1.5% (< 0.9 s/min) and extrapolated to a 24-h period (27).
To closely achieve energy balance during the 24EE assessment in the whole-room calorimeter and to allow for a precise calculation of the caloric requirements for the 24-h overfeeding session, 24EE was initially measured twice during eucaloric conditions in the baseline period. The first eucaloric EE assessment was obtained while subjects resided for 24 h in a whole-room indirect calorimeter and were provided 4 balanced meals with total daily energy intake calculated through the use of a unit-specific formula to achieve 24-h energy balance in the confined environment of the calorimeter (27). Secondly, after 2 d, subjects underwent another eucaloric EE assessment inside the calorimeter when the total energy intake of 4 balanced meals was equal to the 24-h EE value calculated during the first eucaloric EE assessment. For all analyses, the results from the second eucaloric measurement were considered the baseline 24EE.
Following eucaloric assessments, 24EE was also measured during 24-h fasting and during 24-h normal-protein overfeeding (200% of energy balance requirements with 50% carbohydrate and 20% protein content) in random order and with a 6 ± 2-d washout between both measurements during the baseline period. One fasting 24EE measurement was not performed in 1 individual due to technical issues. Changes in 24EE during dietary interventions (fasting and 200% overfeeding) were calculated both as absolute (kcal) and as percentage (%) of 24EE during energy balance as follows: [(24EEdiet − 24EEeucaloric)/24EEeucaloric] × 100. Similar calculations were done for sleeping EE and SPA. The DIT during energy balance was calculated as follows: 24EEeucaloric − 24EEfasting. The DIT during 200% overfeeding was calculated as follows: 24EEoverfeeding − 24EEfasting. DIT values are calculated over 24 h and thus represent the cumulative increase in 24EE due to 3 meals whose total energy (kcal) is that which defines the 24-h eucaloric requirements.
During the 6-wk overfeeding period, 24EE assessments were done at the end of wk 1, 3, and 6. Energy intake during these 24EE assessments was based on the same 150% low-protein diet eaten when not in the calorimeter. Due to calorimeter availability, not every 24EE assessment during overfeeding was completed by all 7 subjects (24EE assessments at wk 1, 3, and 6 were all completed by 5 individuals). In the post-overfeeding period, 24EE measurement was repeated under eucaloric conditions. Chamber temperature averaged 23.1 ± 3.3°C.
Bomb calorimetry
Measurement of the energy content of provided food, and of urine and stool samples was done as previously described (1), with an Isoperibol Calorimeter 6200 with a model 1108 oxygen bomb. During the baseline and post-overfeeding period, bomb calorimetry of a duplicate WMD meal and of stool and urine was performed for 3 d to accurately determine energy intake and loss. During the overfeeding period, bomb calorimetry was performed daily, and urine and stool were collected 3 d/wk to determine energy content lost through excretion. Average daily urine and stool calories were extrapolated to the rest of the associated week.
Activity level
Physical activity was measured continuously during the entire 6-wk overfeeding period, including days spent in the calorimeter. Five omnidirectional accelerometers (Actical; Philips Respironics) were attached to each volunteer's waist, left wrist, right wrist, left ankle, and right ankle, and a daily activity factor (DAF) was calculated as previously described (1).
Cumulative energy surplus
During the 6-wk overfeeding period, we calculated the cumulative energy surplus (CES) from 24EE, daily physical activity by activity monitor, and direct measurements of calories of nutrient intake, feces, and urine by bomb calorimetry, as previously described (1). Briefly, the 24EE measured during wk 1 of overfeeding was used as the reference 24EE, and the DAF during this very measurement was used as the reference DAF. The DAF of each overfeeding day was then multiplied by the reference 24EE and divided by the reference DAF to obtain the estimated daily 24EE, which was then subtracted from the absorbed calories of the same day (as determined by bomb calorimetry of food, feces, and urine) to obtain a daily energy surplus, which was summed across all 42 overfeeding days as follows:
 |
(1) |
The CES could not be determined in 2 subjects due to: 1) insufficient Actical data; and 2) missing reference 24EE assessment; both these subjects were excluded from the CES analyses.
Hormone and catecholamine measurements
Fasting serum samples were collected before entry into the calorimeter at baseline, at wk 3, and at wk 6 during the overfeeding period, and before an oral glucose tolerance test conducted on average 4.7 ± 3.1 d following the overfeeding period. Samples were immediately frozen to −70°C for later measurements. FGF21 was measured by ELISA (R&D Systems) with an intra-assay CV of 2.5% and an interassay CV of 5.2%. Leptin was measured by ELISA (EMD Millipore) with an intra-assay CV of 2.6% and an interassay CV of 5.0%. Free triiodothyronine 3 (fT3) and free triiodothyronine 4 (fT4) were measured in serum with the use of an enzyme immunoassay kit from Phoenix Pharmaceuticals. The intra- and interassay CVs were 3.0% and 4.5% for fT3 and 2.8% and 4.0% for fT4, respectively.
Urine was collected during the 24EE measurements at baseline, wk 1, wk 3, wk 6, and in the post-overfeeding period, and assessed for concentrations of epinephrine and norepinephrine. Urinary catecholamines were measured by HPLC by the commercial Mayo Clinic laboratory.
Statistical analysis
Power calculations were performed prior to analyses to calculate the minimum detectable correlation between the decrease in 24EE during fasting at baseline and weight gain after 6 wk of low-protein overfeeding. Assuming a power of 0.80 and a 2-sided α level of 0.05, the minimum expected correlation detectable in 7 subjects was −0.86, which is comparable to what has been found previously for the correlation between the decrease in 24EE during fasting at baseline and weight loss after 6 wk of 50% caloric restriction (r = −0.84) (1).
Statistical analysis was performed with the SAS statistical software package (SAS Enterprise Guide version 7.15; SAS Institute). Unless otherwise specified, data were expressed as means ± SDs or as means with 95% CIs. All reported weight and 24EE changes were expressed as absolute changes, unless otherwise specified. Pearson's correlation coefficient was used to quantify associations between continuous variables. Anthropometric and metabolic characteristics before and after 6-wk overfeeding were compared with the use of Student's paired t test. Due to the intra-individual variation in daily weight during overfeeding, weight change was also expressed as a weekly rate of weight gain by calculating the slope of the linear regression equation of daily absolute weight values compared with actual days during the overfeeding period and multiplying it by 7 (Supplemental Figure 3).
To evaluate the adaptive changes in 24EE resulting from changes in body composition due to sustained low-protein overfeeding, predicted 24EE (i.e., 24EE predicted by body composition measures) was calculated by the linear equation from multivariate regression analysis of baseline 24EE (dependent variable) taking both FFM and FM as independent variables. To increase the precision of regression estimates, we combined data from the current study (NCT00687115) with data from another study in our section (NCT00523627) with subjects undergoing the same baseline procedures (Supplemental Figure 4). Based on data from 72 subjects, the regression equation for predicted 24EE (kcal/d) was equal to: 599 + 21.1 × FFM + 11.9 × FM. This equation was then used to calculate predicted 24EE at wk 3 and at wk 6 of the overfeeding period, as well as at the post-overfeeding period, from the body composition measures of each respective time point. Measured 24EE values at these time points were subtracted from the respective predicted 24EE values and then tested against a change from 0 by 1-sample Student's t test.
To evaluate FM-independent changes in serum leptin, predicted leptin was calculated by the linear equation from multivariate regression analysis of baseline leptin (dependent variable) taking FM as an independent variable. Based on data from n = 7 subjects, the regression equation for predicted leptin (kcal/d) was equal to: 0.415 × FM – 1.90. This equation was then used to calculate predicted leptin in wk 3 and wk 6 of the overfeeding period, as well as in the post-overfeeding period, from the body composition measures of each respective time point. Measured leptin values at these time points were subtracted from the respective predicted leptin values and then tested against a change from 0 by 1-sample Student's t test.
Results
All participants were male, 31 ± 12 y old, and had a BMI of 20.5 ± 1.6 (range: 18–23; Table 1). Baseline FM and FFM were 9.5 ± 3.4 and 52.8 ± 2.4 kg, respectively. During 6-wk low-protein overfeeding, daily caloric intake as directly determined by bomb calorimetry was 51 ± 3% (1335 ± 89 kcal/d) above baseline weight–maintaining energy needs.
After 6 wk of daily low-protein overfeeding, body weight increased on average by 3.8 kg (95% CI: 2.6, 5.1 kg; P = 0.0003; Figure 2A) or 6.1% of baseline weight (95% CI: 4.3%, 8.0%; P = 0.0002; Figure 2B) with a substantial intersubject variability ranging from 1.5 kg (2.5%) to 5.1 kg (8.0%). The average weekly rate of weight gain was 0.5 ± 0.2 kg/wk with interindividual differences ranging from 0.2 to 0.7 kg/wk (Supplemental Figure 3). On average, FM increased by 4.5 kg (95% CI: 3.6, 5.4 kg; P < 0.0001; Figure 2C) whereas FFM remained unchanged (P = 0.28; Figure 2D). The average CES was 58,638 ± 7992 kcal (range: 47,999–66,630 kcal).
FIGURE 2.

Changes in absolute body weight (A), percentage body weight (B), FM (C), and FFM (D) during 6 wk of daily 150% low-protein overfeeding. Data presented as weekly change (every lefthand figure) with gray lines indicating individual participants and error bars indicating SDs; and change from baseline to post-overfeeding (every righthand figure) with connected dots indicating individual participants. The dashed vertical line of each lefthand figure represents the end of the overfeeding period. P values were calculated with a paired t test. FM, fat mass; FFM, fat-free mass; Post-OF, post-overfeeding period.
Metabolic predictors of weight gain after 6-wk overfeeding
During 24-h fasting at baseline, 24EE decreased on average by 158 kcal/d (95% CI: −252, −64 kcal/d; P = 0.007) or 8.2% (95% CI: −13.1%, −3.3%) compared with energy-balance conditions. Subjects with a smaller reduction in 24EE in response to fasting at baseline gained less weight after 6 wk of low-protein overfeeding ( r = − 0.84, P = 0.03; Figure 3A). This association remained significant when considering weekly rate of weight gain during the 6-wk overfeeding period (r = −0.94, P = 0.005, Supplemental Table 1). Further, a greater decrease in baseline 24EE during fasting was associated with greater FM gain following the 6-wk overfeeding period (r = −0.81, P = 0.049; Figure 3B). The associations for body weight and FM remained significant when expressing baseline 24EE decrease during fasting as a percentage of 24EE during energy balance (Supplemental Table 1). The assessment of 24EE components revealed that the associations between baseline 24EE decrease during fasting and weight gain measures were reflected by DIT (r = 0.94, P = 0.005), but not by changes in sleeping EE or SPA during fasting (all P > 0.05, Supplemental Table 1). There was an inverse association between CES and decrease in baseline 24EE during fasting, such that a greater percentage reduction in 24EE during fasting at baseline was associated with increased CES during the subsequent 6-wk overfeeding period (r = −0.91, P = 0.03; Supplemental Figure 5).
FIGURE 3.

Inverse relations between the decrease in 24EE during fasting at baseline and body weight gain (A) and FM gain (B) following the 6-wk overfeeding period. Scatter plots displaying results determined with the use of Pearson correlation. Data presented for 6 subjects due to 1 invalid assessment of 24EE during fasting at baseline. 24EE, 24-h energy expenditure; FM, fat mass.
During 24-h normal-protein overfeeding with 200% of energy-balance requirements at baseline, 24EE increased on average by 201 kcal/d (95% CI: 151, 251 kcal/d; P < 0.0001) or 10.6% (95% CI: 7.9%, 13.3%) of 24EE during energy balance. There were no associations between the 24EE increase during 200% normal-protein overfeeding at baseline and subsequent weight gain, weekly rate of weight gain, or FM gain after 6-wk low-protein overfeeding (all P > 0.2; Supplemental Table 1). Daily activity assessed by activity monitors or SPA in the calorimeter correlated neither with weight gain measures nor with changes in baseline 24EE during fasting and 200% overfeeding (all P > 0.1).
Metabolic adaptation to 6 wk of daily low-protein overfeeding
During low-protein overfeeding, we observed an average increase in 24EE above requirements for achieved body size of 356 kcal/d at wk 1 (95% CI: 257, 456 kcal/d; P = 0.0006), 302 kcal/d at wk 3 (05% CI: 86, 535 kcal/d; P = 0.005), and 390 kcal/d at wk 6 (95% CI: 301, 478 kcal/d; P = 0.0003) (Figure 4A). Similarly, measured 24EE was greater than that expected by increased body size in the post-overfeeding period, although the average increase (+166 kcal/d above predicted 24EE) did not reach statistical significance and showed a high interindividual variability (95% CI: −32, 362 kcal/d; P = 0.09). During all time points, SPA in the metabolic chamber measured by radar was comparable to baseline (P > 0.4) and did not correlate with the increase in 24EE above requirements (P > 0.4). Similarly, physical activity assessed by activity monitors during 6-wk overfeeding did not correlate with changes in 24EE (P = 0.8).
FIGURE 4.

Relations between metabolic adaptation in the post-overfeeding period and body weight and FM gain after 6 wk of low-protein overfeeding. (A) During low-protein overfeeding, 24EE increased by 356 kcal/d at wk 1 (95% CI: 257, 456 kcal/d; P = 0.0006), 302 kcal/d at wk 3 (95% CI: 86, 535 kcal/d; P = 0.005), and 390 kcal/d at wk 6 (95% CI: 301, 478 kcal/d; P = 0.0003) above requirements for achieved body size. 24EE did not significantly differ from baseline in the post-overfeeding period but showed a high interindividual variability (+166 kcal/d; 95% CI: −32, 362 kcal/d; P = 0.09). Measured minus predicted 24EE at each time point was compared with baseline by 1-sample Student's t test. Data presented for n = 5 subjects at wk 1, 3, and 6 due to limited calorimeter availability and logistic issues experienced during the overfeeding period. Inverse associations between metabolic adaptation and (B) body weight gain and (C) increase in FM. Scatter plots displaying results determined with the use of Pearson correlation. 24EE, 24-h energy expenditure; FM, fat mass; Post-OF, post-overfeeding period.
Increased metabolic adaptation after 6-wk overfeeding (i.e., measured 24EE in the post-overfeeding period greater than 24EE predicted by increased body weight) was associated with less weight gain (r = −0.78, P = 0.04; Figure 4B) and less FM gain (r = −0.78, P = 0.04; Figure 4C). The extent of metabolic adaptation after 6-wk overfeeding was positively associated with the increase in 24EE during 200% normal-protein overfeeding at baseline (r = 0.91, P = 0.005; Figure 5A), but not with the decrease in 24EE during fasting (P = 0.34; Figure 5B). Results were similar when expressing changes in 24EE as a percentage of energy balance conditions (Supplemental Figure 6A, B).
FIGURE 5.

Relations between metabolic adaptation during the post-overfeeding period and changes in baseline 24EE during 200% normal-protein overfeeding (A) and fasting (B). The graphs are scatter plots displaying results determined from the Pearson correlation. In panel B, data are presented for 6 subjects because of 1 invalid assessment of 24EE during fasting at baseline. 24EE, 24-h energy expenditure.
We also calculated metabolic adaptation of sleeping EE (via the same approach we used for the calculation of metabolic adaptation of 24EE). During low-protein overfeeding, we observed an average increase in sleeping EE above requirements for achieved body size of 123 kcal/d at wk 1 (95% CI: 37, 209 kcal/d; P = 0.02; Supplemental Figure 7) but not at any other time point (all P > 0.12). Measured sleeping EE was greater than that expected by increased body size in the post-overfeeding period, although the average increase (+89 kcal/d above predicted sleeping EE) did not reach statistical significance and showed a high interindividual variability (95% CI: −9, 186 kcal/d; P = 0.07). Increased metabolic adaptation of sleeping EE after 6-wk overfeeding (i.e., measured sleeping EE in the post-overfeeding period greater than sleeping EE predicted by increased body weight) was not associated with weight or FM gain (all P > 0.18).
Hormonal changes during low-protein overfeeding
We also measured known hormonal mediators of EE during overfeeding, namely urinary catecholamines, fT3, fT4, and leptin. Urinary norepinephrine, but not epinephrine (all P > 0.3; Figure 6A), increased on average by 2-fold during overfeeding but was similar to baseline in the post-overfeeding period (Figure 6B). Serum fT3 remained unchanged during and following low-protein overfeeding (all P > 0.17; Figure 7A). Serum fT4 decreased on average by 21% after 6 wk of overfeeding (95% CI: −32.4%, −8.7%; P = 0.005) and remained 23% lower compared with baseline in the post-overfeeding period (95% CI: −33.9%, −12.2%; P = 0.002; Figure 7B). Serum leptin concentration increased on average by 1.8-fold at wk 3 (95% CI: 1.4-fold, 2.2-fold; P = 0.002; Figure 7C), 3.0-fold at wk 6 (95% CI: 2.3-fold, 3.8-fold; P = 0.0009), and remained 2.8-fold higher than baseline in the post-overfeeding period (95% CI: 1.7-fold, 3.8-fold; P = 0.006). However, if measured leptin was compared with leptin predicted by FM, there was no increase above that expected during and following overfeeding (all P > 0.08; Figure 7D). Changes in urinary catecholamines, fT3, fT4, and adjusted leptin concentrations both during and following overfeeding were not associated with weight gain measures or changes in 24EE during fasting or overfeeding at baseline (all P > 0.05).
FIGURE 6.
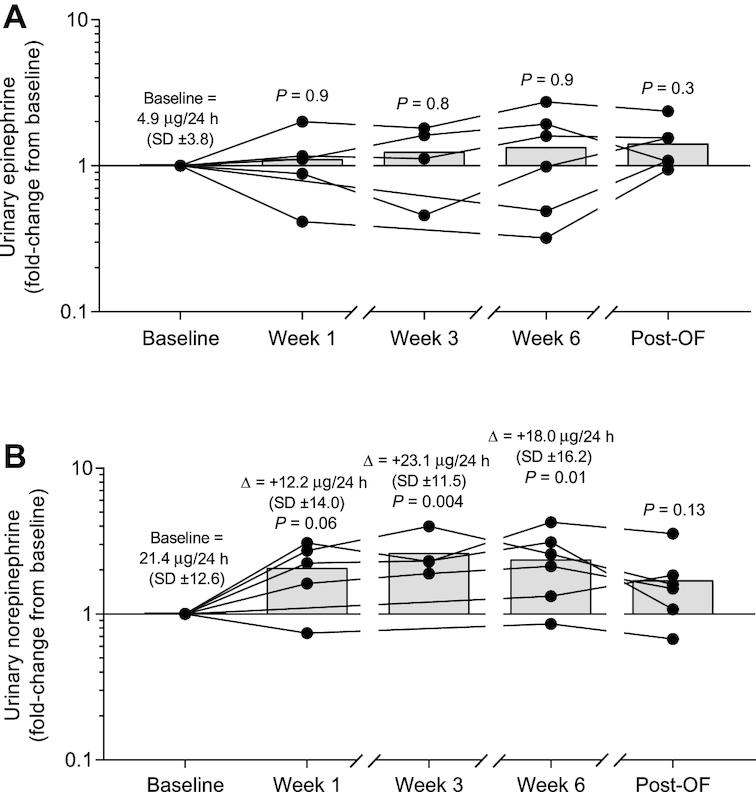
Changes in urinary catecholamines during and following 6 wk of daily 150% low-protein overfeeding. (A) On average, epinephrine concentration did not change during and following low-protein overfeeding as compared with baseline values (all P > 0.3). (B) Norepinephrine concentration increased on average by 2.1-fold at wk 1 (95% CI: 0.97-fold, 3.2-fold; P = 0.06), by 2.6-fold at wk 3 (95% CI: 1.4-fold, 3.9-fold; P = 0.004), by 2.4-fold at wk 6 (95% CI: 1.3-fold, 3.5-fold; P = 0.01), and was comparable with baseline values in the post-overfeeding period (mean: 1.7-fold; 95% CI: 0.6-fold, 2.8-fold; P = 0.13). Fold change values were calculated for each subject as the ratio between values at each time point divided by the baseline value. At each time point, black circles show individual fold change values and bars show average fold change. Significance was determined with Student's t test. The average absolute change is reported at each time point along with P values for fold-change. Data presented for: n = 6 subjects (baseline, wk 6, and post-overfeeding), n = 5 subjects (wk 1), and n = 4 subjects (wk 3). Post-OF, post-overfeeding period.
FIGURE 7.

Changes in serum fT3 (A), serum fT4 (B), leptin (C), and leptin adjusted for FM (D) during and following 6 wk of daily 150% low-protein overfeeding. (A) Serum fT3 remained unchanged during and following low-protein overfeeding. (B) Serum fT4 decreased on average by 20.6% after 6 wk of overfeeding (95% CI: −32.4%, −8.7%; P = 0.005) and remained 23.0% lower than baseline in the post-overfeeding period (95% CI: −33.9%, −12.2%; P = 0.002). Percentage change values of fT3 and fT4 were calculated for each subject as the difference between the absolute values at each time point minus the baseline absolute value, and then multiplied by 100. At each time point, black circles show individual percentage change values and bars show average percentage change. Significance was determined with Student's t test. (C) Serum leptin concentration increased on average by 1.8-fold at wk 3 (95% CI: 1.4-fold, 2.2-fold; P = 0.002), 3.0-fold at wk 6 (95% CI: 2.3-fold, 3.8-fold; P = 0.0009), and remained 2.8-fold higher than baseline in the post-overfeeding period (95% CI: 1.7-fold, 3.8-fold; P = 0.006). Fold change values were calculated for each subject as the ratio between values at each time point divided by the baseline value. At each time point, black circles show individual fold change values and bars show average fold change. Significance was determined with Student's t test. (D) Serum leptin adjusted for FM remained unchanged during and following overfeeding. Measured minus predicted serum leptin at each time point was compared with baseline by 1-sample Student's t test. The average absolute increase is reported at each time point along with P values for percentage change or fold-change. Data are presented for n = 5 subjects at wk 1, 3, and 6 during the overfeeding period. In panels A, B, and C, the average absolute increase is reported at each time point along with P values for percentage change or fold-change. FM, fat mass; fT3, free triiodothyronine 3; fT4, free triiodothyronine 4; Post-OF, post-overfeeding period.
Changes in FGF21 during low-protein overfeeding
We also measured whether FGF21 changed during low-protein overfeeding and whether these changes were associated with weight gain or metabolic adaptation. Due to the vast increase in FGF21, we show fold-changes for FGF21. Serum FGF21 concentration increased on average by 25-fold at wk 3 (95% CI: 11-fold, 39-fold; P = 0.007; Figure 8A) and 44-fold at wk 6 (95% CI: 29-fold, 58-fold; P = 0.0006) during the low-protein overfeeding period and remained 3.5-fold higher in the post-overfeeding period (95% CI: 1.3-fold, 5.7-fold; P = 0.03). The increase in FGF21 after 6 wk of overfeeding was not related to weight gain ( P = 0.63; Figure 8B), nor to FM change, or the weekly rate of weight gain (all P > 0.3, data not shown). The increase in FGF21 in the post-overfeeding period was not related to metabolic adaptation (P = 0.82; Figure 8C).
FIGURE 8.

Changes in serum FGF21 (A) during low-protein overfeeding, and its relation to weight gain after 6 wk of low-protein overfeeding (B) and metabolic adaptation in the post-overfeeding period (C). (A) Serum FGF21 concentration increased on average by 25-fold at wk 3 (95% CI: 11-fold, 39-fold; P = 0.007) and 44-fold at wk 6 (95% CI: 29-fold, 58-fold; P = 0.0006) during the low-protein overfeeding period and remained 3.5-fold higher during the post-overfeeding period (95% CI: 1.3-fold, 5.7-fold; P = 0.03). Fold change values were calculated for each subject as the ratio between values at each time point divided by the baseline value. At each time point, black circles show individual fold change values and bars show average fold change. Significance was determined with Student's t test. (B) Association between change in serum FGF21 from baseline to overfeeding wk 6 and body weight gain. (C) Association between change in serum FGF21 from baseline to the post-overfeeding period and metabolic adaptation. Data are presented for n = 6 subjects at wk 3 and wk 6 during the overfeeding period and for n = 7 subjects in the post-overfeeding period. Scatter plots displaying results determined with the Pearson correlation. FGF21, fibroblast growth factor 21; Post-OF, post-overfeeding period.
Discussion
The results of the present study indicate that a smaller decrease in 24EE during fasting predicts less weight gain and FM gain and lower accumulation of stored calories in response to 6 wk of daily low-protein overfeeding in this group of lean men. This ability to maintain higher 24EE under fasting conditions may indicate that an individual is less likely to gain weight during a period of overfeeding. The serum concentration of FGF21 increased significantly during the overfeeding period and remained elevated during the post-overfeeding period. This would suggest that FGF21 is a metabolic key hormone of sustained low-protein overfeeding.
Following 6 wk of low-protein overfeeding, the increase in 24EE compared with that predicted by increased body weight (i.e., the degree of metabolic adaptation) correlated with less body weight and FM gain, and, importantly, it was positively associated with the extent of increase in 24EE during 200% overfeeding measured at baseline (one of the features characterizing the metabolic phenotypes). Collectively, these results provide additional evidence for the existence of metabolic phenotypes in lean men and their role in weight gain, specifically during low-protein overfeeding, which induces a large increase in FGF21 concentration.
Metabolically thriftier individuals are more susceptible to gain weight during overfeeding
Our present findings showing that the metabolic phenotype is a predictor of weight gain during overfeeding are consistent when different assessments of weight gain are used: 1) weekly rate of weight gain, which minimizes the day-to-day variation in body weight change during sustained overfeeding; and 2) body composition assessment to calculate FM gain, with both measures showing similar relations with the baseline 24EE decrease during fasting. The metabolic phenotype was not associated with the degree of physical activity (either assessed in the calorimeter by radar systems or on the ward by activity monitors), which is somewhat expected as we measured 24EE in the restricted environment of a metabolic chamber and identified these metabolic phenotypes in sedentary conditions in response to dietary interventions (e.g., fasting).
The effects of metabolic phenotypes on weight gain are further confirmed by the association between the decrease in baseline 24EE during fasting and CES during 6-wk overfeeding, providing stronger evidence that, when all calories are accounted for by accurate measurement via bomb calorimetry, individuals who are metabolically thriftier stored more calories than individuals who are metabolically more spendthrift during sustained positive energy balance, and thus gained more weight and FM after 6 wk of overfeeding.
The participant with the thriftiest metabolic phenotype gained 2-fold more weight after 6 wk of low-protein overfeeding than the most metabolically spendthrift individual (Figure 9), which would translate into a considerable difference in body weight if chronic positive energy balance due to excess energy intake were to be sustained over months or years.
FIGURE 9.
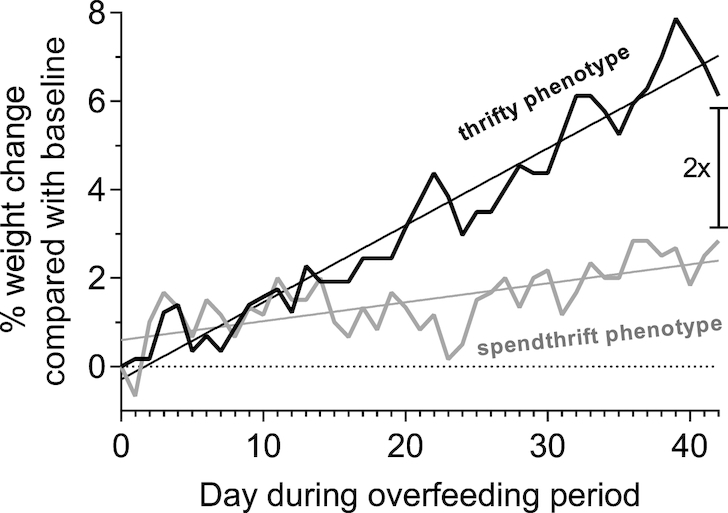
Exemplary body weight time courses of 2 individuals with different metabolic phenotype during the 6 wk of daily 150% low-protein overfeeding. Data are presented as daily weight change as a percentage of the body weight on the first day of the overfeeding period. The individual with the thriftiest metabolic phenotype (i.e., the subject with the greatest decrease in baseline 24EE during fasting equal to −253 kcal/d) gained twice as much weight as the individual with the most spendthrift metabolic phenotype, who had a decrease in baseline 24EE during fasting equal to −4 kcal/d. 24EE, 24-h energy expenditure.
Taken together, these data indicate that the physiologic mechanisms that underlie the relation between metabolic phenotype and weight gain control the degree of energy storage in conditions of persistent positive energy balance.
Metabolic adaptation as a possible determinant of interindividual variability in weight gain
The large interindividual variability in weight gain, given equal conditions of positive energy balance, has been reported multiple times in previous overfeeding studies (11–17). This may be explained by the adaptive increase in 24EE during over- or underfeeding, known as “adaptive thermogenesis,” although its existence is controversial (21) as some consider it a factor in weight maintenance (18, 19, 29), whereas others consider it a measurement error (30). Our group showed that spontaneous long-term weight gain is accompanied by greater-than-predicted increase in 24EE, although this increase was small (31). Previous overfeeding studies demonstrated that protein intake is a strong determinant in the degree of this EE change (32, 33).
In this present study, we observed an average increase in 24EE above requirements for achieved body size of ∼350 kcal/d during 150% overfeeding a low-protein (2%) diet, which confirms the results of a previous study with a similar design (32). This surplus in 24EE observed during overfeeding can be mainly attributed to increased DIT as the participants also received the 150% overfeeding diet during the 24EE assessments in the metabolic chamber in the overfeeding period. In some subjects, measured 24EE in the post-overfeeding period when participants were back on a normal-protein WMD remained above the 24EE predicted from increased body size after weight gain, whereas it was similar to baseline 24EE in others. The extent of this relative increase in 24EE — termed “metabolic adaptation” (23, 24) — inversely correlated with gains in body weight and FM during the overfeeding period, indicating that individuals who were more able to increase their 24EE during overfeeding were also those who gained the least amount of weight. Importantly, the magnitude of metabolic adaptation in the post-overfeeding period was strongly associated with the extent of increase in 24EE during 200% overfeeding at baseline, indicating that metabolic spendthriftyness in a short-term (24 h) setting of positive energy balance is also an indicator of the capacity to increase 24EE during sustained overfeeding and weight gain. Collectively, these results demonstrate a novel, additional mechanism (i.e., metabolic adaptation) by which lean individuals with a more spendthrift metabolic phenotype might resist weight gain during periods of excess food intake and positive energy balance.
Changes of FGF21 with low-protein overfeeding
The hormonal mechanisms underlying the changes in 24EE during fasting and overfeeding, as well as the metabolic adaptation to weight gain, remain unclear. We observed an average 44-fold increase in serum FGF21 concentration during low-protein overfeeding that paralleled the concomitant increase in 24EE. FGF21 is mainly secreted by the liver and acts as a signal of protein restriction (34). The vast increase in FGF21 during our overfeeding diet may be attributed to the very low protein intake of 2%. Multiple studies, including studies from our own group, showed that the increase in FGF21 during overfeeding with protein restriction is associated with the concomitant increase in EE (34–36). FGF21 increases EE by upregulating sympathetic activity and uncoupling protein 1 expression in white and brown adipose tissue (37, 38), which, in mice, leads to weight loss despite a compensatory increase in food intake (34). In line with these results, higher FGF21 secretion may also defend against weight gain (35, 39).
In this present study, however, we could not find a direct association between changes in FGF21 and changes in EE or weight gain during low-protein overfeeding, although there was likely a lack of statistical power required to detect this association. Interestingly, FGF21 concentrations remained elevated following 6-wk overfeeding, which suggests that the hormonal adaptations to low-protein overfeeding were sustained following the overfeeding period. Although the increased FGF21 concentration was not associated with metabolic adaptation in the post-overfeeding period, we hypothesize that it might be a contributor to thermic effects following weight gain. We also observed a reduced fT4 concentration following overfeeding, which is consistent with previous studies and might indicate an upregulation of peripheral fT4-to-fT3 conversion (40).
Limitations
Our study has some limitations. First, our sample size is relatively small as it includes only 7 subjects and all lean men. Thus, our data may not be generalizable to overweight individuals and women. Second, some participants did not complete all 24EE measures due to technical issues and logistics, including 1 assessment of 24EE during fasting at baseline. Thus, the relation between decrease in baseline 24EE during fasting and weight gain after overfeeding could only be calculated in 6 subjects. Third, we calculated predicted 24EE during overfeeding based on FM and FFM, but we did not have direct measures of organ size which might explain interindividual differences in 24EE (30, 41). Fourth, we did not assess the influence of other metabolic factors that might determine the metabolic phenotype (e.g., differences in the microbiome or in the micronutrient status).
Conclusions
Our data highlight the importance of low-protein overfeeding as an important dietary tool to uncover individual susceptibility to weight gain. Our data also strengthen our previous evidence for the existence of more spendthrift/thrifty metabolic phenotypes in humans and extend the metabolic features of these phenotypes to include the adaptive 24EE response to weight gain. A better understanding and the clinical characterization of metabolic phenotypes among individuals may lead to new strategies to prevent weight gain on the basis of their susceptibility to obesity.
Supplementary Material
Acknowledgments
We thank the dietary, nursing, and technical staff of the Obesity and Diabetes Clinical Research Section for their assistance.
The authors’ responsibilities were as follows—TH: carried out the initial analyses, interpreted the results, and wrote the manuscript; TA and AB: carried out the initial analyses and interpreted the results; JK: interpreted the results and edited the final manuscript; SBV: designed the study, interpreted the results, and edited the final manuscript; PP: interpreted the results, wrote the manuscript, and had primary responsibility for the final content; and all authors: read and approved the final manuscript. The authors declare no conflicts of interest.
Notes
This study was supported by the Intramural Research Program of the National Institutes of Health, National Institute of Diabetes and Digestive and Kidney Diseases.
SBV and PP contributed equally to this work as senior authors.
Supplemental Figures 1–7 and Supplemental Table 1 are available from the “Supplementary data” link in the online posting of the article and from the same link in the online table of contents at https://academic.oup.com/ajcn/.
Abbreviations used: 24EE, 24-h energy expenditure; CES, cumulative energy surplus; DAF, daily activity factor; DIT, diet-induced thermogenesis; EE, energy expenditure; FFM, fat-free mass; FGF21, fibroblast growth factor 21; FM, fat mass; fT3, free triiodothyronine 3; fT4, free triiodothyronine 4; SPA, spontaneous physical activity; WMD, weight-maintaining diet.
References
- 1. Reinhardt M, Thearle MS, Ibrahim M, Hohenadel MG, Bogardus C, Krakoff J, Votruba SB. A human thrifty phenotype associated with less weight loss during caloric restriction. Diabetes. 2015;64(8):2859–67. [DOI] [PMC free article] [PubMed] [Google Scholar]
- 2. Schlogl M, Piaggi P, Pannacciuli N, Bonfiglio SM, Krakoff J, Thearle MS. Energy expenditure responses to fasting and overfeeding identify phenotypes associated with weight change. Diabetes. 2015;64(11):3680–9. [DOI] [PMC free article] [PubMed] [Google Scholar]
- 3. Piaggi P, Vinales KL, Basolo A, Santini F, Krakoff J. Energy expenditure in the etiology of human obesity: spendthrift and thrifty metabolic phenotypes and energy-sensing mechanisms. J Endocrinol Invest. 2018;41(1):83–9. [DOI] [PMC free article] [PubMed] [Google Scholar]
- 4. Stock MJ. Gluttony and thermogenesis revisited. Int J Obes Relat Metab Disord. 1999;23(11):1105–17. [DOI] [PubMed] [Google Scholar]
- 5. Dulloo AG, Jacquet J.. Low-protein overfeeding: a tool to unmask susceptibility to obesity in humans. Int J Obes Relat Metab Disord. 1999;23(11):1118–21. [DOI] [PubMed] [Google Scholar]
- 6. Vinales KL, Begaye B, Bogardus C, Walter M, Krakoff J, Piaggi P. FGF21 is a hormonal mediator of the human “thrifty” metabolic phenotype. Diabetes. 2019;68(2):318–23. [DOI] [PMC free article] [PubMed] [Google Scholar]
- 7. Schmidt SL, Kealey EH, Horton TJ, VonKaenel S, Bessesen DH. The effects of short-term overfeeding on energy expenditure and nutrient oxidation in obesity-prone and obesity-resistant individuals. Int J Obes (Lond). 2013;37(9):1192–7. [DOI] [PMC free article] [PubMed] [Google Scholar]
- 8. Zauner C, Schneeweiss B, Kranz A, Madl C, Ratheiser K, Kramer L, Roth E, Schneider B, Lenz K. Resting energy expenditure in short-term starvation is increased as a result of an increase in serum norepinephrine. Am J Clin Nutr. 2000;71(6):1511–5. [DOI] [PubMed] [Google Scholar]
- 9. Apolzan JW, Bray GA, Smith SR, de Jonge L, Rood J, Han H, Redman LM, Martin CK. Effects of weight gain induced by controlled overfeeding on physical activity. Am J Physiol Endocrinol Metab. 2014;307(11):E1030–7. [DOI] [PMC free article] [PubMed] [Google Scholar]
- 10. Weststrate JA, Hautvast JG.. The effects of short-term carbohydrate overfeeding and prior exercise on resting metabolic rate and diet-induced thermogenesis. Metabolism. 1990;39(12):1232–9. [DOI] [PubMed] [Google Scholar]
- 11. Bray GA, Smith SR, de Jonge L, Xie H, Rood J, Martin CK, Most M, Brock C, Mancuso S, Redman LM. Effect of dietary protein content on weight gain, energy expenditure, and body composition during overeating: a randomized controlled trial. JAMA. 2012;307(1):47–55. [DOI] [PMC free article] [PubMed] [Google Scholar]
- 12. Norgan NG, Durnin JV.. The effect of 6 weeks of overfeeding on the body weight, body composition, and energy metabolism of young men. Am J Clin Nutr. 1980;33(5):978–88. [DOI] [PubMed] [Google Scholar]
- 13. Tappy L. Metabolic consequences of overfeeding in humans. Curr Opin Clin Nutr Metab Care. 2004;7(6):623–8. [DOI] [PubMed] [Google Scholar]
- 14. Joosen AM, Westerterp KR. Energy expenditure during overfeeding. Nutr Metab (Lond). 2006;3:25. [DOI] [PMC free article] [PubMed] [Google Scholar]
- 15. Horton TJ, Drougas H, Brachey A, Reed GW, Peters JC, Hill JO. Fat and carbohydrate overfeeding in humans: different effects on energy storage. Am J Clin Nutr. 1995;62(1):19–29. [DOI] [PubMed] [Google Scholar]
- 16. Lammert O, Grunnet N, Faber P, Bjornsbo KS, Dich J, Larsen LO, Neese RA, Hellerstein MK, Quistorff B. Effects of isoenergetic overfeeding of either carbohydrate or fat in young men. Br J Nutr. 2000;84(2):233–45. [PubMed] [Google Scholar]
- 17. Muller MJ, Enderle J, Pourhassan M, Braun W, Eggeling B, Lagerpusch M, Gluer CC, Kehayias JJ, Kiosz D, Bosy-Westphal A. Metabolic adaptation to caloric restriction and subsequent refeeding: the Minnesota Starvation Experiment revisited. Am J Clin Nutr. 2015;102(4):807–19. [DOI] [PubMed] [Google Scholar]
- 18. James Müller M. Adaptive thermogenesis: Do we need new thinking?. Obesity. 2016;24(8):1610–1. [DOI] [PubMed] [Google Scholar]
- 19. Muller MJ, Bosy-Westphal A. Adaptive thermogenesis with weight loss in humans. Obesity (Silver Spring). 2013;21(2):218–28. [DOI] [PubMed] [Google Scholar]
- 20. Kozak LP. Brown fat and the myth of diet-induced thermogenesis. Cell Metab. 2010;11(4):263–7. [DOI] [PMC free article] [PubMed] [Google Scholar]
- 21. Westerterp KR. Metabolic adaptations to over- and underfeeding—still a matter of debate?. Eur J Clin Nutr. 2013;67(5):443–5. [DOI] [PubMed] [Google Scholar]
- 22. Rosenbaum M, Leibel RL.. Adaptive thermogenesis in humans. Int J Obes (Lond). 2010;34 Suppl 1:S47–55. [DOI] [PMC free article] [PubMed] [Google Scholar]
- 23. Knuth ND, Johannsen DL, Tamboli RA, Marks-Shulman PA, Huizenga R, Chen KY, Abumrad NN, Ravussin E, Hall KD. Metabolic adaptation following massive weight loss is related to the degree of energy imbalance and changes in circulating leptin. Obesity (Silver Spring). 2014;22(12):2563–9. [DOI] [PMC free article] [PubMed] [Google Scholar]
- 24. Fothergill E, Guo J, Howard L, Kerns JC, Knuth ND, Brychta R, Chen KY, Skarulis MC, Walter M, Walter PJ et al.. Persistent metabolic adaptation 6 years after “The Biggest Loser” competition. Obesity (Silver Spring). 2016;24(8):1612–9. [DOI] [PMC free article] [PubMed] [Google Scholar]
- 25. Rayburn WF. Diagnosis and classification of diabetes mellitus: highlights from the American Diabetes Association. J Reprod Med. 1997;42(9):585–6. [PubMed] [Google Scholar]
- 26. Ferraro R, Boyce VL, Swinburn B, De Gregorio M, Ravussin E. Energy cost of physical activity on a metabolic ward in relationship to obesity. Am J Clin Nutr. 1991;53(6):1368–71. [DOI] [PubMed] [Google Scholar]
- 27. Thearle MS, Pannacciulli N, Bonfiglio S, Pacak K, Krakoff J. Extent and determinants of thermogenic responses to 24 hours of fasting, energy balance, and five different overfeeding diets in humans. J Clin Endocrinol Metab. 2013;98(7):2791–9. [DOI] [PMC free article] [PubMed] [Google Scholar]
- 28. Schutz Y, Ravussin E, Diethelm R, Jequier E. Spontaneous physical activity measured by radar in obese and control subject studied in a respiration chamber. Int J Obes. 1982;6(1):23–8. [PubMed] [Google Scholar]
- 29. Muller MJ, Enderle J, Bosy-Westphal A. Changes in energy expenditure with weight gain and weight loss in humans. Curr Obes Rep. 2016;5(4):413–23. [DOI] [PMC free article] [PubMed] [Google Scholar]
- 30. Dulloo AG, Jacquet J, Montani JP, Schutz Y. Adaptive thermogenesis in human body weight regulation: more of a concept than a measurable entity?. Obes Rev. 2012;13 Suppl 2:105–21. [DOI] [PubMed] [Google Scholar]
- 31. Weyer C, Pratley RE, Salbe AD, Bogardus C, Ravussin E, Tataranni PA. Energy expenditure, fat oxidation, and body weight regulation: a study of metabolic adaptation to long-term weight change. J Clin Endocrinol Metab. 2000;85(3):1087–94. [DOI] [PubMed] [Google Scholar]
- 32. Bray GA, Redman LM, de Jonge L, Covington J, Rood J, Brock C, Mancuso S, Martin CK, Smith SR. Effect of protein overfeeding on energy expenditure measured in a metabolic chamber. Am J Clin Nutr. 2015;101(3):496–505. [DOI] [PubMed] [Google Scholar]
- 33. Westerterp KR. Diet induced thermogenesis. Nutr Metab (Lond). 2004;1(1):5. [DOI] [PMC free article] [PubMed] [Google Scholar]
- 34. Laeger T, Henagan TM, Albarado DC, Redman LM, Bray GA, Noland RC, Munzberg H, Hutson SM, Gettys TW, Schwartz MW et al.. FGF21 is an endocrine signal of protein restriction. J Clin Invest. 2014;124(9):3913–22. [DOI] [PMC free article] [PubMed] [Google Scholar]
- 35. Vinales KL, Begaye B, Bogardus C, Walter M, Krakoff J, Piaggi P. FGF21 is a hormonal mediator of the human “thrifty” metabolic phenotype. Diabetes. 2019;68(2):318–23. [DOI] [PMC free article] [PubMed] [Google Scholar]
- 36. Maida A, Zota A, Sjoberg KA, Schumacher J, Sijmonsma TP, Pfenninger A, Christensen MM, Gantert T, Fuhrmeister J, Rothermel U et al.. A liver stress-endocrine nexus promotes metabolic integrity during dietary protein dilution. J Clin Invest. 2016;126(9):3263–78. [DOI] [PMC free article] [PubMed] [Google Scholar]
- 37. Coskun T, Bina HA, Schneider MA, Dunbar JD, Hu CC, Chen Y, Moller DE, Kharitonenkov A. Fibroblast growth factor 21 corrects obesity in mice. Endocrinology. 2008;149(12):6018–27. [DOI] [PubMed] [Google Scholar]
- 38. Douris N, Stevanovic DM, Fisher FM, Cisu TI, Chee MJ, Nguyen NL, Zarebidaki E, Adams AC, Kharitonenkov A, Flier JS et al.. Central fibroblast growth factor 21 browns white fat via sympathetic action in male mice. Endocrinology. 2015;156(7):2470–81. [DOI] [PMC free article] [PubMed] [Google Scholar]
- 39. Redman LM, Ravussin E.. In pursuit of a biomarker of weight gain susceptibility—is FGF21 a candidate?. Diabetes. 2019;68(2):266–7. [DOI] [PMC free article] [PubMed] [Google Scholar]
- 40. Welle S, O'Connell M, Danforth E Jr., Campbell R. Decreased free fraction of serum thyroid hormones during carbohydrate overfeeding. Metabolism. 1984;33(9):837–9. [DOI] [PubMed] [Google Scholar]
- 41. Bosy-Westphal A, Muller MJ. Measuring the impact of weight cycling on body composition: a methodological challenge. Curr Opin Clin Nutr Metab Care. 2014;17(5):396–400. [DOI] [PubMed] [Google Scholar]
Associated Data
This section collects any data citations, data availability statements, or supplementary materials included in this article.