Abstract
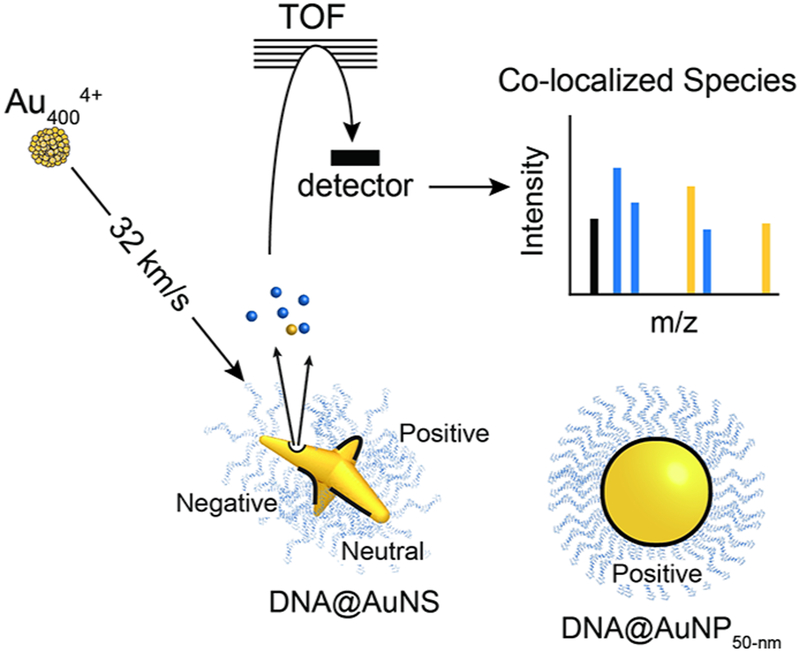
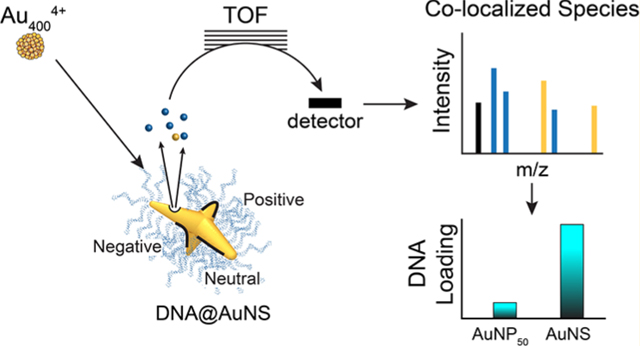
This paper describes a label free technique for determining ligand loading on metal nanoparticles using a variant of secondary ion mass spectrometry. Au4004+ clusters bombard DNA-functionalized anisotropic gold nanostars and isotropic nanospheres with similar surface areas to determine ligand density. For each projectile impact, co-localized molecules within the emission area of a single impact (diameter of 10–15 nm) were examined for each particle. Individual nanoparticle analysis allows for determination of the relationship between particle geometry and DNA loading. We found that branched particles exhibited increased ligand density versus nanospheres and determined that positive and neutral curvature could facilitate additional loading. This methodology can be applied to optimize loading for any ligand–core interaction independent of nanoparticle core, ligand, or attachment chemistry.
Graphical Abstract
Gold nanoparticles have emerged as a useful probe for biological systems because of their functionality, easy characterization, and biological compatibility. Attaching molecules like DNA to the surface of nanoparticles stabilizes the particles in culture media1,2 and provides functionality.3–6 Additionally, the nanoscopic environment created by the shape and curvature of the nanoparticle changes the chemical properties of the tethered molecules.7,8 The curvature of nanoparticles can alter the distribution,9 concentration,8,10,11 or pKa7 of surface ligands, which can affect the structure of absorbed proteins9 and the therapeutic efficacy of each nanoparticle.12,13 Specifically, how nanoparticles interact with cellular systems depends on the surface area:volume ratio of the core.13–16 Therefore, studying the fundamental relationships between single nanoparticles and ligands could reveal information about multivalent effects and energy–charge transfer.17–9
Concurrent characterization of the nanoparticle core and attached ligands is essential for maximizing the efficacy of the designed nanoconstruct. Common methods for nanoparticle characterization are based on electron microscopy due to its high spatial resolution. However, electron microscopy has proven to be challenging as a method for determining the distribution of ligands on the surface of a metal nanoparticle due to the large contrast difference between the high-Z elements of the core and the low-Z elements of the ligands.20,21 Consequently, current quantification of the ligand distribution on metal nanoparticle surfaces is limited to ensemble methods: indirect measurements (e.g., unbound ligand SERS detection22), labeled ligands (e.g., fluorescently tagged ligands23–25 or dye molecules26), or elemental analysis (e.g., Au and S via inductively coupled plasma mass spectrometry27). These measurements do not provide an accurate analysis of ligands on individual nanoconstructs and do not evaluate how the ligands interact with the environment. Studies using X-ray photoelectron spectroscopy (XPS) have shown that ligand coverage can be evaluated on flat surfaces and symmetrical nanoparticles.28–31 XPS measurements can reveal the interaction between metal atoms or metal nanoparticles with DNA, identifying the interaction sites for neutral and charged metal atoms with DNA molecules.32 While single-particle measurements of fluorophore-labeled ligands have been achieved,23,33 high-throughput analysis with such methods is limited. To gain statistically relevant data and determine how curvature influences collective and multivalent ligand properties, measurements need to be taken on a large number of intact, individual particles.
Time of flight secondary ion mass spectrometry (TOF-SIMS) is well suited for analyzing nanoscale surfaces due to high lateral (ca. 100–400 nm) and depth resolution (ca. 5–10 nm).34,35 We used a variant of TOF-SIMS, event-by-event detection mode, that uses individual projectiles to analyze single nanoparticles.36 The method has two innovative features: (1) the mode of bombardment and recording of the secondary ions and (2) impacting the surface with relatively massive 2 nm projectiles (Au4004+) that produces abundant secondary ion emissions from the sample.37 This one-of-a-kind tool is suited for the quantification of the ligand distribution on an individual metal nanoparticle independent of morphology and method of ligand attachment (e.g., covalent or electrostatic bonds). By stochastically sampling with a few million projectile impacts, statistical tools can be used to evaluate correlations among co-emitted species. Grouping projectile impacts on like objects and evaluating the number and type of co-emitted ligand species allow the ligand loading to be determined.
In this work, we directly quantified label free ligands on single nanoparticles with similar surface areas but different morphologies. Specifically, Au nanostars (AuNS) were sorted on the basis of the size and shape and 50 nm nanospheres. TOF-SIMS in event-by-event detection mode was used to quantify the number and position of bound ligands in positive, negative, or neutral nanoconstruct surfaces. We found that the ligand loading of a nanosphere (positive curvature only) was lower than that of AuNS with varying amounts of negative, neutral, and positive curvature. Within the sorted AuNS fractions, we determined that particles with a greater amount of negative curvature had loading efficiencies lower than those of AuNS with larger amounts of positive and neutral curvature.
EXPERIMENTAL SECTION
Secondary Ion Mass Spectroscopy.
Scheme 1 shows a simplified setup of the experimental approach; a detailed instrumental scheme has been previously reported.36 The instrumental setup was designed to bombard a sample with one projectile at a time and record the secondary ions from each impact separately. These ions are concurrently mass analyzed by TOF and recored before the subsequent projectile impact, enabling chemical characterization at the nanoscale. SIMS analysis was performed using custom-built instrumentation equipped with a gold liquid metal ion source (LMIS), which produces the gold projectiles used to bombard the sample.
Scheme 1.
aEach projectile was separated in time and space and upon impacting the sample causes emission from a volume that is 10–15 nm in diameter. For each projectile impact, the co-emitted ions are mass analyzed by TOF and collected in a mass spectrum. This scheme is not to scale.
In brief, Au4004+ projectiles were produced by a LMIS and selected with a Wien filter, both of which are installed on the 120 kV platform to increase the bombardment energy. After exiting the high-voltage platform, the beam of Au4004+ was pulsed at a rate of 1000 projectiles per second (0.1 projectile per pulse), ensuring each projectile was separated in time and space. The sample was biased to −10 kV, resulting in a total projectile kinetic energy of 520 keV for Au4004+. A weak magnetic field was used to separate the emitted electrons from the negative secondary ions to direct the electrons to a microchannel plate-based detector. The detected electrons act as the start of the TOF measurement. The secondary ions continued through the magnetic field and were mass analyzed with a reflectron TOF mass spectrometer (mass resolution, full width at half-maximum, at m/z 48 = 1600). The detector was microchannel plate-based with a circularly symmetric anode segmented into eight parts, which allows for up to eight isobaric ions to be detected from a single impact. For each projectile impact, the start and stop signals were collected by a multistop time-to-digital converter (TDCV4, Institute of Nuclear Physics, Orsay, France) and then stored in a personal computer as an individual mass spectrum. The gold nanoconstruct samples were stochastically analyzed with 2–4 × 10⁶ Au4004+ projectiles on an area with a radius of ca. 125 μm, corresponding to 2–4 × 10⁶ individual mass spectra for each sample. In the SIMS analysis, ca. 0.3% of the surface was analyzed stochastically; thus, each projectile impacted an unperturbed portion of the sample (super static regime).
Nanoparticle Synthesis and Information.
AuNS were synthesized using gold(III) chloride trihydrate, HAuCl4 (Sigma-Aldrich, St. Louis, MO), in Good’s buffer 4-(2-hydroxyethyl)-1-piperazineethanesulfonic acid, HEPES buffer (Sigma-Aldrich), both a shape and reducing agent, to produce anisotropic gold nanoparticles with branches varying in number and size.38 The 1 M stock HEPES solution was made by dissolving the buffer salt in Millipore water (18.2 MΩ cm) using a medium-sized stir bar to ensure thorough mixing. The pH of the HEPES solution was measured using a Thermo Scientific pH meter and adjusted using concentrated solutions of NaOH. For fine pH adjustments, HCl was added dropwise. AuNS were synthesized by adding 0.2 mM (final concentration) HAuCl4 to 100 mM HEPES buffer. Each solution was vortexed in a 50 mL Falcon tube for 1 min before the addition of HAuCl4 and for 1 min afterward. After vortexing, the growth solution was left undisturbed at room temperature for 24 h. Au nanospheres of varying diameters (5, 10, 20, 30, 40, 60, 80, 100, and 150 nm) were purchased from Sigma-Aldrich.
Density Gradient Centrifugation (DGC).
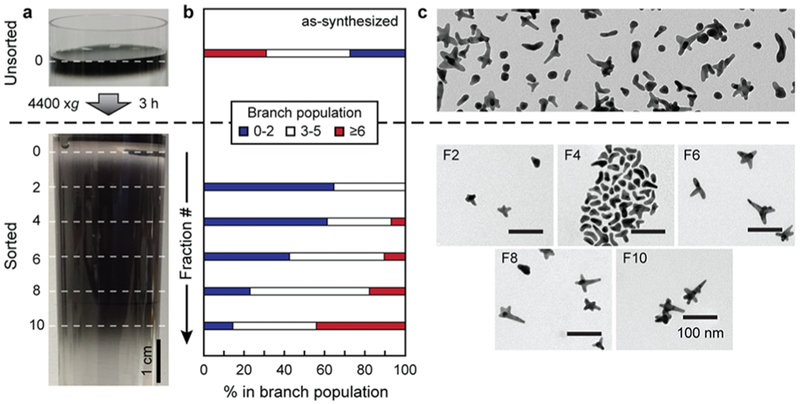
DGC was used to separate AuNS on the basis of size and shape. The sorted AuNS were analyzed separately to understand how differences in shape and curvature (positive, negative, and neutral) affected DNA loading. Sucrose density gradients were formed using a gradient maker (BioComp Instruments, Fredericton, NB) with 9 mL starting solutions of 50% and 60% (w/v) sucrose in water. On the basis of previous methods,39 we created a linear gradient through a custom mixing program alternated five times between the following two steps: (1) time of 5 s, angle of 76°, and speed of 30 rpm and (2) time of 15 s, angle of 76°, and speed of 0 rpm. For DGC, 500 μL of a concentrated solution of bare AuNS (35–40 nM) was layered on top of the density gradient in an Ultra-Clear SW28 centrifuge tube (Beckman Coulter, Pasadena, CA) and then centrifuged at 4400g for 3 h using a Thermo Fisher Scientific Sorvall Legend XT 120v benchtop centrifuge (Thermo Fisher Scientific, Waltham, MA). The samples were fractionated at intervals of 4 mm from the meniscus. Each of the 10 fractions, F1–F10, was dialyzed in Thermo Fisher 20K Slide-A-Lyzer Dialysis Cassettes for 24 h to remove sucrose from the solution (Thermo Fisher Scientific). The as-synthesized and sorted solutions were characterized by ultraviolet–visible spectroscopy to measure the bulk optical properties and by transmission electron microscopy (TEM) to visualize individual AuNS. Particles with a greater number of branches, longer branches, and a larger overall size tended to sediment to the bottom of the gradient, while particles closer in shape to a small sphere moved more slowly through the gradient. These characteristic differences between nanospheres and heterogeneous AuNS allowed for sorting based on structural features.
Particle Characterization Techniques.
Three milliliters of a AuNS solution was placed in a 1 cm plastic Brookhaven cuvette, and the absorbance spectra were measured from 400 to 1400 nm using a Cary 5000 ultraviolet–visible–near-infrared spectrophotometer (Agilent Technologies, Santa Clara, CA).
Characterization of the size and shape of the AuNS was undertaken using TEM. The TEM grids, carbon Type B, 300 mesh copper grids (Ted Pella, Redding, CA), were treated with 0.1% (w/v) poly-L-lysine (Sigma-Aldrich) for 5 min prior to particle attachment. The particles were deposited by pipetting 40 μL of a 10-fold concentrated Au nanoparticle solution onto prepared TEM grids. The samples were left to rest on the treated grids for 30–60 s, after which the solution was wicked away with filter paper. A JEOL 1230 TEM instrument (JEOL Ltd., Tokyo, Japan) was used to image the particles with an 80 kV accelerating potential. Representative images were collected from different areas of the grid. Structural features, such as circularity and Feret diameter, were characterized using the Analyze Particles plugin on ImageJ for ≥500 particles per sample. A circularity threshold of 0.8 was used to define spherical particles. The Feret diameter, which corresponds to the largest tip-to-tip distance on a particle, was also measured. The branch number was manually counted from at least 10 different zoomed-out images for ≥400 particles in each fraction. The branch length and the number of branches were measured manually from the tip to the base of the branch.
Surface Area and Volume Characterization.
We created a standard curve (Figure S1) of surface area using nine Au nanospheres (5, 10, 20, 30, 40, 60, 80, 100, and 150 nm) that were functionalized with a small molecule, thiolated Gd chelates.40 Because the Gd chelates present little steric hindrance to bind to the surface of gold nanoparticles, the number of Gd chelates on the surface of gold nanospheres of known diameter can be compared to the number of AuNS, estimating the surface area of the AuNS. The nanosphere solutions and sorted AuNS fractions were vortexed with a 100-fold excess of Gd chelate for 12–24 h with 0.01% TWEEN. The Gd/nanoparticle solutions were purified through three rounds of centrifugation (9600 rcf, 10 min) and resuspension in Milli-Q water.
Au and Gd quantification was performed by acid digestion of samples followed by inductively coupled plasma mass spectrometry [ICP-MS analysis on a Thermo iCap QC ICP-MS instrument (Thermo Fisher Scientific)]. ICP-MS samples were digested in a 1:1 nitric acid/hydrocholoric acid (HNO3, >69%; TraceSelect HCl, 37%) mixture. Milli-Q water and a multielement internal standard containing Bi, Ho, In, Li, Sc, Tb, and Y (Inorganic Ventures, Christiansburg, VA) were added to produce a solution of 2% (v/v) HNO3, 2% (v/v) HCl, and 5.0 ng/mL internal standard up to a final volume of either 3 or 10 mL. Serial dilutions of Gd and Au standards (Inorganic Ventures) were prepared in the same matrix as the samples. The Gd/AuNS were then interpolated on the Au nanoparticle standard to determine the surface area per particle.
Synthesis of DNA-Functionalized Nanoparticles.
We functionalized even-numbered AuNS fractions (F2, F4, F6, F8, and F10) and 50 nm nanospheres with single-stranded 24mer poly-T DNA by deprotection of the disulfide and salt aging.41 The 24mer poly-T was chosen to limit the different types of secondary ions for this proof of concept experiment. Functionalized nanoparticles were purified by three rounds of centrifugation (10000 rpm, 10 min) and resuspension in Milli-Q water with 0.01% TWEEN. The samples were stored at 4 °C after synthesis.
Sample Storage and Preparation for SIMS Analysis.
DNA-functionalized nanoparticles were prepared for SIMS analysis using the MarangoniFlow-Assisted method on cleaned 1 cm × 1 cm silicon wafers.42 This method ensured sufficient isolation between individual particles to allow for measurements of individual particles (Figures S2–S4).
RESULTS AND DISCUSSION
Separation and Characterization of Sorted HEPES AuNS.
The AuNS synthesis conditions produced heterogeneous particles with zero to eight branches with varying curvatures (Figure 1 and Figure S5) and an average surface area per particle similar to that of a 50 nm nanosphere. Rate-zonal DGC, as described in our previous work,39 created enriched populations of AuNS; each fraction showed greater particle homogeneity than the unsorted solution. Additionally, the fractions exhibited different surface areas per volume of particles, which demonstrated the change in curvature between the fractions (Figure S6). An increasing fraction number corresponds to an increase in the number of branches, branch length, and particle volume.
Figure 1.
(a) Photographs of a centrifuge tube before (top) and after (bottom) centrifugation of a concentrated AuNS solution in a sucrose linear density gradient. (b) Branch number distribution within each fraction based on manual branch counting of ≥400 particles per fraction. (c) TEM images (scale bar of 100 nm) of unsorted AuNS (top) and different fractions after DGC (bottom).
Quantification of Co-Emitted Species through TOF-SIMS.
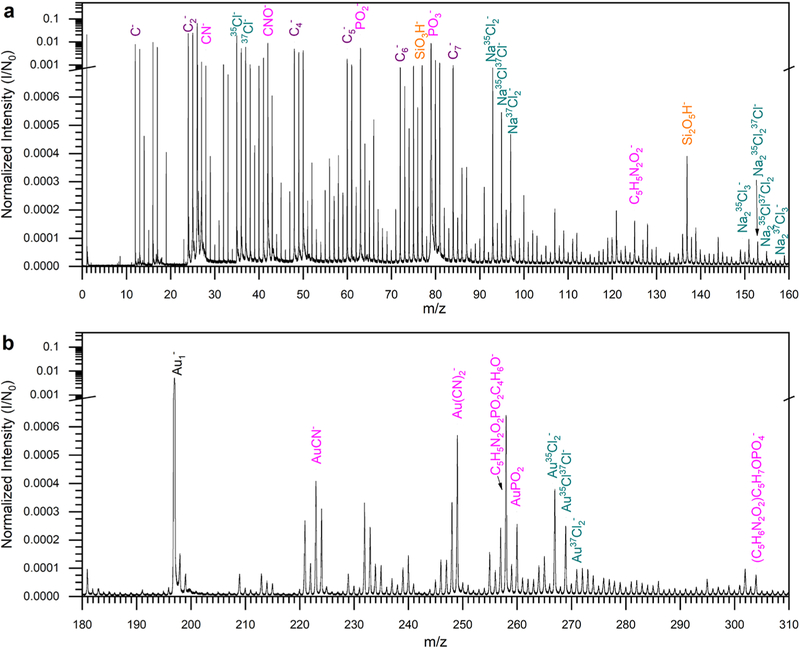
We analyzed the AuNS and 50 nm nanospheres using SIMS with individual projectiles. From these individual mass spectra, characteristic ions were identified and grouped together on the basis of the type of species: carbon (purple), the Si support (orange), AuNS (black), DNA (pink), and salt (green) (Figure 2 and Figure S7). These mass spectra are the summation of those of ions collected from all impacts on the surface. From the Si support, two silicon oxide clusters were observed: SiO3H− and Si2O5H−. Salt clusters formed due to preparation under aqueous conditions, NaxCly−. Three types of ions related to the nanoconstruct were observed: nine peaks related to the AuNS core (Aun−, where n = 1–9), seven peaks related to the DNA ligands (PO2−, PO3−, CN−, CNO−, C 5 H 5 N 2 O 2−, C 5 H 5 N 2 O 2 P O 2 C 4 H 6 O −, a n d C5H6N2O2PO4C5H7O−), and four peaks related to the Au− DNA adducts [AuCN−, Au(CN)2−, Au2CN−, and AuPO2−]. All regions of the sample were identified, and the results showed that every DNA-related species was co-localized with the AuNS.
Figure 2.
(a) m/z 0–160 and (b) m/z 180–310. Notable peaks are identified and color-coded: purple for carbon clusters, pink fore DNA-related, orange for silicon-related, green for salt, and black for Au clusters.
To evaluate the co-localization of species on the sample, i.e., ligand loading, we measured ions that were simultaneously emitted and correlated the rate of coemission. To calculate the rate of coemission, a characteristic ion was identified (coincidence ion) and all mass spectra that contain this ion were summed. Coemission mass spectra are presented in Figure S8A–D for each region on the sample surface: nanoconstructs, salt crystals, and silicon support. In the coemission spectra, the intensity of a second ion of interest (evaluated ion) was measured. The correlation coefficient between these two ions was determined (eq 1) and tested against a random correlation with a 99% confidence interval (see the Supporting Information and Figure S9).
| (1) |
where a and b are the evaluated and coincidence ions, respectively, Ia is the intensity of a, Ib is the intensity of b, and Ia,b is the intensity of the coemission of a with b.
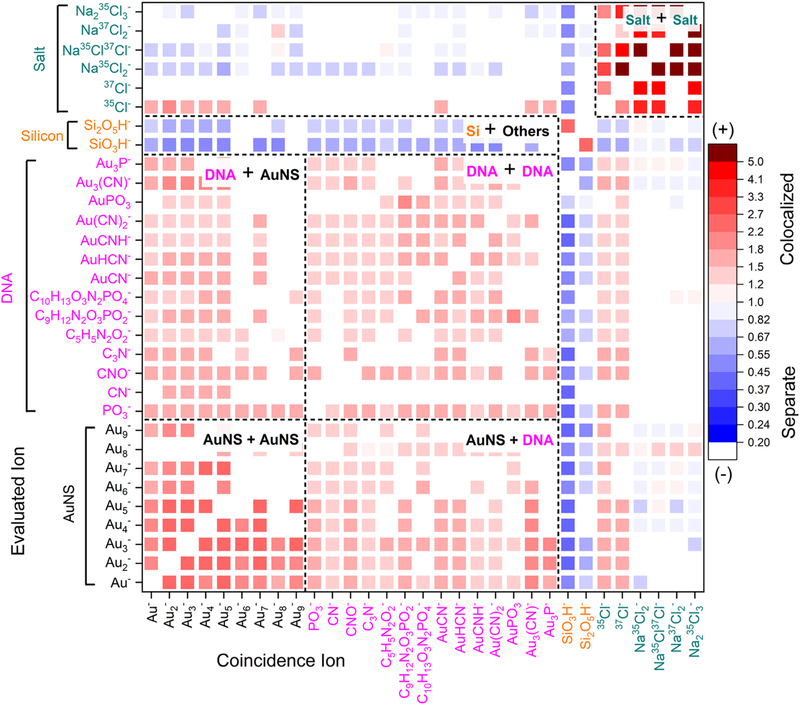
Figure 3 displays a representative two-dimensional heat map of low to medium branched AuNS (fraction 4), where this correlation test was performed pairwise on all characteristic ions. To demonstrate that all DNA coemissions were captured, every region of the sample was identified and displayed, including the silicon wafer and salt crystals (Figures S10–S14). Silicon oxide clusters (Si + Others) co-localized with only Si species. This Si co-localization demonstrated nanoconstructs were isolated from each other on the wafer between open regions. Additionally, we found that NaCl clusters were positively correlated with one another due to salt crystal formation (Salt + Salt); however, they exhibited negative correlation with all other species, which demonstrated no interactions with the DNA or AuNS measurements.
Figure 3.
Color scale of the correlation coefficient, with red corresponding to positive correlation and blue to negative correlation. Ions that do not have a significant correlation were not plotted. The evaluated ions are listed on the y-axis, and the coincidental mass spectrum is listed on the x-axis.
AuNS are represented by the small Au clusters (Aun, where n = 1–9) in the bottom left corner of the heat map. AuNS and DNA-related ions were positively correlated both to one another and to themselves but not to salt or Si-related species. Because a positive correlation means the secondary ions were co-emitted in the same impacts, the DNA and AuNS were within 10–15 nm of one another, demonstrating co-localization.
In SIMS, the observed intensity of an ion is a product of the number of ejected molecules, the chance that a molecule or fragment will become charged (ionization probability), the transmission of the mass spectrometer, and the detection efficiency; thus, the intensity does not directly reflect the species concentration. Comparing the intensity of an ion between different samples proves to be challenging, because changes in the chemical environment may affect ionization probability and skew the results. Thus, to compare between samples, multivariate analysis is often used. Here we used a correlation coefficient to compare between samples. A key advantage of the correlation coefficient as shown in eq 1 (correlation coefficient) is that the ionization probability of each ion appears in both the numerator and denominator and does not affect the calculation.43 The same is true for surface coverage (eq 2). Therefore, the DNA surface coverage of each AuNS fraction and the nanospheres can be compared.36 We evaluated the surface coverage of each sample component (e.g. silicon wafer, salt crystals, and AuNS) by identifying ions that originate from the same types of impacts, i.e., those with a positive correlation. We then determined the fraction of impacts (i.e., surface coverage) containing the two species together using the following equation:
| (2) |
where Ia is the intensity of a, Ib is the intensity of b, Ia,b is the intensity of the coemission of a with b, and N0 is the number of measurements.
The fraction of impacts occurring on the AuNS was calculated for all samples by selecting measurements in which two Au species were co-emitted (Figure S15). The number of impacts containing DNA was in good agreement with the number containing both DNA and Au, which verifies that the nanoconstructs were still intact upon sampling. However, only 65% of the impacts with DNA also contained the coemission of two Au species, which was needed to calculate the number of times a AuNS was bombarded. This difference could be due to two different effects. (1) AuNS coated with a single-stranded 24mer poly-T DNA may result in decreased emissions from underlying regions. Where ligands were bound to the nanoparticle, the Au4004+ projectile interacted with the ligand before striking the AuNS surface, which resulted in decreased Au emission. (2) The emission of Au clusters was affected by the asymmetric shape of the AuNS. The core of a particle has a greater number of Au atoms than the branches. The result was that impacts occurring on the core emit more gold than those occurring on the branches.44 Therefore, to compensate for these two effects, ligand coating and anisotropic shape, and compare the DNA distribution on different AuNS samples, we measured the relative coincidence yield and normalized to the 50 nm nanospheres.
Determination of the DNA Distribution per Particle with Varying Morphologies.
To determine the loading distribution, we selected a gold cluster (Au7−) that was detected in all nanoconstruct samples and then measured the DNA ions that were co-emitted. Particles with more ligand loading resulted in increased coemission of DNA-related ions with Au7−. This method takes into account only impacts occurring on the nanoconstructs while avoiding those containing the silicon support or salt. Using eq 3, we evaluated the coincidental yield, CY, of DNA ions when a gold cluster was detected, to determine DNA loading per particle:
| (3) |
where Ia,b is the intensity of the coemission of a with b, Nb is the number of impacts in which b was detected, and CYa,b is the coincidental yield of a in impacts in which b was detected.
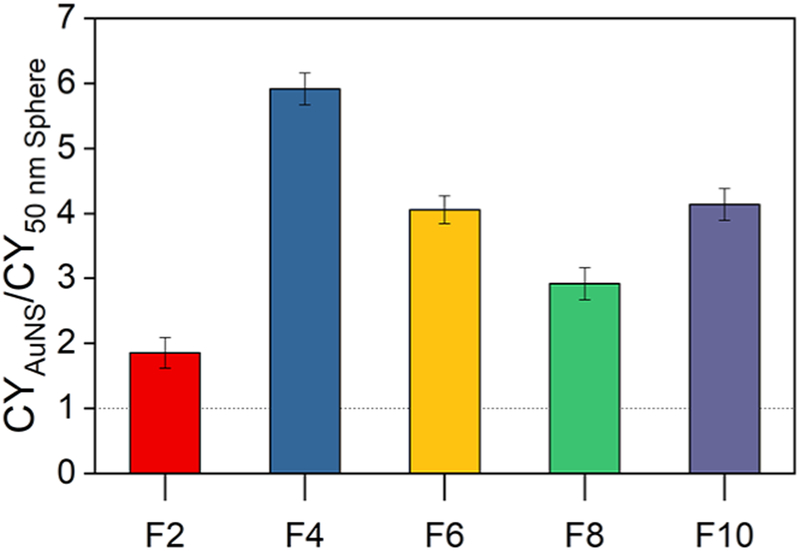
The DNA loading of each AuNS fraction (CY) was compared to that of the 50 nm nanospheres to determine shape or curvature effects by dividing CYAuNS by CY50 nm spheres. Figure 4 shows the CYAuNS/CY50 nm spheres ratio for thymine nucleotide (C5H6N2O2PO4C5H7O−) co-detected with Au7−. A similar trend was found for all DNA-related species. The dashed line at 1.0 represents the loading of a 50 nm nanosphere. The results showed that the CY was higher in all AuNS fractions than in the spheres. F4 AuNS, with approximately three branches per particle, displayed the highest relative CY, which indicates the highest density of DNA loading. The shape of AuNS in F4 increased the amount of neutral curvature compared to that of a 50 nm sphere but limited the amount of negative curvature, which optimized DNA functionalization on the particles. Fraction 2 (F2), a mixture of single-branch and small spherical particles, had the lowest loading. In fractions F6–F10, the number of branches increased and formed more regions of negative curvature where the branch meets the core. We hypothesize that an increase in negative curvature causes a decrease in DNA loading, due to steric hindrance, and therefore attribute the increased loading per particle to the positive and neutral curvature on the AuNS structure. The results presented here show that particle size and curvature influence ligand loading, specifically the abundance of positive and negative curvature. To optimize ligand loading, particle geometries with an abundance of positive curvature should be considered. The size and length of the target ligand would also need to be considered when determining the size and curvature of the nanoconstruct.
Figure 4.
CY ratio for C5H6N2O2PO4C5H7O− compared to that of the 50 nm spheres. F4 demonstrated 6-fold enhancement of loading compared with that of the spheres as shown through the CY ratio.
CONCLUSION
This study, carried out on size-selected AuNS, demonstrates the ability of TOF-SIMS with individual projectiles to determine shape-dictated DNA loading. We found that the amount of functionalized DNA on nanoparticles depended on their size and curvature. AuNS with branches increased the amount of loaded DNA versus that of 50 nm Au nanospheres. However, a greater branch number sterically hindered additional attachment, especially in regions of negative curvature where the branch meets the core. The methodology presented can be universally applied to probe any ligand- nanoparticle interaction. Previous experiments have shown that the particle size and shape alter the intensity and relative abundance of metal clusters emitted from metal particles. These findings suggest the method may be further developed to evaluate ligand loading with the concurrent identification of an individual particle’s size and shape.
Supplementary Material
ACKNOWLEDGMENTS
This work was supported by National Science Foundation (NSF) Grants CHE-1507790 (K.C. and T.W.O.), CHE-1808502 (E.E.C.), and CHE-1308312 (M.J.E. and E.A.S.) and the National Cancer Institute of the National Institutes of Health via Grant U54CA199091 (E.E.C. and T.W.O.). This work made use of the Northwestern University Keck Biophysics Facility supported by a Cancer Center Support Grant and the Biological Imaging Facility. Use of the Texas A&M University Materials Characterization Facility and the assistance of Dr. Bisrat are acknowledged. The authors are grateful for the use of EPIC of Northwestern University’s NUANCE Center, which has received support from the Soft and Hybrid Nanotechnology Experimental (SHyNE) Resource (NSF Grant NNCI-1542205), the MRSEC program (NSF Grant DMR-1121262) at the Materials Research Center, the International Institute for Nanotechnology (IIN), the Keck Foundation, and the State of Illinois, through the IIN.
Footnotes
Supporting Information
The Supporting Information is available free of charge on the ACS Publications website at DOI: 10.1021/acs.analchem.8b03715.
Calibration curve for nanoparticle surface area, surface area per volume for each AuNS fraction, SEM images of prepared samples, low-magnification TEM images of sorted AuNS, mass spectra of gold AuNS, two-dimensional correlation heat maps of each sample, calculated surface coverage of each sample, and a description of the statistical test for determining significant relationships (PDF)
The authors declare no competing financial interest.
REFERENCES
- (1).Fang C; Bhattarai N; Sun C; Zhang MQ Small 2009, 5, 1637–1641. [DOI] [PMC free article] [PubMed] [Google Scholar]
- (2).Surette MC; Nason JA Environ. Sci.: Nano 2016, 3, 1144–1152. [Google Scholar]
- (3).Sokolov K; Follen M; Aaron J; Pavlova I; Malpica A; Lotan R; Richards-Kortum R Cancer Res. 2003, 63, 1999–2004. [PubMed] [Google Scholar]
- (4).Kennedy LC; Bickford LR; Lewinski NA; Coughlin AJ; Hu Y; Day ES; West JL; Drezek RA Small 2011, 7, 169–183. [DOI] [PubMed] [Google Scholar]
- (5).Huang XH; Jain PK; El-Sayed IH; El-Sayed MA Lasers in Medical Science 2008, 23, 217–228. [DOI] [PubMed] [Google Scholar]
- (6).Huang XH; Jain PK; El-Sayed IH; El-Sayed MA Nanomedicine 2007, 2, 681–693. [DOI] [PubMed] [Google Scholar]
- (7).Walker DA; Leitsch EK; Nap RJ; Szleifer I; Grzybowski BA Nat. Nanotechnol 2013, 8, 676–681. [DOI] [PubMed] [Google Scholar]
- (8).Hill HD; Millstone JE; Banholzer MJ; Mirkin CA ACS Nano 2009, 3, 418–424. [DOI] [PMC free article] [PubMed] [Google Scholar]
- (9).Sang LC; Coppens MO Phys. Chem. Chem. Phys 2011, 13, 6689–6698. [DOI] [PubMed] [Google Scholar]
- (10).Zhang X; Liu BW; Dave N; Servos MR; Liu JW Langmuir 2012, 28, 17053–17060. [DOI] [PubMed] [Google Scholar]
- (11).Hurst SJ; Lytton-Jean AKR; Mirkin CA Anal. Chem 2006, 78, 8313–8318. [DOI] [PMC free article] [PubMed] [Google Scholar]
- (12).Dam DHM; Lee H; Lee RC; Kim KH; Kelleher NL; Odom TW Bioconjugate Chem. 2015, 26, 279–285. [DOI] [PMC free article] [PubMed] [Google Scholar]
- (13).Massich MD; Giljohann DA; Schmucker AL; Patel PC; Mirkin CA ACS Nano 2010, 4, 5641–5646. [DOI] [PMC free article] [PubMed] [Google Scholar]
- (14).Sajanlal PR; Sreeprasad TS; Samal AK; Pradeep T Nano Rev. 2011, 2, 5883. [DOI] [PMC free article] [PubMed] [Google Scholar]
- (15).Giljohann DA; Seferos DS; Patel PC; Millstone JE; Rosi NL; Mirkin CA Nano Lett. 2007, 7, 3818–3821. [DOI] [PMC free article] [PubMed] [Google Scholar]
- (16).Mu QX; Jiang GB; Chen LX; Zhou HY; Fourches D; Tropsha A; Yan B Chem. Rev 2014, 114, 7740–7781. [DOI] [PMC free article] [PubMed] [Google Scholar]
- (17).Cutler JI; Auyeung E; Mirkin CA J. Am. Chem. Soc 2012, 134, 1376–1391. [DOI] [PubMed] [Google Scholar]
- (18).Gao J; Huang XY; Liu H; Zan F; Ren JC Langmuir 2012, 28, 4464–4471. [DOI] [PubMed] [Google Scholar]
- (19).Dalal C; Saha A; Jana NR J. Phys. Chem. C 2016, 120, 13324–13324. [Google Scholar]
- (20).He F; Van Espen PJ Anal. Chem 1991, 63, 2237–2244. [Google Scholar]
- (21).Choël M; Deboudt K; Osán J; Flament P; Van Grieken R Anal. Chem 2005, 77, 5686–5692. [DOI] [PubMed] [Google Scholar]
- (22).Zhang DM; Ansar SM Anal. Chem 2010, 82, 5910–5914. [DOI] [PubMed] [Google Scholar]
- (23).Fu B; Isaacoff BP; Biteen JS ACS Nano 2017, 11, 8978–8987. [DOI] [PubMed] [Google Scholar]
- (24).Donehue JE; Wertz E; Talicska CN; Biteen JS J. Phys. Chem. C 2014, 118, 15027–15035. [Google Scholar]
- (25).Yu HX; Xu XW; Liang PP; Loh KY; Guntupalli B; Roncancio D; Xiao Y Bioconjugate Chem. 2017, 28, 933–943. [DOI] [PMC free article] [PubMed] [Google Scholar]
- (26).Wertz EA; Isaacoff BP; Biteen JS ACS Photonics 2016, 3, 1733–1740. [Google Scholar]
- (27).Hinterwirth H; Kappel S; Waitz T; Prohaska T; Lindner W; Lammerhofer M ACS Nano 2013, 7, 1129–1136. [DOI] [PMC free article] [PubMed] [Google Scholar]
- (28).Lee C-Y; Gong P; Harbers GM; Grainger DW; Castner DG; Gamble LJ Anal. Chem 2006, 78, 3316–3325. [DOI] [PubMed] [Google Scholar]
- (29).Belsey NA; Shard AG; Minelli C Biointerphases 2015, 10, No. 019012. [DOI] [PubMed] [Google Scholar]
- (30).Baer D; Engelhard MJ Electron Spectrosc. Relat. Phenom 2010, 178–179, 415–432. [Google Scholar]
- (31).Rafati A; Shard AG; Castner DG Biointerphases 2016, 11, No. 04B304. [DOI] [PMC free article] [PubMed] [Google Scholar]
- (32).Volkov IL; Smirnova A; Makarova AA; Reveguk ZV; Ramazanov RR; Usachov DY; Adamchuk VK; Kononov AI J. Phys. Chem. B 2017, 121, 2400–2406. [DOI] [PubMed] [Google Scholar]
- (33).Blythe KL; Willets KA J. Phys. Chem. C 2016, 120, 803–815. [Google Scholar]
- (34).Winograd N Anal. Chem 2015, 87, 328–333. [DOI] [PMC free article] [PubMed] [Google Scholar]
- (35).Seah MP; Spencer SJ; Havelund R; Gilmore IS; Shard AG Analyst 2015, 140, 6508–6516. [DOI] [PubMed] [Google Scholar]
- (36).Eller MJ; Verkhoturov SV; Schweikert EA Anal. Chem 2016, 88, 7639–7646. [DOI] [PubMed] [Google Scholar]
- (37).DeBord JD; Fernandez-Lima FA; Verkhoturov SV; Schweikert EA; Della-Negra S Surf. Interface Anal. 2013, 45, 134–137. [DOI] [PMC free article] [PubMed] [Google Scholar]
- (38).Chandra K; Rugg BK; Ratner MA; Wasielewski MR; Odom TW J. Am. Chem. Soc 2018, 140, 3219–3222. [DOI] [PubMed] [Google Scholar]
- (39).Chandra K; Kumar V; Werner SE; Odom TW Acs Omega 2017, 2, 4878–4884. [DOI] [PMC free article] [PubMed] [Google Scholar]
- (40).Culver KSB; Shin YJ; Rotz MW; Meade TJ; Hersam MC; Odom TW J. Phys. Chem. C 2016, 120, 22103–22109. [DOI] [PMC free article] [PubMed] [Google Scholar]
- (41).Dam DH; Lee RC; Odom TW Nano Lett. 2014, 14, 2843–2848. [DOI] [PMC free article] [PubMed] [Google Scholar]
- (42).Majumder M; Rendall CS; Eukel JA; Wang JYL; Behabtu N; Pint CL; Liu TY; Orbaek AW; Mirri F; Nam J; Barron AR; Hauge RH; Schmidt HK; Pasquali MJ Phys. Chem. B 2012, 116, 6536–6542. [DOI] [PubMed] [Google Scholar]
- (43).Rickman RD; Verkhoturov SV; Parilis ES; Schweikert EA Phys. Rev. Lett 2004, 92, No. 047601. [DOI] [PubMed] [Google Scholar]
- (44).Liang CK; Verkhoturov SV; Chen LJ; Schweikert EA Int. J. Mass Spectrom. 2013, 334, 43–48. [Google Scholar]
Associated Data
This section collects any data citations, data availability statements, or supplementary materials included in this article.


