

LETTER TO EDITOR
In multiple myeloma (MM), increased angiogenesis of the bone marrow (BM) involves a complex interplay of proangiogenic and antiangiogenic molecules induced by plasma cells (PC) within the BM microenvironment, with eventual balance tipped in favor of an ‘angiogenic switch’ as the disease transitions to MM from preceding monoclonal gammopathy of unknown significance (MGUS) and smoldering multiple myeloma (SMM).1, 2 The dynamic nature of angiogenesis can be exploited by highly active anti-myeloma agents such as thalidomide, its derivatives, the immunomodulatory drugs (IMiDs™), and proteasome inhibitors, which not only interfere with tumor vessel growth, but also cause significant regression of the tumor vasculature both in vitro and in vivo. Therefore, there is great interest in studying the role of angiogenesis in MM to define therapeutic targets, prognostic and predictive biomarkers, as well as monitor disease activity longitudinally.
In this prospective clinical trial, we evaluated 30 patients with MGUS, SMM and MM to comprehensively characterize the levels of angiogenesis from MGUS to frank malignancy. We compared angiogenesis using three parallel approaches: i) BM microvessel density (MVD), ii) dynamic contrast-enhanced magnetic resonance imaging (DCE-MRI) of lumbar vertebrae, and iii) serum panel of 17 angiogenic markers. Subjects (12 males and 18 females, with a median age 58.5 years) with Eastern Cooperative Oncology Group performance status of 0–2, diagnosed in accordance with standard criteria were included.3 This study was approved by the National Cancer Institute Institutional Review Board; informed consent was obtained from every patient. Immunohistochemistry was performed on sections of B-Plus fixed-paraffin embedded posterior iliac crest BM core biopsies using anti-CD34 (clone QBEnd 10, DAKO, Carpinteria, CA) and anti-CD138 (clone B-A38, Cell Marque, Rocklin, CA) antibodies on automated stainer according to manufacturer instructions. Stained slides were microscopically evaluated in a blinded fashion and results reviewed by an experienced pathologist (IM) (Figure 1). From the dynamic imaging data obtained with DCE-MRI, curves were generated to mathematically fit a two compartment pharmacokinetic model.4 In this model, an injected contrast agent leaks into the extravascular, extracellular space (EES) at a rate predicted by the vessel’s permeability and surface area. Angiogenic vessels would be expected to be very leaky and thus have a rapid forward leakage rate and back flow. Based on this, the kinetic parameters Ktrans (transendothelial transport of gadolinium from vascular compartment to the tumor interstitium [wash in]), and kep (reverse transport of gadolinium back into the vascular space [wash out]), were calculated. Serum analysis included a panel of 17 vascular biomarkers (listed in table 1B) using MILLIPLEX MAP human angiogenesis/growth factor magnetic bead panel (Millipore, Billerica, MA). For statistical analysis, the association among continuous parameters was determined by Spearman rank correlation. Trends in continuous parameters according to categorical parameter (MGUS<SMM<MM) were determined by a Jonckheere-Terpstra test for trend. The parameters were compared using an exact Wilcoxon rank sum test when divided into two groups.
Figure 1: Associations between DCE-MRI and MVD Immunohistochemistry by CD34 stain (left) and DCE-MRI images (right) of high and low vascularity.
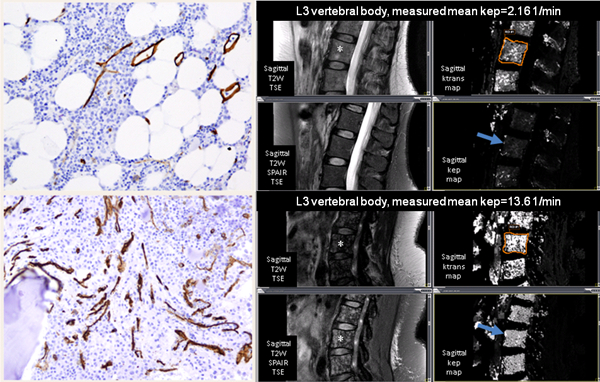
* Patient in the top section has low vascularity and patient in the bottom section has high vascularity. Permeability related pharmacokinetic parameters, kep and Ktrans, were measured at L3 vertebra (shown by asterisk). The mean kep (shown by arrow) for patient with low vascularity is 2.16 per minute, and for patient with high vascularity is 13.6 per minute. MR imaging was performed on a 3 Tesla MR system (Philips Achieva, Best, The Netherlands) with dedicated receiver only phased array coils. MR imaging consisted of sagittal T2-weighted turbo-spin-echo (TSE) (TR/TE = 3000/120msec, slice thickness of 4 mm, 30 cm field of view, and matrix of 248×297) and T2-weighted spectral selection attenuated inversion recovery (SPAIR) sequences used to visualize the lumbosacral spine anatomically. Then, unenhanced sagittal T1-weighted images (TR/TE=6.4/2.3msec, with 5° Flip Angle (FA), 4 mm-thick sections, 32 cm field of view, and matrix of 124×246) were obtained with a three-dimensional spoiled gradient- echo sequence and the DCE-MR sequence (TR/TE=6.4/2.3msec, FA 15°, 4 mm-thick sections through the entire lumbosacral spine, 30cm field of view and acquisition time of 15 seconds per phase, matrix of 124×246) were obtained with a three-dimensional spoiled gradient-echo sequence at a sagittal plane. After three baseline unenhanced phases, an automatic injector (Medrad Spectris, Indianola, PA, USA) was used to intravenously infuse gadopentetate dimeglumine (Magnevist; Bayer Healthcare Pharmaceuticals, Wayne, NJ, USA) at 3mL/sec, for a total of 0.1 mmol per kilogram of body weight (typically 15–20mL), followed by 20 mL normal saline flush. Total 23 phases were acquired at 30 second intervals for a total of 8 minutes.
Table 1A:
Comparison of Microvessel density (MVD), kep, and Ktrans among patients with monoclonal gammopathy of undetermined significance (MGUS), smoldering multiple myeloma (SMM) and multiple myeloma (MM)
| MGUS (n = 10) |
SMM (n = 10) |
MM (n = 7) |
P | |
|---|---|---|---|---|
| MVD | 15 (15–19.7) | 19.4 (7.6–32.5) | 20.9 (10.5–37.6) | 0.008 |
| kep | 3.9 (1.6–9.2) | 9 (0.7–12.2) | 5.8 (2.1–12.7) | 0.15 |
| Ktrans | 2.4 (1–4.2) | 2.3 (0.4–4.4) | 3.1 (1.6–4.1) | 0.33 |
MVD was estimated by determining the average number of CD34-stained microvessels in 10 areas of maximal MVD counted at a high power field (hpf; ×500 magnification). Large vessels and vessels in the periosteum or bone were excluded. Areas of staining with no discrete breaks were counted as a single vessel. The presence of a lumen was not required. The MVD results were expressed as average number of microvessels per hpf.
Three patients with multiple myeloma did not undergo bone marrow biopsies and were not included in this analysis
The results showed that while MVD was low in samples of BM obtained from patients with MGUS (median, 15.0), it increased in those with SMM (median, 19.4) and MM (median, 20.9) (Table 1A). MVD linearly increased along the myeloma spectrum (MGUS<SMM<MM) (Table 1A; P=0.008). DCE-MRI obtained kep and Ktrans values are listed in table 1A. Higher kep and MVD were seen in MM/SMM vs. MGUS patients (kep median 7.1 vs. 3.9; P=0.08; MVD median 20.30 vs. 15.00; P=0.01) (Table 1B). MVD and kep were moderately strongly correlated in all patients (r=0.59; P=0.001). Ktrans was weakly to moderately well correlated with MVD (r=0.43; P=0.03). Circulating levels of Ang2 (P=0.02), GCSF (P=0.06), follistatin (P=0.06), HGF (P=0.01), and VEGFA (P=0.02), were elevated in MM/SMM patients in comparison to MGUS (Table 1B). The levels of HGF (r=0.45; P=0.02), Ang2 (r=0.37; P=0.06), and VEGFD (r=−0.36; P=0.07), were weakly to moderately well correlated with kep. However, there was no correlation between any of the tested angiogenic biomarkers and MVD.
Our prospective clinical trial reaffirms and expands on the results from prior cross-sectional studies showing that the degree of angiogenesis, as determined by MVD, progressively increases from MGUS to SMM to MM.5 Furthermore, we found a positive correlation between DCE-MRI vascular biomarkers (kep and Ktrans) obtained at lumbar spine, and BM MVD. These findings reflect that in the process of the augmentation of microcirculation from precursor to MM, the new sprouting blood vessels are accompanied with altered tumor vascular permeability. Our findings are in keeping with the concept of the angiogenic switch that supports MGUS as “prevascular phases” of PC tumors, while the SMM and MM is the “vascular phase”.2
Although MVD remains an important tool to determine BM angiogenesis, there are several technical limitations of this method, such as inter-observer variability in counting vessels, and antibodies (e.g., CD34, CD31, von Willebrand factor, or CD105) used for immunostaining. Moreover, this method is inherently invasive and quite challenging for serial sampling, is location-dependent, and cannot determine whether vascular flow is present or whether the vessel is hyper permeable. DCE-MRI, on the other hand, allows noninvasive quantification of altered diffusion, volume, and flow permeability characteristics of neovessels. DCE-MRI measured vascular parameters, kep and Ktrans, in our study showed moderately strong correlation with MVD. Our findings have been substantiated in other studies. For example, Hillengass et al. evaluated DCE MRI of the lumbar spine in 222 patients with MGUS, SMM, and MM and 22 healthy controls.6 They found a significant difference in kep between normal controls vs. SMM, normal controls vs. MM, and MGUS vs. MM; one of their asymptomatic patients with increased kep progressed within 6 months of imaging. Per study protocol, our clinical trial was designed to assess vascular markers at one time point only, so sequential information on changes in kep and Ktrans after treatment or progression is not available. However, in another study, statistically significant reduction in kep was noted post-treatment with thalidomide plus chemotherapy, but not after thalidomide alone.7 Standardization of DCE-MRI biomarkers may be challenging, as these parameters are biophysical signals, unlike serological and histological biomarkers, which are analytes. Also the tumor vasculature is intrinsically heterogeneous; as a result regions of interest may not be representative of changes occurring in response to disease progression or to antiangiogenic therapy in other parts.8 Finally, DCE-MRI may not be feasible for some patient groups, especially for individuals with renal failure, implanted metallic devices, or severe claustrophobia.
Angiogenic cytokines secreted by malignant PCs, BM stromal cells and endothelial cells are involved in angiogenesis.9 In this study, we measured 17 serum biomarkers proposed to influence angiogenesis. We show that the levels of some (Ang2, GCSF, follistatin, HGF, and VEGF-A) but not all biomarkers were increased in MM/SMM patients in comparison to MGUS. In other studies, the levels of serum angiogenic markers such as VEGF and FGF-2 were similar in different stages of MGUS and MM, and did not predict response to therapy.10, 11 Several prior studies have looked at the correlation of angiogenic cytokines and MVD. In concordance with the results of our study, some of the studies12, 13 did not find a significant association between MVD and angiogenic cytokines.11, 14 On the other hand, Andersen et al. reported positive correlations between MVD and serum levels of syndecan-1 and HGF, but not with basic-FGF or interleukin-6.15 Across studies there is variation in the type of markers, treatment status, and methodologies, and although few biomarkers hold promise, none of them have the sensitivity or specificity to correlate adequately with MVD or predict disease progression. The correlation between DCE-MRI kep and HGF, Ang2, and VEGFD in our study suggests that these angiogenic cytokines may be important for neovascular hyper-permeability, and hence further exploration.
Looking forward, as more sophisticated tools become available to identify early myeloma, and as more refined therapeutic options with decreased toxicity are available, we may be seeing a trend for earlier intervention before symptoms develop. Establishing biomarkers associated with progression from MGUS and SMM to MM and that can be effectively targeted therapeutically remains an important challenge. It is possible that informative and accurate measurements of angiogenic biomarkers may prompt a clinician to initiate therapy sooner rather than later, or to decrease the surveillance interval of such patients with high risk SMM or perhaps high risk MGUS.
Per study design, the sample size of this study provided us with 80% statistical power to test our hypothesis. Our approach, including BM MVD, imaging vascular markers, and multiplex serum angiogenic markers, provides the most comprehensive evaluation of angiogenesis in MM and its precursor states. In summary, the results of this study support the theory that the degree of angiogenesis, as determined by MVD, progressively increases from MGUS to SMM to MM.2 Our findings indicate that functional information of tumor blood flow provided by DCE-MRI, in addition to the morphologic information provided by MVD, is a potential composite angiogenic endpoint for MM evolution that may be explored further. Angiogenic serum markers that can be assessed at multiple time points also need to be tested and validated in large, well-designed, prospective clinical trials before they are ready to be launched in the clinical setting.
Table 1B:
Comparison of MVD, kep, and serum angiogenic markers between MGUS and SMM/MM groups
| MGUS | SMM/MM | P | |
|---|---|---|---|
| MVD | 15.04 ± 1.14 | 21.64 ± 1.90 | 0.011 |
| kep per min | 4.05 ±0.73 | 6.93±0.97 | 0.08 |
| Ang2 (pg/ml) | 2465.97 ± 589.27 | 3804.42 ± 467.16 | 0.024 |
| GCSF (pg/ml) | 24.92 ± 11.66 | 101.08 ± 42.81 | 0.055 |
| Follistatin (pg/ml) | 562.45 ± 88.89 | 823.15 ± 83.00 | 0.055 |
| HGF (pg/ml) | 390.57 ± 70.82 | 654.34 ± 57.97 | 0.0098 |
| VEGFA (pg/ml) | 844.31 ± 435.94 | 1301.52 ± 196.47 | 0.02 |
The serum angiogenic markers included: angiopoietin (Ang-2), bone morphogenetic protein (BMP-9), epidermal growth factor (EGF), endoglin, endothelin-1, fibroblast growth factor (FGF) −1, FGF-2, follistatin, granulocyte-colony stimulating factor (G-CSF), heparin binding EGF-like growth factor (HB-EGF), hepatocyte growth factor (HGF), interleukin-8 (IL-8), leptin, placental-derived growth factor (PLGF), vascular endothelial growth factor (VEGF)-A, VEGF-C, and VEGF-D. The assay was performed according to the manufacturer’s protocol, and all samples were diluted 1:3. Cytokine values were calculated using a five-parameter standard curve with Bio-Plex Manager 6.1 (BioRad; Hercules, CA) and all values are reported as pg/mL. For one patient with SMM, serum was not available.
Serum measures of endothelin-1 and FGF-1 were below the range of detectability, so these markers were excluded from analysis.
ACKNOWLEDGEMENTS
This research was supported by the Intramural Research Program of the NIH, NCI. The study is listed at ClinicalTrials.gov, identifier NCT01237054.
Footnotes
CONFLICT OF INTEREST
The authors have no conflict of interest to declare.
REFERENCES
- 1.Hanahan D, Folkman J. Patterns and emerging mechanisms of the angiogenic switch during tumorigenesis. Cell 1996; 86(3): 353–64. [DOI] [PubMed] [Google Scholar]
- 2.Vacca A, Ribatti D, Roccaro AM, Frigeri A, Dammacco F. Bone marrow angiogenesis in patients with active multiple myeloma. Seminars in oncology 2001; 28(6): 543–50. [DOI] [PubMed] [Google Scholar]
- 3.Criteria for the classification of monoclonal gammopathies, multiple myeloma and related disorders: a report of the International Myeloma Working Group. British journal of haematology 2003; 121(5): 749–57. [PubMed] [Google Scholar]
- 4.Tofts PS, Brix G, Buckley DL, Evelhoch JL, Henderson E, Knopp MV et al. Estimating kinetic parameters from dynamic contrast-enhanced T(1)-weighted MRI of a diffusable tracer: standardized quantities and symbols. Journal of magnetic resonance imaging : JMRI 1999; 10(3): 223–32. [DOI] [PubMed] [Google Scholar]
- 5.Rajkumar SV, Mesa RA, Fonseca R, Schroeder G, Plevak MF, Dispenzieri A et al. Bone marrow angiogenesis in 400 patients with monoclonal gammopathy of undetermined significance, multiple myeloma, and primary amyloidosis. Clinical cancer research : an official journal of the American Association for Cancer Research 2002; 8(7): 2210–6. [PubMed] [Google Scholar]
- 6.Hillengass J, Zechmann C, Bauerle T, Wagner-Gund B, Heiss C, Benner A et al. Dynamic contrast-enhanced magnetic resonance imaging identifies a subgroup of patients with asymptomatic monoclonal plasma cell disease and pathologic microcirculation. Clinical cancer research : an official journal of the American Association for Cancer Research 2009; 15(9): 3118–25. [DOI] [PubMed] [Google Scholar]
- 7.Wasser K, Moehler T, Neben K, Nosas S, Heiss J, Goldschmidt H et al. [Dynamic MRI of the bone marrow for monitoring multiple myeloma during treatment with thalidomide as monotherapy or in combination with CED chemotherapy]. RoFo : Fortschritte auf dem Gebiete der Rontgenstrahlen und der Nuklearmedizin 2004; 176(9): 1285–95. [DOI] [PubMed] [Google Scholar]
- 8.Tan E, Weiss BM, Mena E, Korde N, Choyke PL, Landgren O. Current and future imaging modalities for multiple myeloma and its precursor states. Leukemia & lymphoma 2011; 52(9): 1630–40. [DOI] [PMC free article] [PubMed] [Google Scholar]
- 9.Vacca A, Ribatti D. Bone marrow angiogenesis in multiple myeloma. Leukemia 2006; 20(2): 193–9. [DOI] [PubMed] [Google Scholar]
- 10.Kumar S, Witzig TE, Timm M, Haug J, Wellik L, Kimlinger TK et al. Bone marrow angiogenic ability and expression of angiogenic cytokines in myeloma: evidence favoring loss of marrow angiogenesis inhibitory activity with disease progression. Blood 2004; 104(4): 1159–65. [DOI] [PubMed] [Google Scholar]
- 11.Thompson MA, Witzig TE, Kumar S, Timm MM, Haug J, Fonseca R et al. Plasma levels of tumour necrosis factor alpha and interleukin-6 predict progression-free survival following thalidomide therapy in patients with previously untreated multiple myeloma. British journal of haematology 2003; 123(2): 305–8. [DOI] [PubMed] [Google Scholar]
- 12.Cibeira MT, Rozman M, Segarra M, Lozano E, Rosinol L, Cid MC et al. Bone marrow angiogenesis and angiogenic factors in multiple myeloma treated with novel agents. Cytokine 2008; 41(3): 244–53. [DOI] [PubMed] [Google Scholar]
- 13.Sucak GT, Aki SZ, Yuzbasioglu B, Akyurek N, Yagci M, Bagriacik U et al. Prognostic value of bone marrow microvessel density and angiogenic cytokines in patients with multiple myeloma undergoing autologous stem cell transplant. Leukemia & lymphoma 2011; 52(7): 1281–9. [DOI] [PubMed] [Google Scholar]
- 14.Mileshkin L, Honemann D, Gambell P, Trivett M, Hayakawa Y, Smyth M et al. Patients with multiple myeloma treated with thalidomide: evaluation of clinical parameters, cytokines,angiogenic markers, mast cells and marrow CD57+ cytotoxic T cells as predictors of outcome. Haematologica 2007; 92(8): 1075–82. [DOI] [PubMed] [Google Scholar]
- 15.Andersen NF, Standal T, Nielsen JL, Heickendorff L, Borset M, Sorensen FB et al. Syndecan-1 and angiogenic cytokines in multiple myeloma: correlation with bone marrow angiogenesis and survival. British journal of haematology 2005; 128(2): 210–7. [DOI] [PubMed] [Google Scholar]