Abstract
A dextran-peptide conjugate was developed for magnetic resonance (MR) molecular imaging of pancreatic ductal adenocarcinoma (PDAC) through its overexpressed microenvironment biomarker, extradomain-B fibronectin (EDB-FN). This new agent consists of diamagnetic and biocompatible dextran and a targeting peptide. Dextrans can be directly detected by chemical exchange saturation transfer magnetic resonance imaging (CEST MRI) without the need for radionuclide or metallic labeling. In addition, large molecular weight dextran, dextran 10 (MW ∼ 10 kDa), provides an approximately 50 times higher sensitivity per molecule than a single glucose unit. The potential of this highly biocompatible diamagnetic probe is demonstrated in a murine syngeneic allograft PDAC tumor model. The biocompatibility and sensitivity of this new agent clearly show potential for a path to clinical translation.
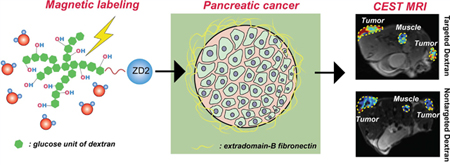
Graphical Abstract
INTRODUCTION
Pancreatic ductal adenocarcinoma (PDAC) is among the most lethal human malignancies, accounting for 7% of all cancer-related deaths in the United States.1 Due to the lack of early disease-specific signs and symptoms, early detection of pancreatic intraepithelial neoplasia (PanIN) lesions and PDAC is difficult, and only 10–20% of patients with pancreatic cancer are candidates for curative resection.2 Detection of preinvasive pancreatic neoplasms is paramount for improving the survival of patients. Compared to biopsy, the current gold standard for PDAC diagnosis, imaging diagnosis of PDAC is noninvasive and not prone to errors from limited tissue sampling. However, the most commonly used imaging modalities in PDAC, computed tomography (CT) and ultrasound, only provide morphological information on the pancreas,3 and other imaging modalities, including positron emission tomography (PET) and magnetic resonance imaging (MRI), also have a similar diagnostical performance (sensitivity and specificity) for PDAC detection.4,5 Despite the superb soft tissue contrast and no ionizing radiation, MRI is only considered as a secondary “problem-solving” imaging modality in the diagnosis of pancreatic cancer by providing morphological and semiphysiological parameters, such as perfusion, of the pancreas.3,6 There is an urgent need to develop new molecular imaging methods that can accurately detect the molecular alterations in the early stages of PDAC tumorigenesis.
Molecular imaging provides an opportunity to delineate molecular changes correlated to early PDAC tumorigenesis. It is well-known now that the tumor microenvironment (TME) plays an essential role in the progression and chemoresistance of many cancer types. Indeed, PDAC is notorious for the socalled desmoplastic reaction, characterized by formation of a dense fibrotic mass enriched with extracellular matrix (ECM) proteins,7 which in turn can be used as the molecular targets for diagnosis and therapy. For example, extradomain-B fibronectin (EDB-FN), a splice variant of fibronectin, is one of the most selective oncofetal antigens abundantly expressed in the ECM of aggressive tumors.8 EDB-FN has been shown to be selectively expressed in human and mouse orthotopic PDAC, with negligible expression in normal pancreas and chronic pancreatitis.9 EDB-FN targeted immune modulators, based on antibody-cytokine conjugates, have been developed for PDAC treatment.9,10 Therefore, EDB-FN is a suitable molecular target for the development of molecular imaging methods for early and specific detection of PDAC. Indeed, a targeted therapy using L19-IL2 (the fusion product of the L19 human, single-chain, Fv antibody fragment and IL-2 interleukin (IL)-2, one of the most potent antitumor cytokines) was tested in phase I/II clinical trials for the treatment of advanced solid cancers (NCT01058538), melanomas (NCT01055522 and NCT01253096 ), and advanced pancreatic cancer (NCT01198522).11 However, despite a number of molecular imaging methods, including radioisotope-labeled antibodies-based nuclear imaging12–14 and peptide-conjugated gadolinium-based15,16 or super paramagnetic iron oxide nanoparticles (SPIO)-based17 MRI, having been reported to detect oncofetal fibronectin in a variety of types of cancers, to the best of our knowledge, there is no report on the molecular imaging of EDB-FN in PDAC. Therefore, development of new noninvasive molecular imaging to detect EDB-FN in PDAC is of great clinical significance.
The aim of this study was to develop EDB-FN-targeted imaging probes using natural dextrans, which can be directly detected through their abundant hydroxyl protons by chemical exchange saturation transfer (CEST) MRI.18–21 In contrast to the currently available molecular imaging approaches that require isotopic or synthetic labeling, and thus need a long time for clinical trials and FDA approval, CEST MRI portends a pathway for quick translation of new molecular imaging probes by the use of highly biocompatible and clinically compatible and available compounds such as glycogen,22 glucose,23,24 anticancer drugs,25–27 and clinical X-ray contrast agents.28,29 Our previous studies have shown that dextrans, a class of branched polysaccharides rich in OH protons, can be detected by CEST MRI.30,31 While the CEST MRI detectability on a per-glucose-unit basis is similar to glucose, dextrans of higher molecular weight have a much higher detectability on a per-dextran-unit basis, providing a practical way to pursue sensitive CEST MRI detection. Dextranenhanced CEST MRI has been shown to be efficient in the detection of tumor receptors such as prostate-specific membrane antigen (PSMA).30 In the current study, we sought to develop a new dextran-peptide contrast agent for MR molecular imaging of PDAC, in which dextrans are used to generate CEST MRI contrast and an ZD2 peptide32 is exerted to target EDB-FN.
RESULTS
Synthesis of Dex10-ZD2.
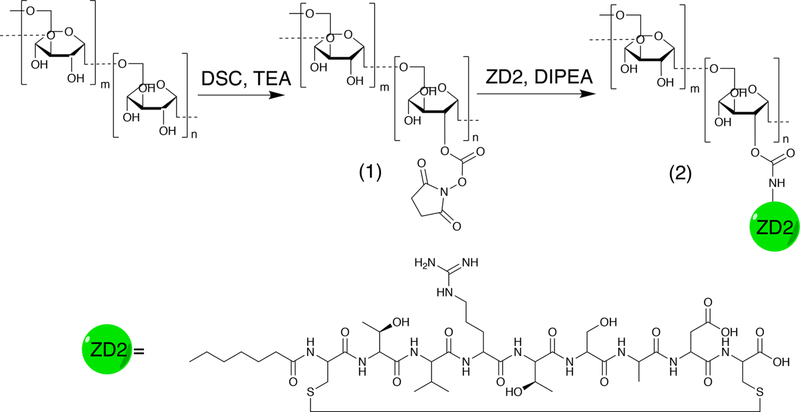
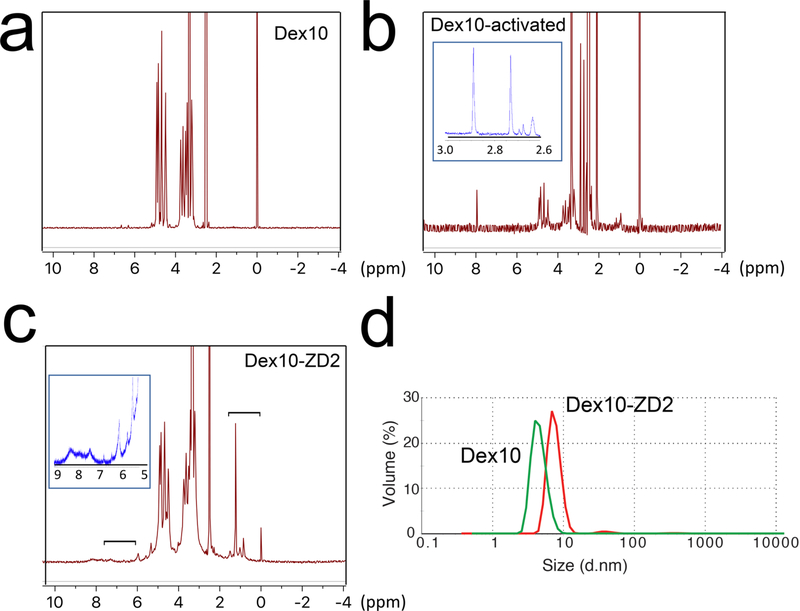
We first conjugated the EDB-FN targeting peptide ZD2 and 10KD dextran to construct ZD2 peptide-conjugated dextran (abbr. Dex10-ZD2) according to the route shown in Figure 1. Briefly, N,N′-disuccinimidyl carbonate (DSC) was used to activate the hydroxyls of Dex10 to form succinimidyl groups as confirmed by NMR spectrum (i.e., 2.7 and 2.9 ppm, Figure 2b). The conjugation of the activated Dex10 with peptides was confirmed by the characteristic peptide peaks, at 6–8.5 and 1–1.8 ppm (Figure 2c), as evident from the NMR spectrum of the ZD2 peptide (see Supporting Information, Figure S1). As expected, peptide conjugation also resulted in an increased particle size (d = 8.2 ± 1.73 nm, polydispersity index (PDI) = 0.51, zeta-potential = −0.21 ± 0.19 mV) compared to the parent Dex10 (d = 6.5 ± 0.3 nm, PDI = 0.43, zeta-potential = −0.31 ± 0.05 mV) (Figure 2d). Considering that both Dex10 and Dex10-ZD2 are sufficiently small for renal clearance, the small differences in size and surface charge are unlikely to result in a distinctive biodistribution.
Figure 1.
Synthetic route of Dex10-ZD2. Dex10 particles were activated into N-hydroxylsuccinimide functionalized Dex10 (1) by DSC in DMSO under trimethylamine (TEA) catalysis. After purification, (1) was reacted with the terminal amine of the ZD2 peptide under N,N-diisopropylethylamine (DIPEA) catalysis to yield Dex10-ZD2 (2), which was then purified.
Figure 2.
Characterization of Dex10-ZD2 synthesis. 1H NMR of (a) Dex10, (b) activated Dex10, and (c) Dex10-ZD2. The inset in (b) provides the zoomed view in the range of 2.6–3.0 ppm, with arrows indicating the peaks attributed to succinimidyl groups (2.7 and 2.9 ppm). The brackets in (c) indicate the peptide peaks (i.e, 6–8.5 and 1–1.8 ppm), and the inset is the zoomed view in the range of 5–9 ppm. (d) Dynamic light scattering (DLS) measurement of Dex10 and Dex10-ZD2.
In Vitro CEST Properties of Dex10-ZD2.
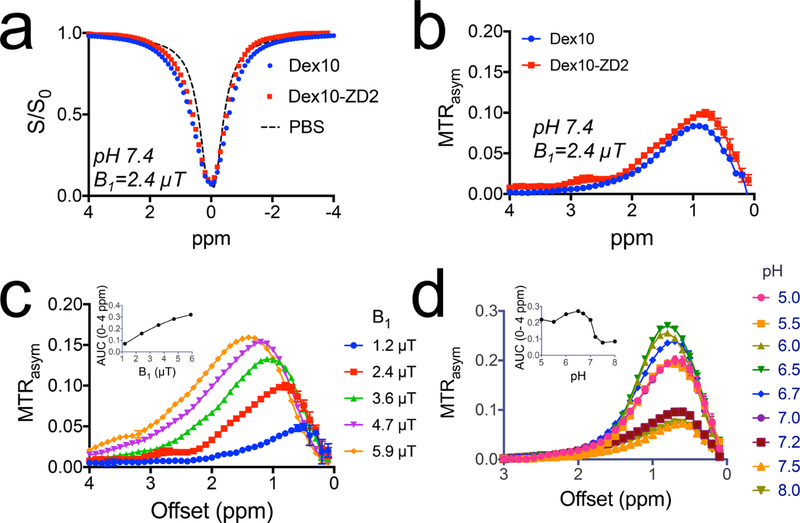
We first studied the CEST MRI characteristics of Dex10-ZD2 at 9.4 T magnetic field strength. The Z-spectra (Figure 3a), which show the normalized water signal intensity (S/S0) as a function of RF saturation offset (Δω) relative to water proton frequency, show that a broad signal dip in the offset range from 0 to 2 ppm for both Dex10-ZD2 and Dex10 attributed to the fast-exchanging hydroxyl protons. We then used the asymmetric magnetization transfer ratio (MTRasym = S−Δω/S0 – SΔω /S0) to quantify the CEST effect. As shown in Figure 3b, both Dex10 and Dex10-ZD2 have a characteristic CEST signal around 1 ppm, attributed to hydroxyl protons. Interestingly, Dex10-ZD2 also exhibits an extra CEST signal at ∼2.8 ppm, attributable to the ZD2 peptide (Cys-Thr-Val-Arg-Thr-Ser-Ala-Asp-Cys), which was confirmed by the CEST spectrum of the peptide (see Supporting Information, Figure S2). This is another evidence that the ZD2 peptide was successfully conjugated to Dex10. The CEST signal of Dex10-ZD2 is highly dependable on saturation parameters such as saturation field strengths (B1) (Figure 3c). Moreover, the CEST signal also highly depends on the pH. As shown in Figure 3d, the CEST signal of Dex10-ZD2 is higher at lower pH. It is because the exchange rate of hydroxyl protons is in the fast exchange range (i.e., >1000 s−1), slowing down the exchange rate by decreasing pH (as it follows base catalysis) would increase the effective pool size of exchangeable hydroxyl protons and thus augment the CEST contrast of dextrans. The pH dependence of the CEST signal of dextran indeed may favor the applications in detecting the TME of tumors, where the pH is acidic.33 Based on our in vitro results of 500 μM Dex10-ZD2, we extrapolated the concentrations to generate 1% MTRasym as only 50 μM (B1 = 2.4 μT, pH 7.4, and 37 °C), indicating the sensitivity of CEST MRI detection is much higher than the typical small molecular CEST agents.
Figure 3.
In vitro CEST characteristics of Dex10-ZD2. (a). Z-spectra of Dex10, Dex10-ZD2, and PBS (pH 7.4) using B1 = 2.4 μT. (b) Corresponding MTRasym of Dex10 and Dex10-ZD2 (pH 7.4) using B1 = 2.4 μT. (c) B1 dependence of the CEST signal of Dex10-ZD2. The inset shows the B1 dependence of the integrated area (AUC) from 0 to 4 ppm. (d) pH dependence of the CEST signal of Dex10-ZD2. The inset shows the pH dependence of the integrated area (AUC) from 0 to 4 ppm. All the measurements were performed on 5 mg/mL Dex10 or Dex10-ZD2 solutions (∼500 μM) in PBS at 37 °C.
In Vivo PDAC Detection Using Dex10-ZD2.
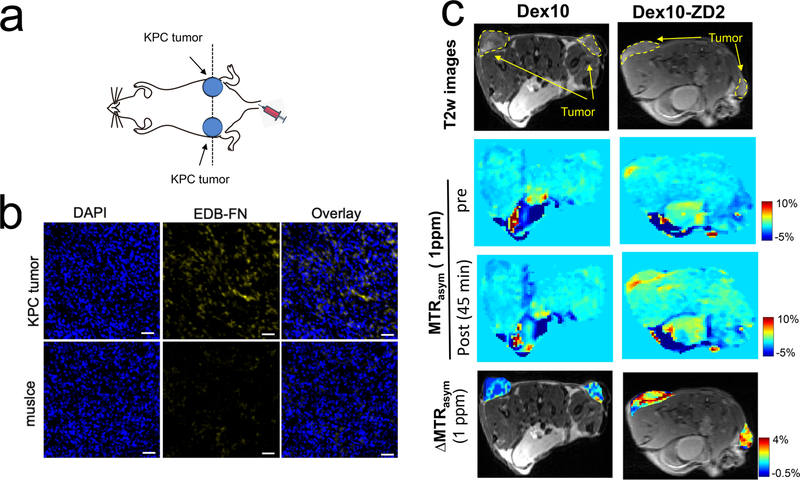
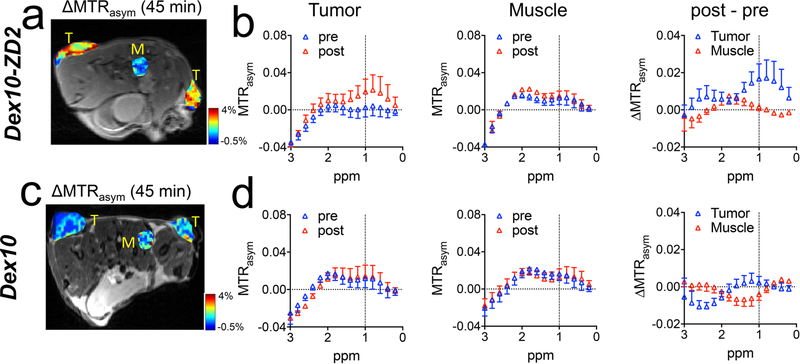
In vivo PDAC detection with the targeted Dex10 particles was demonstrated in subcutaneous tumors, which were formed by implanting syngeneic KrasLSL.G12D/+; p53R172H/+; PdxCretg/+ (KPC)-derived PDAC cells.34 The implantable model shares similar ECM and immunobiology as the parental tumors arising spontaneously in KPC mice, providing a simple and well-controlled model that recapitulates cellular and molecular pathology of human PDAC.35,36 To ensure successful tumor formation, two tumors were implanted on both sides of the flank of each mouse subcutaneously (Figure 4a). The EDB-FN overexpression in the tumors was confirmed by immunohistochemistry (Figure 4b). Mice were then imaged for contrast enhanced CEST MRI using an 11.7 T high field small animal scanner. As shown in Figure 4c, at 45 min after the injection, Dex10-ZD2 but not Dex10 (i.v. 500 mg/kg b.w.) resulted in a marked CEST contrast enhancement in the KPC tumors, i.e. ΔMTRasym= 2.57 ± 0.008% and 0.22 ± 0.001% for Dex10-ZD2 and Dex10, respectively (p = 0.0117, n = 6, two-tailed unpaired Student’s t test). Indeed, comparison of the mean before and post Z-spectra of all six tumor ROIs and three muscle ROIs (internal control, Figures 5a) from three mice injected with Dex10-ZD2 (Figure 5b) clearly showed a significant increase of the CEST contrast between 0 and 1.5 ppm with the maximum occurring at ∼1 ppm, well resembling the CEST signal of dextrans in solution (Figure 3b). No contrast enhancement can be observed in the muscle ROIs, indicating that the Dex10-ZD2 enhancement only occurs in the EDB-FN overexpressed tissues. In contrast, the mean before and post Z-spectra of all six tumor ROIs in mice injected with Dex10 showed no significant contrast enhancement (Figure 5d), indicating the contrast enhancement in the tumors is the result of strong binding between the targeting Dex10-ZD2 and EDB-FN.
Figure 4.
CEST MRI detection of EDB-FN in KPC pancreatic tumors using Dex10-ZD2. (a) Schematic of the tumor position. (b) Immunohistofluorescence stains of EDB-FN in the tumors and muscle. Blue: nucleus, yellow: EDB-FN, scale bar: 50 μm. (c) Comparison of the CEST MRI images of two representative mice injected with Dex10 (left) and Dex10-ZD2, respectively. From the top to bottom: the T2-weighted (T2w) images showing the ROIs of tumors; CEST images before and post the injection, as quantified by the MTRasym maps at 1 ppm; and the overlaid contrast enhancement of the tumor regions, as quantified by the ΔMTRasym (1 ppm) maps at 45 min postinjection.
Figure 5.
CEST MRI enhancement by Dex10 and Dex10-ZD2 in KPC tumors and muscle (control). Mean MTRasym plots of KPC tumors, before (pre) and at 45 min after (post) injecting (a) Dex10-ZD2 or (d) Dex10. Mean MTRasym plots of a muscle ROI before and at 45 min after the injection of (b) Dex10-ZD2 or (e) Dex10. n = 6. ΔMTRasym (post-pre) of tumor and muscle in mice injected with (c) Dex10-ZD2 or (f) Dex10. n = 6. Data are presented as mean ± s.e.m.
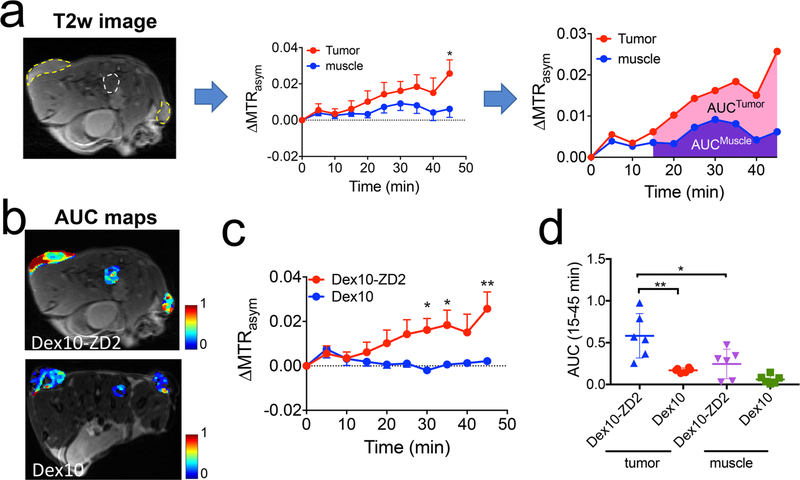
In the same animal model, we also monitored the dynamic change of CEST contrast and showed the results in Figure 6. As depicted in Figure 6a, we employed the area-under-curve (AUC) between 15 to 45 min postinjection to semiquantitatively analyze the dynamic data. Figure 6b showed the comparison of tumors injected with Dex10 or Dex10-ZD2. All tumors first showed a similar CEST enhancement at early time points (0–10 min) after the injection. Conversely, starting at 15 min, a noticeable higher CEST enhancement was observed in the tumors injected with Dex10-ZD2 than those injected with Dex10. Significant differences were observed after 30 min, i.e., p = 0.025, 0.028, and 0.001, at 30, 35, and 45 min postinjection (n = 6, two-tailed unpaired Student’s t test). Low CEST contrast enhancement was always observed in the muscle (internal reference) at the later time points after either injection. The AUC analysis (Figure 6c) showed significantly higher AUC values in the tumors receiving Dex10-ZD2 than those receiving Dex10 (p = 0.0036, n = 6, two-tailed unpaired Student’s t test). In addition, in the same groups of mice that were injected with Dex10-ZD2, muscle tissues showed much smaller AUC values than tumors (p = 0.0269, n = 6, two-tailed unpaired Student’s t test). All these results clearly showed the enhanced uptake of Dex10-ZD2 in the KPC tumors due to their specific binding to EDB-FN.
Figure 6.
Dynamic CEST contrast studies. (a) Illustration of the dynamic CEST contrast changes in the tumor and muscle ROIs depicted in the T2-weighted images (left) and semiquantitative analysis using the area-under-curve (AUC) maps calculated by the CEST contrast enhancement in each pixel between 15 and 45 min postinjection. (b) AUC maps of two representative mice injected with Dex10-ZD2 and Dex10, respectively. (c) Average dynamic CEST contrast changes in the tumors injected with Dex10-ZD2 (n = 6) and Dex10 (n = 6), respectively. (d) Scatter plots of AUC values in the tumors (n = 6) and muscle (n = 3). All data are shown as mean ± s.e.m. Student’s t test (n = 6, two-tailed, unpaired) was performed. *: p < 0.05, **: p < 0.01.
Finally, to investigate whether the changes in CEST contrast were caused by changes in T1 in the tumors, we also measured the T1 and T2 maps before and post the injection. Our results (Figure 7) revealed that there were no significant changes in T1 values in the tumors (p = 0.2404, two-tailed paired Student’s t test), suggesting that the CEST enhancement was not caused by changes in T1 times. Interestingly, T2 relaxation times in the tumors consistently decreased (p = 0.0067, two-tailed paired Student’s t test). As it is well-known that fast exchangeable protons including hydroxyl protons can also generate T2ex MRI contrast,37,38 the significant decrease in T2 values further confirms the accumulation of Dex10-ZD2 in the tumors. Taken together, our results clearly demonstrated the capability of tumor imaging by targeting the overexpressed EDB-FN using Dex10-ZD2.
Figure 7.
Changes in the mean T1 and T2 relaxation times in the tumors after the injection of Dex10-ZD2 or Dex10. (a) T1 relaxation times and (b) T2 relaxation times. n = 4, paired two-tailed Student’s t test.
DISCUSSION
The present study demonstrated a new dextran-based molecular imaging MR agent for the detection of EDB-FN, a biomarker highly overexpressed in the microenvironment of pancreatic tumors.39 ECM biomarkers are more abundant and accessible than cell-surface receptors,40 providing a higher sensitivity for MR imaging. Targeting ECM is particularly important for early detection of PDAC as PDAC is known for hypovascularization and high interstitial pressure,41 which could severely compromise the amount of imaging agent reaching cancer cells.42 Thus, methods with the capability of imaging ECM biomarkers can provide indispensable clinical values to the diagnosis of those PDAC tumors that have small or negligible dynamic contrast enhanced (DCE) MRI contrast enhancement. While molecular imaging of EDB-FN has been demonstrated in a variety of solid tumors,15,32 the utility in the detection of pancreatic cancer is not explored yet. Our study successfully demonstrates that EDB-FN can be used as an imageable biomarker for molecular imaging of PDAC.
Using Dex10-ZD2, we successfully used CEST contrast-enhanced MRI to detect the overexpression of EDB-FN in KPC tumors. The average CEST MRI contrast enhancement in the tumors was ΔMTRasym = 2.57%, more than 5 times higher than that in the muscle (ΔMTRasym = 0.62%) and 10 times higher than that in the tumors injected with Dex10 (ΔMTRasym = 0.22%). Thanks to the higher accessibility, ECM biomarkers provide an easy strategy for targeted imaging probes than tumor cell surface biomarkers. For example, our previous studies showed that, using a PSMA-targeting Dex-10 agent, a 1.33% CEST contrast enhancement was obtained in the PSMA overexpressed prostate tumors.30 In comparison, the CEST contrast enhancement obtained in the present study is almost twice as that generated by PSMA targeted agents, indicative of the great potential of ECM-targeting molecular imaging probes. In our study, postcontrast CEST MRI was performed for up to 45 min. This time window was chosen based on the washout kinetics of the nontargeted dextran, which mostly washes out from the tumor within 30 min. However, our data also indicated the targeted probe, Dex10-ZD2, may continue to accumulate in the tumor even after 45 min. Imaging at a later time point may produce higher CEST contrast, and further studies are needed to systemically study the pharmacokinetics of Dex10-ZD2 in mice and in humans to determine the most appropriate time point to acquire the postcontrast MRI. It should be noted that s.e.m. (standard error) was used in our studies to compare the differences between the mice injected with targeted and nontargeted dextran probes. For future clinical studies, caution has to be taken regarding the appropriate statistical measures of variability, in particular, using standard deviation (SD) to describe the variation within the same subject and using s.e.m. to report statistical comparison between two populations.
The established MR molecular imaging method employs dextran as the imaging agent, which possesses unbeatable advantages compared with other radioactive- or metallic-based molecular imaging probes. First, dextrans are highly biocompatible and clinically available agents that contain abundant exchangeable hydroxyl protons to provide highly sensitive CEST MRI signals.30 This high biocompatibility of the constructed imaging probes should be favorable for fast translation of this MRI screening for early PDAC detection to the clinic. Indeed, thanks to the similar CEST properties between dextrans and their monomer D-glucose, many currently available glucoCEST technologies in principle can be directly applied to dextran CEST MRI detection. Second, compared to small molecular CEST agents, the CEST signal of dextrans is proportional to its number of glucose units, thus inherently high (on a per-dextran-molecule basis). Moreover, unlike glucose, dextran can only be metabolized slowly, allowing imaging of receptors or ECM markers over an extended time window. Indeed, we only injected our dextran agent at a modestly high dose of 500 mg/kg, which corresponds to ∼40 mg/kg human equivalent dose (HED) according to the calculation method using the body surface area (BSA) ratio between humans and mice.43 The dose that we used in the present study is much less than the doses (i.e., 1–3 g/kg) used for glucose23,24 and 3-O-methyl-D-glucose.44 It should be noted that, as this first study was demonstrated on high magnetic field MRI scanners, i.e., 9.4 and 11.7 T, further studies are warranted to test the translation potential of Dex10-ZD2 at clinical field strengths, e.g. 3 T. Several technical issues need to be overcome in order to implement our method at 3 T, including lower SNR, lower frequency separation (in Hz) with respect to the fast exchanging OH protons, and the relative long acquisition time for sick patients. Fortunately, as currently a great effort is dedicated to the translation of glucose-enhanced CEST MRI to 3T human scanners,45 we expect many existing technical hurdles will be solved in the near future.
Finally, together with our previous study on receptor imaging,30 our present study demonstrates that dextrans can be used as a platform that can be easily conjugated with other targeting moieties to achieve CEST MR molecular imaging. The availability of different sizes makes dextrans intriguing imaging probes, as they can be easily tailored for specific application in different tumors, as different tumors may have different vascular permeability to dextrans of different sizes.31,46 For example, in the present study, we chose 10 kDa dextran because of its small hydrodynamic size (4–6 nm in diameter) to foster a low background signal and higher tumor penetrating ability.47 Moreover, as dextrans have been extensively studied as drug carriers,48,49 our system can be further modified to be ECM-targeted theranostic systems, in which dextrans not only generate MRI contrast but also carry drugs or therapeutic genes.
CONCLUSION
In sum, we developed a new MRI probe for targeted imaging of tumor microenvironment biomarker EDB-FN in a murine PDAC model. This new probe consists of diamagnetic and biocompatible dextran and a peptide targeting the oncofetal protein overexpressed in the tumor microenvironment, providing a highly biocompatible and sensitive molecular imaging approach for early detection of pancreatic tumors.
MATERIALS AND METHODS
Materials.
Dextran (MW = 10 KDa, abbr. Dex10) and N,N′-disuccinimidyl carbonate (DSC) were purchased from Sigma-Aldrich (St. Louis, MO, USA). Fluorenylmethyloxycarbonyl (Fmoc) protected amino acids, 1-hydroxybenzotriazole hydrate (HOBt), and 2-chlorotrityl chloride resin were acquired from Nova Biochem (Darmstadt, Germany). Anhydrous N,N-diisopropylethyl amine (DIPEA) and N,N-dimethylformamide (DMF) were purchased from Fisher Scientific (Pittsburgh, PA, USA).
Chemical Synthesis.
The ZD2 peptide (Cys-Thr-Val-Arg-Thr-Ser-Ala-Asp-Cys) extended with a flexible epsilon-aminocaproic acid residue (Acp) was synthesized using the standard Fmoc-chemistry. Successful synthesis of the peptide was characterized by MALDI-TOF (calculated: 1176 m/z; measured: 1177 m/z). 0.4 × 10⁻⁴ mol of Dex10 in DMSO (1.5 mL) was slowly added to 2.2 × 10⁻⁴ mol of DSC in 1 mL of DMSO. Triethylamine (TEA) (10 uL) was then added, and the mixture was stirred for 20 h at room temperature (RT). Dextran was precipitated by dropping the reaction mixture to cold acetone and centrifuged at 4000 × g for 5 min to collect the activated dextran.
The ZD2 peptide and the activated dextran were mixed in DMSO at the ratio of 3:1. Five equiv of DIPEA was then added, and the mixture was stirred overnight at RT. The product was precipitated in acetone, collected by centrifugation, and washed with acetone. The product was then dissolved in water, dialyzed with a 3000 molecular weight cutoff (MWCO) membrane, and freeze-dried. The products in all steps were verified by 1H NMR (DMSO-d6). DLS and zeta-potential measurement of the particles were performed using the Nanosizer ZS90 (Malvern Instruments).
Cell Culture.
The murine PDAC KPC cells were derived from KrasLSL.G12D/+; p53R172H/+; PdxCretg/+ (or KPC) mice. KPC cells were cultured at 37 °C and 5% CO2 in RPMI medium supplemented with 10% FBS (100 mL), 1% PenStrep (10 mL), 1% MEMNEAA (10 mL), 1% sodium pyruvate (10 mL), and 1% L-glutamine (10%).
Animals.
All animal experiments were conducted in compliance to protocols approved by the Institutional Animal Care and Use Committee of Johns Hopkins University. One million KPC cells (in 200 μL PBS) were subcutaneously injected to both lower flanks of C57BL/6J mice (6–8-week-old females, Jackson Laboratories, USA) to form two tumors (for successful tumorigenesis). Mice were randomly selected for different groups. The investigators were not blinded to the grouping of mice. Mice were imaged on day ∼7 after implantation, when the tumor reached 5–7 mm in diameter.
MRI.
For in vitro study, a Bruker 400 MHz (9.7 T) vertical scanner (Bruker Biosciences, Billerica, MA) was used according to a previously reported procedure50 with the following CEST parameters: B1 = 1.2, 2.4, 3.6, 4.7, and 5.9 μT, saturation time (Tsat) = 3 s, offsets ranging from −4 ppm to 4 ppm (step = 0.2 ppm). The B0 inhomogeneities were measured and corrected using the water saturation shift referencing (WASSR) method.51 For an in vivo study, an 11.7 T Bruker Biospec horizontal scanner was used. CEST MRI was performed before and after the i.v. injection of 200 μL of Dex10 or Dex10-ZD2 solutions in saline (500 mg/kg b.w.), using the following parameters: B1 = 1.8 μT, tsat = 3 s, Δω range of −3 to +3 ppm with a step size of 0.2 ppm, TR/TE = 5 s/18.6 ms, number of averages = 2, slice number = 1, slice thickness = 1 mm, matrix size = 64 × 64, field of view = 25 mm × 25 mm, total scan time = 5 min for 1 image. The B0 inhomogeneity maps were acquired before and after the CEST acquisitions using the WASSR method using the following parameters: B1 = 0.5 μT, tsat = 500 ms, Δω range of −1 to +1 ppm with a step size of 0.1 ppm. MTRasym = (S−Δω− S+Δω)/S0 was computed after the B0 correction. ΔMTRasym at each time point was calculated by MTRasym (t) − MTRasym (pre). Data were processed using custom-written MATLAB programs. T1 maps were acquired using the same geometry and spatial resolution as CEST MRI with a RARE-VTR sequence (RARE with variable , effective TE = 25 ms and RARE factor = 4) with 12 TR times ranging from 60 ms to 10 s. Total time of T1 mapping is 3 min 47 s. T2 maps were measured using the same geometry and spatial resolution as CEST MRI with a modified Multi Slice Multi Echo (MSME) method described previously52 with TR = 2200 ms and 30 echo times ranging from 7.5 to 225 ms. Total time of T2 mapping is 4 min 16 s.
Histology.
Tumor and muscle tissues were harvested from KPC-tumor bearing mice, frozen, and cryosectioned at the thickness of 5 μm. Tissue slices were then fixed and permeabilized with cold acetone for 10 min and blocked with 1% BSA for 1 h at RT. The mouse anti-EDB-FN antibodies (1:100 dilution, BC1, Abcam) were then applied to tumor and muscle slices and incubated for 1 h at RT. After washing with PBS, Alexa Fluoro 593 antimouse IgG antibodies were then applied to the tissue and incubated for 1 h at RT to stain EDB-FN. DAPI (Sigma) was used to stain the nucleus.136 Coverslips were then mounted using the ProLong Gold Antifade agent (Thermo Fisher Scientific, USA).
Statistical Analysis.
Data are expressed as mean ± s.e.m. unless otherwise stated. Comparison of two groups was conducted using unpaired two-tailed Student’s t test. Differences with p < 0.05 were considered statistically significant.
Supplementary Material
ACKNOWLEDGMENTS
This work was supported by NIH grants P41EB024495, R01EB015032, R01CA211087, and R21CA215860.
Footnotes
The authors declare the following competing financial interest(s): Z.H. and Z.-R.L. are the inventors of the peptide. The peptide and related targeted MRI contrast agents and imaging probes are licensed to Molecular Theranostics LLC for clinical development. Z.H. and Z.-R.L. are the inventors of the patent, and on the patent application Z.-R.L. is a cofounder of Molecular Theranostics that has licensed the technology for commercialization.
ASSOCIATED CONTENT
Supporting Information
The Supporting Information is available free of charge on the ACS Publications website at DOI: 10.1021/acs.bioconjchem.9b00161.
Figure S1, 1H NMR spectrum of ZD2 peptide; Figure S2, CEST signal of ZD2 peptide (PDF)
REFERENCES
- (1).Siegel RL, Miller KD, and Jemal A (2018) Cancer Statistics, 2018. Ca-Cancer J. Clin. 68 (1), 7–30. [DOI] [PubMed] [Google Scholar]
- (2).Heestand GM, Murphy JD, and Lowy AM (2015) Approach to Patients with Pancreatic Cancer without Detectable Metastases. J. Clin. Oncol. 33 (16), 1770–8. [DOI] [PubMed] [Google Scholar]
- (3).Lee ES, and Lee JM (2014) Imaging Diagnosis of Pancreatic Cancer: A State-of-the-Art Review. World J. Gastroenterol 20 (24), 7864–77. [DOI] [PMC free article] [PubMed] [Google Scholar]
- (4).Toft J, Hadden WJ, Laurence JM, Lam V, Yuen L, Janssen A, and Pleass H (2017) Imaging Modalities in the Diagnosis of Pancreatic Adenocarcinoma: A Systematic Review and Meta-Analysis of Sensitivity, Specificity and Diagnostic Accuracy. Eur. J. Radiol. 92, 17–23. [DOI] [PubMed] [Google Scholar]
- (5).Horvat N, Ryan DE, LaGratta MD, Shah PM, and Do RK (2017) Imaging for Pancreatic Ductal Adenocarcinoma. Chin Clin Oncol 6 (6), 62. [DOI] [PubMed] [Google Scholar]
- (6).Saisho H, and Yamaguchi T (2004) Diagnostic Imaging for Pancreatic Cancer: Computed Tomography, Magnetic Resonance Imaging, and Positron Emission Tomography. Pancreas 28 (3), 273–8. [DOI] [PubMed] [Google Scholar]
- (7).Shields MA, Dangi-Garimella S, Redig AJ, and Munshi HG (2012) Biochemical Role of the Collagen-Rich Tumour Microenvironment in Pancreatic Cancer Progression. Biochem. J. 441 (2), 541–52. [DOI] [PMC free article] [PubMed] [Google Scholar]
- (8).Han Z, and Lu ZR (2017) Targeting Fibronectin for Cancer Imaging and Therapy. J. Mater. Chem. B 5 (4), 639–654. [DOI] [PMC free article] [PubMed] [Google Scholar]
- (9).Wagner K, Schulz P, Scholz A, Wiedenmann B, and Menrad A (2008) The Targeted Immunocytokine L19-IL2 Efficiently Inhibits the Growth of Orthotopic Pancreatic Cancer. Clin. Cancer Res. 14 (15), 4951–60. [DOI] [PubMed] [Google Scholar]
- (10).Huang ZQ, and Buchsbaum DJ (2009) Monoclonal Antibodies in the Treatment of Pancreatic Cancer. Immunotherapy 1 (2), 223–9. [DOI] [PMC free article] [PubMed] [Google Scholar]
- (11).Muller D (2014) Antibody-Cytokine Fusion Proteins for Cancer Immunotherapy: An Update on Recent Developments. BioDrugs 28 (2), 123–31. [DOI] [PubMed] [Google Scholar]
- (12).Mariani G, Lasku A, Pau A, Villa G, Motta C, Calcagno G, Taddei GZ, Castellani P, Syrigos K, Dorcaratto A, et al. (1997) A Pilot Pharmacokinetic and Immunoscintigraphic Study with the Technetium-99m-Labeled Monoclonal Antibody BC-1 Directed against Oncofetal Fibronectin in Patients with Brain Tumors. Cancer 80 (S12), 2484–2489. [DOI] [PubMed] [Google Scholar]
- (13).Locher R, Erba PA, Hirsch B, Bombardieri E, Giovannoni L, Neri D, Durkop H, and Menssen HD (2014) Abundant in Vitro Expression of the Oncofetal ED-B-Containing Fibronectin Translates into Selective Pharmacodelivery of (131)I-L19SIP in a Prostate Cancer Patient. J. Cancer Res. Clin. Oncol. 140 (1), 35–43. [DOI] [PubMed] [Google Scholar]
- (14).Rossin R, Berndorff D, Friebe M, Dinkelborg LM, and Welch MJ (2007) Small-Animal PET of Tumor Angiogenesis Using a (76)Br-Labeled Human Recombinant Antibody Fragment to the Ed-B Domain of Fibronectin. J. Nucl. Med. 48 (7), 1172–9. [DOI] [PubMed] [Google Scholar]
- (15).Han Z, Wu X, Roelle S, Chen C, Schiemann WP, and Lu ZR (2017) Targeted Gadofullerene for Sensitive Magnetic Resonance Imaging and Risk-Stratification of Breast Cancer. Nat. Commun. 8 (1), 692. [DOI] [PMC free article] [PubMed] [Google Scholar]
- (16).Han Z, Li Y, Roelle S, Zhou Z, Liu Y, Sabatelle R, DeSanto A, Yu X, Zhu H, Magi-Galluzzi C, et al. (2017) Targeted Contrast Agent Specific to an Oncoprotein in Tumor Microenvironment with the Potential for Detection and Risk Stratification of Prostate Cancer with Mri. Bioconjugate Chem. 28 (4), 1031–1040. [DOI] [PMC free article] [PubMed] [Google Scholar]
- (17).Sun Y, Kim HS, Park J, Li M, Tian L, Choi Y, Choi BI, Jon S, and Moon WK (2014) MRI of Breast Tumor Initiating Cells Using the Extra Domain-B of Fibronectin Targeting Nanoparticles. Theranostics 4 (8), 845–57. [DOI] [PMC free article] [PubMed] [Google Scholar]
- (18).Cobb JG, Li K, Xie J, Gochberg DF, and Gore JC (2014) Exchange-Mediated Contrast in CEST and Spin-Lock Imaging. Magn. Reson. Imaging 32 (1), 28–40. [DOI] [PMC free article] [PubMed] [Google Scholar]
- (19).Ward KM, Aletras AH, and Balaban RS (2000) A New Class of Contrast Agents for MRI Based on Proton Chemical Exchange Dependent Saturation Transfer (CEST). J. Magn. Reson. 143 (1), 79–87. [DOI] [PubMed] [Google Scholar]
- (20).van Zijl PCM, Lam WW, Xu J, Knutsson L, and Stanisz GJ (2018) Magnetization Transfer Contrast and Chemical Exchange Saturation Transfer MRI. Features and Analysis of the Field-Dependent Saturation Spectrum. NeuroImage 168, 222–241. [DOI] [PMC free article] [PubMed] [Google Scholar]
- (21).Liu G, Song X, Chan KW, and McMahon MT (2013) Nuts and Bolts of Chemical Exchange Saturation Transfer MRI. NMR Biomed. 26 (7), 810–28. [DOI] [PMC free article] [PubMed] [Google Scholar]
- (22).van Zijl PC, Jones CK, Ren J, Malloy CR, and Sherry AD (2007) MRI Detection of Glycogen in Vivo by Using Chemical Exchange Saturation Transfer Imaging (GlycoCEST). Proc. Natl. Acad. Sci. U. S. A. 104 (11), 4359–64. [DOI] [PMC free article] [PubMed] [Google Scholar]
- (23).Walker-Samuel S, Ramasawmy R, Torrealdea F, Rega M, Rajkumar V, Johnson SP, Richardson S, Goncalves M, Parkes HG, Arstad E, et al. (2013) In Vivo Imaging of Glucose Uptake and Metabolism in Tumors. Nat. Med. 19 (8), 1067–72. [DOI] [PMC free article] [PubMed] [Google Scholar]
- (24).Chan KW, McMahon MT, Kato Y, Liu G, Bulte JW, Bhujwalla ZM, Artemov D, and van Zijl PC (2012) Natural D-Glucose as a Biodegradable MRI Contrast Agent for Detecting Cancer. Magn. Reson. Med. 68 (6), 1764–73. [DOI] [PMC free article] [PubMed] [Google Scholar]
- (25).Lock LL, Li Y, Mao X, Chen H, Staedtke V, Bai R, Ma W, Lin R, Li Y, Liu G, et al. (2017) One-Component Supramolecular Filament Hydrogels as Theranostic Label-Free Magnetic Resonance Imaging Agents. ACS Nano 11 (1), 797–805. [DOI] [PMC free article] [PubMed] [Google Scholar]
- (26).Ngen EJ, Bar-Shir A, Jablonska A, Liu G, Song X, Ansari R, Bulte JW, Janowski M, Pearl M, Walczak P, et al. (2016) Imaging the DNA Alkylator Melphalan by CEST MRI: An Advanced Approach to Theranostics. Mol. Pharmaceutics 13 (9), 3043–53. [DOI] [PubMed] [Google Scholar]
- (27).Li Y, Chen H, Xu J, Yadav NN, Chan KW, Luo L, McMahon MT, Vogelstein B, van Zijl PC, Zhou S, et al. (2016) CEST Theranostics: Label-Free MR Imaging of Anticancer Drugs. Oncotarget 7 (6), 6369–78. [DOI] [PMC free article] [PubMed] [Google Scholar]
- (28).Aime S, Calabi L, Biondi L, De Miranda M, Ghelli S, Paleari L, Rebaudengo C, and Terreno E (2005) Iopamidol: Exploring the Potential Use of a Well-Established X-Ray Contrast Agent for MRI. Magn. Reson. Med. 53 (4), 830–4. [DOI] [PubMed] [Google Scholar]
- (29).Moon BF, Jones KM, Chen LQ, Liu P, Randtke EA, Howison CM, and Pagel MD (2015) A Comparison of Iopromide and Iopamidol, Two Acidocest MRI Contrast Media That Measure Tumor Extracellular pH. Contrast Media Mol. Imaging 10 (6), 446–55. [DOI] [PMC free article] [PubMed] [Google Scholar]
- (30).Liu G, Ray Banerjee S, Yang X, Yadav N, Lisok A, Jablonska A, Xu J, Li Y, Pomper MG, and van Zijl P (2017) A Dextran-Based Probe for the Targeted Magnetic Resonance Imaging of Tumours Expressing Prostate-Specific Membrane Antigen. Nat. Biomed Eng. 1 (12), 977–982. [DOI] [PMC free article] [PubMed] [Google Scholar]
- (31).Li Y, Qiao Y, Chen H, Bai R, Staedtke V, Han Z, Xu J, Chan KWY, Yadav N, Bulte JWM, et al. (2018) Characterization of Tumor Vascular Permeability Using Natural Dextrans and CEST MRI. Magn. Reson. Med. 79 (2), 1001–1009. [DOI] [PMC free article] [PubMed] [Google Scholar]
- (32).Han Z, Zhou Z, Shi X, Wang J, Wu X, Sun D, Chen Y, Zhu H, Magi-Galluzzi C, and Lu ZR (2015) EDB Fibronectin Specific Peptide for Prostate Cancer Targeting. Bioconjugate Chem. 26 (5), 830–8. [DOI] [PubMed] [Google Scholar]
- (33).Kato Y, Ozawa S, Miyamoto C, Maehata Y, Suzuki A, Maeda T, and Baba Y (2013) Acidic Extracellular Microenvironment and Cancer. Cancer Cell Int. 13 (1), 89. [DOI] [PMC free article] [PubMed] [Google Scholar]
- (34).Beatty GL, Winograd R, Evans RA, Long KB, Luque SL, Lee JW, Clendenin C, Gladney WL, Knoblock DM, Guirnalda PD, et al. (2015) Exclusion of T Cells from Pancreatic Carcinomas in Mice Is Regulated by Ly6c(Low) F4/80(+) Extratumoral Macrophages. Gastroenterology 149 (1), 201–10. [DOI] [PMC free article] [PubMed] [Google Scholar]
- (35).Mazur PK, and Siveke JT (2012) Genetically Engineered Mouse Models of Pancreatic Cancer: Unravelling Tumour Biology and Progressing Translational Oncology. Gut 61 (10), 1488–500. [DOI] [PubMed] [Google Scholar]
- (36).Lee JW, Komar CA, Bengsch F, Graham K, and Beatty GL (2016) Genetically Engineered Mouse Models of Pancreatic Cancer: The Kpc Model (Lsl-Kras(G12d/+); Lsl-Trp53(R172h/+); Pdx-1-Cre), Its Variants, and Their Application in Immuno-Oncology Drug Discovery. Curr. Protoc Pharmacol 73, 14.39.1–14.39.20. [DOI] [PMC free article] [PubMed] [Google Scholar]
- (37).Zhang J, Li Y, Slania S, Yadav NN, Liu J, Wang R, Zhang J, Pomper MG, van Zijl PC, Yang X, et al. (2018) Phenols as Diamagnetic T2 -Exchange Magnetic Resonance Imaging Contrast Agents. Chem. - Eur. J. 24 (6), 1259–1263. [DOI] [PMC free article] [PubMed] [Google Scholar]
- (38).Zhang J, Han Z, Lu J, Li Y, Liao X, van Zijl PC, Yang X, and Liu G (2018) Triazoles as T2 -Exchange Magnetic Resonance Imaging Contrast Agents for the Detection of Nitrilase Activity. Chem. - Eur. J. 24 (56), 15013–15018. [DOI] [PMC free article] [PubMed] [Google Scholar]
- (39).Lee HS, and Park SW (2016) Systemic Chemotherapy in Advanced Pancreatic Cancer. Gut Liver 10 (3), 340–7. [DOI] [PMC free article] [PubMed] [Google Scholar]
- (40).Zhou Z, and Lu ZR (2017) Molecular Imaging of the Tumor Microenvironment. Adv. Drug Delivery Rev. 113, 24–48. [DOI] [PubMed] [Google Scholar]
- (41).Provenzano PP, Cuevas C, Chang AE, Goel VK, Von Hoff DD, and Hingorani SR (2012) Enzymatic Targeting of the Stroma Ablates Physical Barriers to Treatment of Pancreatic Ductal Adenocarcinoma. Cancer Cell 21 (3), 418–29. [DOI] [PMC free article] [PubMed] [Google Scholar]
- (42).Ding Y, Zhou J, Sun H, He D, Zeng M, and Rao S (2013) Contrast-Enhanced Multiphasic CT and MRI Findings of Adenosquamous Carcinoma of the Pancreas. Clin Imaging 37 (6), 1054–60. [DOI] [PubMed] [Google Scholar]
- (43).Reagan-Shaw S, Nihal M, and Ahmad N (2008) Dose Translation from Animal to Human Studies Revisited. FASEB J. 22 (3), 659–61. [DOI] [PubMed] [Google Scholar]
- (44).Rivlin M, and Navon G (2018) Cest Mri of 3-O-Methyl-D-Glucose on Different Breast Cancer Models. Magn. Reson. Med. 79 (2), 1061–1069. [DOI] [PubMed] [Google Scholar]
- (45).Lindig T, Zaiss M, Herz K, Deshmane A, Bender B, Golay X, and Scheffler K (2019) Glint: Glucocest in Neoplastic Tumours at 3T-First-in-Man Studies of GlucoCEST in Glioma Patients. Insights into Imaging 10 (Supplement 1), B-0095, S206. [Google Scholar]
- (46).Dreher MR, Liu W, Michelich CR, Dewhirst MW, Yuan F, and Chilkoti A (2006) Tumor Vascular Permeability, Accumulation, and Penetration of Macromolecular Drug Carriers. J. Natl. Cancer Inst 98 (5), 335–44. [DOI] [PubMed] [Google Scholar]
- (47).Kobayashi H, Longmire MR, Ogawa M, and Choyke PL (2011) Rational Chemical Design of the Next Generation of Molecular Imaging Probes Based on Physics and Biology: Mixing Modalities, Colors and Signals. Chem. Soc. Rev. 40 (9), 4626–48. [DOI] [PMC free article] [PubMed] [Google Scholar]
- (48).Li MQ, Tang ZH, Zhang Y, Lv SX, Yu HY, Zhang DW, Hong H, and Chen XS (2014) LHRH-Peptide Conjugated Dextran Nanoparticles for Targeted Delivery of Cisplatin to Breast Cancer. J. Mater. Chem. B 2 (22), 3490–3499. [DOI] [PubMed] [Google Scholar]
- (49).Tang Q, Cao B, Lei X, Sun B, Zhang Y, and Cheng G (2014) Dextran-Peptide Hybrid for Efficient Gene Delivery. Langmuir 30 (18), 5202–8. [DOI] [PubMed] [Google Scholar]
- (50).Liu G, Moake M, Har-el YE, Long CM, Chan KW, Cardona A, Jamil M, Walczak P, Gilad AA, Sgouros G, et al. (2012) In Vivo Multicolor Molecular MR Imaging Using Diamagnetic Chemical Exchange Saturation Transfer Liposomes. Magn. Reson. Med. 67 (4), 1106–13. [DOI] [PMC free article] [PubMed] [Google Scholar]
- (51).Kim M, Gillen J, Landman BA, Zhou J, and van Zijl PC (2009) Water Saturation Shift Referencing (WASSR) for Chemical Exchange Saturation Transfer (CEST) Experiments. Magn. Reson. Med. 61 (6), 1441–50. [DOI] [PMC free article] [PubMed] [Google Scholar]
- (52).Liu J, Han Z, Chen G, Li Y, Zhang J, Xu J, van Zijl PCM, Zhang S, and Liu G (2018) CEST MRI of Sepsis-Induced Acute Kidney Injury. NMR Biomed. 31 (8), e3942. [DOI] [PubMed] [Google Scholar]
Associated Data
This section collects any data citations, data availability statements, or supplementary materials included in this article.


