

SUMMARY
Parvalbumin (PV)-expressing GABAergic neurons are the largest class of inhibitory neocortical cells. We visualize brain-wide, monosynaptic inputs to PV neurons in mouse barrel cortex. We develop intersectional rabies virus tracing to specifically target GABAergic PV cells and exclude a small fraction of excitatory PV cells from our starter population. Local inputs are mainly from layer (L) IV and excitatory cells. A small number of inhibitory inputs originate from LI neurons, which connect to LII/III PV neurons. Long-range inputs originate mainly from other sensory cortices and the thalamus. In visual cortex, most transsynaptically labeled neurons are located in LIV, which contains a molecularly mixed population of projection neurons with putative functional similarity to LIII neurons. This study expands our knowledge of the brain-wide circuits in which PV neurons are embedded and introduces intersectional rabies virus tracing as an applicable tool to dissect the circuitry of more clearly defined cell types.
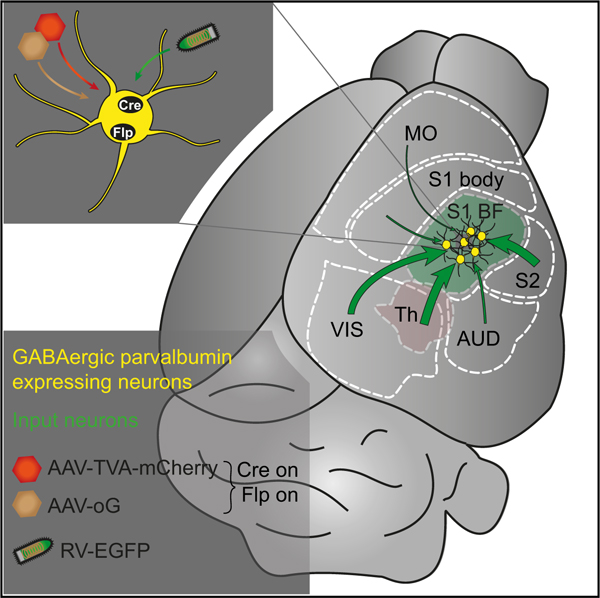
Graphical Abstract
In Brief
Hafner et al. develop constructs for intersectional rabies virus tracing to map brain-wide, monosynaptic inputs to cortical inhibitory parvalbumin cells. They find extensive local innervation by excitatory cells, inputs from inhibitory cells in layer I, and a strong contribution of layer IV projection neurons to cortical long-range inputs.
INTRODUCTION
Sources of synaptic input define the circuits through which a neuron can be activated. Knowing the precise cell types, in defined areas, providing input to an identified neuron is an important step in generating hypotheses about the emergent computations this neuron is capable of (Callaway, 2016; Helmstaedter et al., 2013). Therefore, comprehensive mapping of the afferent connectome of well-defined cell classes has become an essential aspect of studying the functional organization of circuits (Luo et al., 2018; Nassi et al., 2015).
GABAergic neurons are indispensable in maintaining a finetuned excitation-inhibition balance, which is crucial for information processing in the neocortex (Feldmeyer et al., 2018; Isaacson and Scanziani, 2011; Tremblay et al., 2016). Parvalbumin (PV)-expressing interneurons are the largest class, constituting roughly 40% of all neocortical GABAergic neurons (Lee et al., 2010; Pfeffer, 2014). They include basket cells and, to a much smaller extent, chandelier cells (Tremblay et al., 2016).
PV cell somata are present in all cortical layers except for LI (Almási et al., 2019). PV cells usually have an aspiny, multipolar dendritic arbor, which for LIV PV cells is confined mostly to the home layer and column (Koelbl et al., 2015). For upper and deep layer PV cells, dendrites usually extend across laminar and columnar borders (Bortone et al., 2014; Packer and Yuste, 2011; Wang et al., 2002). Because of their widespread distribution and dendritic extent, they are ideally suited to sample input from different cortical and subcortical areas (D’Souza et al., 2016; Staiger et al., 1996, 2009). PV neurons direct their output via an extensive axonal arborization, inhibiting mainly the cell soma and proximal dendrites of their postsynaptic targets (Freund and Katona, 2007). PV cells are biologically optimized to provide a very fast, strong, and precise inhibition to their postsynaptic cells (Hu et al., 2014). They have been shown to mediate feedforward (Beierlein et al., 2003; Cruikshank et al., 2010; Pouille and Scanziani, 2001; Pouille et al., 2009) as well as feedback (Beierlein et al., 2003) inhibition, to modulate the gain of sensory responses (Atallah et al., 2012; El-Boustani and Sur, 2014; Lee et al., 2012), and to generate gamma oscillations (Cardin et al., 2009; Sohal et al., 2009). Finally, PV cells have been associated with plasticity and learning, too (Donato et al., 2013; Kuhlman et al., 2013; Letzkus et al., 2011; Sparta et al., 2014; Yazaki-Sugiyama et al., 2009).
To understand what kind of afferent inputs can modulate the inhibitory activity of PV cells, we first need precise and comprehensive knowledge of their sources of activation. We mapped both local and long-range inputs to GABAergic PV cells in mouse barrel cortex.
The monosynaptic rabies virus (RV) tracing system has become the state-of-the-art technique to visualize brain-wide inputs to a specific class of neurons (Wall et al., 2010; Wickersham et al., 2007). We advanced this system to perform intersectional RV tracing. This approach was motivated to exclude a contamination of the tracing by excitatory PV cells (van Brederode et al., 1991), which we found to make up a small but substantial part in LV of the whole PV population, labeled in a widely used PV-Cre mouse (Hippenmeyer et al., 2005). We bred Vgat-Cre/ PV-Flp mice that co-express Cre and Flp in the intersectional population of GABAergic PV cells (Madisen et al., 2015). We combined it with intersectional helper viruses to express genes for RV transduction and monosynaptic spread (Fenno et al., 2014, 2017). Tracing PV cell inputs in the mouse barrel cortex visualized a dense local connectome as well as long-range projections. Within the local circuitry, we dissected an inhibitory connection from LI interneurons to LII/III PV cells, which could act as a disinhibitory motif. Long-range connections originated mostly from ipsilateral visual, auditory, secondary somatosensory cortex (S2), and the thalamus. The projection from visual cortex to barrel cortex was strongly carried by LIV neurons, calling into question the role of LIV as a mere thalamic input layer. We show that intersectional tracing holds the potential to expand the RV tracing approach to molecularly defined subpopulations of neurons, advancing cell-type-specific circuit mapping to a more precise level.
RESULTS
Our main aim was to study the brain-wide, afferent inputs to PV-expressing GABAergic cells in the mouse barrel cortex, using RV tracing. This technique usually combines a modified RV with Cre-dependent helper viruses and a Cre-driver mouse line to visualize inputs to the Cre-expressing cell class (Wall et al., 2010; Wickersham et al., 2007). For the tracing to be specific and conclusive, Cre must be present in all cells and only in cells of the target type (Wall et al., 2010).
Motivation to Use Intersectional RV Tracing
Our initial tracing experiments using a PV-Cre line revealed an uptake of virus into pyramidal-shaped neurons in LV that were negative for PV antibody staining (Figures S1A and S1B). Fluorescent in situ hybridization for vGluT1 in PV-Cre/tdTomato mice revealed that 10.8% ± 2.9% of Cre-expressing cells in LV were excitatory (n = 2 mice, eight sections; Figure S1C), presumably because of a low-level expression of PV (van Brederode et al., 1991). To avoid tracing partly excitatory cells, we developed an intersectional approach to isolate the inhibitory population of cortical PV cells (Fenno et al., 2014; Madisen et al., 2015). We bred Vgat-Cre/PV-Flp mice that co-express the site-specific recombinases Cre and Flp in all GABAergic PV neurons. After crossing with the respective tdTomato reporter mouse line (Ai65), we confirmed the almost complete absence of vGluT1 signal in tdTomato-positive cells (0.2% ± 0.4%; n = 2 mice, eight sections; Figure S1C). These results suggest that the Vgat-Cre/ PV-Flp line makes it possible to target the GABAergic population of PV-expressing cells with specificity close to 100%.
To use this mouse line for tracing experiments, we generated two intersectional viruses (Figures S2A and S2F): (1) AAV8-Con/ Fon-TVA-mCherry (AAV-TVA-mCh), expressing the cell surface receptor TVA, required for uptake of modified RV, and the red fluorophore mCherry; and (2) AAV8-Con/Fon-oG (AAV-oG), expressing the optimized rabies glycoprotein (oG; Kim et al., 2016), required for spread of RV to presynaptic terminals. We validated the constructs in vitro, showing that their expression depends on the recombination by both Cre and Flp (Figures S2B–S2E and S2G–S2I).
Two weeks after injection of helper viruses into barrel cortex of Vgat-Cre/PV-Flp mice, RV-DG-EGFP (EnvA) (RV-EGFP) was injected at the same location. It was pseudotyped with the avian sarcoma leucosis virus coat protein EnvA, the ligand of TVA receptor, to restrict its transduction to TVA expressing cells. Its glycoprotein was deleted from the genome and replaced with the sequence for EGFP. In cells containing AAV-delivered oG, trans-complementation of oG allowed RV-EGFP to spread to first-order presynaptic cells. Because this RV expressed EGFP, the presynaptic neurons appeared green. The starter cell population, from which RV had spread, appeared yellow because of the mixture of EGFP and mCherry (Figures 1A–1C).
Figure 1. Experimental Strategy for Intersectional RV Tracing of GABAergic PV Cells in Mouse Barrel Cortex.

(A) Viral constructs. Proper expression of genes carried by AAV helper viruses (TVA-mCherry, oG) depends on the correct orientation of the constructs’ exons enabled by the recombination by both Cre and Flp and the subsequent splicing of artificial introns (black boxes). Modified RV has its G protein replaced by EGFP and is pseudotyped with EnvA.
(B) Experimental timeline of virus injections.
(C) After the expression of TVA-mCh and oG in Cre- and Flp-positive, GABAergic PV cells by AAV helper viruses, RV selectively transduces these cells and spreads to first-order presynaptic neurons. PV starter cells appear yellow because of the mixture of AAV-mCh and RV-EGFP, while presynaptic partners exclusively express RV-EGFP.
(D) For injection of AAVs, the C2 whisker-related column in barrel cortex was mapped performing intrinsic signal optical imaging and targeted by the injection pipette.
Viral Injection Was Centered on the C2 Column
We directed all our virus injections to the barrel cortex, where each whisker has a corresponding columnar representation. However, the cytoarchitecture of each whisker-related column is unique and slightly different from each other (Meyer et al., 2013). To achieve a highly homogeneous population of PV starter cells that is well comparable among animals, we centered our injection onto the C2 column, which we targeted using intrinsic signal optical imaging (ISOI; Grinvald et al., 1986; Guy et al., 2015; Figure 1D). Stimulation of the C2 whisker elicited a hemodynamic signal at the corresponding location of the C2 column, which we mapped on the blood vessel pattern at the brain surface (Figures S3A and S3B). In a proof-of-principle experiment, we localized the C2 column in a Scnn1a-Cre/tdTomato mouse, which labels LIV cells with tdTomato. The injection with DiO crystals was well targeted toward the C2 barrel (Figure S3C). For virus injections, we did not attempt to restrict out starter cell population to just one column but intended to center it on C2. The actual spread of virus encompassed an area with an average diameter of about 670 μm (n = 12 mice) and therefore a large part of the barrel field.
Control Experiments Reveal a Leak of ‘‘Invisible’’ TVA
To verify that not just the mouse line but also the viruses have high specificity, we performed several control experiments. First, we injected RV-EGFP without prior injection of the AAVs in Vgat-Cre/PV-Flp mice to verify that the transduction of RV-EGFP depends exclusively on its interaction with TVA. We did not detect any EGFP-labeled cell (Figure 2A), confirming that our RV-EGFP fails to transduce TVA-negative cells.
Figure 2. Validating Intersectional Constructs for Cell-Type-Specific Tracing In Vivo.

(A) Coronal section through the barrel cortex of a Vgat-Cre/PV-Flp mouse after injection of RV-EGFP, without prior injection of helper AAVs. No transduced cells were detected, demonstrating that RV-EGFP transduction is TVA-dependent (cell counts: n = 2 mice, 16 sections).
(B–D) Coronal sections of wild-type (WT; B), PV-Flp (C), and Vgat-Cre (D) mice after the injection of AAV-TVA-mCh and AAV-oG into barrel cortex and subsequent RV-EGFP. Even in the absence of all or one recombinase, TVA was expressed, allowing RV-EGFP to enter cells at the injection site. oG was not expressed, preventing RV-EGFP from spreading transsynaptically to cells outside the injection site (cell counts: WT, n = 4 mice, 24 sections; PV-Flp, n = 4 mice, 22 sections; Vgat-Cre, n = 5 mice, 30 sections).
(E) Injection of AAV-TVA-mCh alone (no AAV-oG that enables transsynaptic spread) into a Vgat-Cre/ PV-Flp animal followed by RV-EGFP injection. Cells were solely counted on sections with large numbers of double-labeled cells. Injections yielded mostly double-labeled, PV-positive cells but also a few mCherry-negative, EGFP-positive cells. These exclusively green cells made up on average 16% of all EGFP-positive cells and are a result of direct RV-EGFP entry, because of low-level expression of TVA in the absence of Cre/Flp. Because these cells do not have a mCherry signal, we termed this phenomenon ‘‘invisible TVA’’ (cell counts: n = 4 mice, 10 sections; scale bar inset, 20 μm).
(F) Injection of AAV-TVA-mCh and AAV-oG into a Vgat-Cre/PV-Flp animal followed by RV-EGFP injection. This injection reflects the experimental conditions. Cells were counted on all sections containing starter cells (cell counts: n = 12 mice, 237 sections).
Scale bars: overview, 1,000 μm; inset, 200 μm. Cell counts are mean of cells per section.
Second, we investigated if the AAVs’ recombination only happens in the presence of both recombinases. We injected wild-type mice with experimental titers of AAV-TVA-mCh and AAV-oG and later RV-EGFP. We observed weakly mCherry-positive cells as well as a small number of EGFP-positive cells at the injection site (Figure 2B). This was also the case when we injected the same virus combination in either Vgat-Cre or PV-Flp mice, where one recombinase was present, except that the number of EGFP-positive cells was slightly higher (Figures 2C and 2D). However, we never observed EGFP-positive cells outside of the injection site.
There are two possibilities why EGFP-positive cells occur at the injection site. (1) They result from transsynaptic labeling caused by recombinase-independent leak expression of TVA and oG. An indicator that oG is expressed in the absence of recombinases would be transsynaptic spread of RV-EGFP. If the EGFP-positive cells at the injection site were transsynaptically labeled, we would expect at least a few cells in distant areas as well, which was never the case. To provide additional evidence that oG expression is exclusively switched on in the presence of Cre and Flp, we injected AAV-oG (and AAV-TVA-mCh) into PV-Flp and Vgat-Cre mice and performed antibody staining against oG. We could barely detect any labeling in these mice, unlike in injected Vgat-Cre/PV-Flp animals (Figure S4). This evidence argues against the possibility that EGFP-positive cells at the injection site result from transsynaptic labeling. (2) Instead, EGFP-positive cells could result from a direct uptake of RV because of low-level expression of TVA (Do et al., 2016; Faget et al., 2016; Miyamichi et al., 2013; Watabe-Uchida et al., 2012; Weissbourd et al., 2014). EnvA-pseudotyped RV is highly sensitive to TVA (Wall et al., 2010). Therefore, a small number of TVA molecules can already permit RV entry into cells. If TVA is expressed in a recombinase-independent way, RV-EGFP could enter these cells directly, making them appear as transsynaptically labeled. To investigate the extent of possible TVA leak, we injected AAV-TVA-mCh without AAV-oG into Vgat-Cre/PV-Flp mice and later RV-EGFP (n = 4 injections, ten sections; Figure 2E). About 15.7% ± 6.1% of the transduced cells were EGFP-positive, mCherry-negative cells. Because no oG was provided, RV must have transduced them directly because of TVA’s leaky expression. These cells displayed no mCherry signal, making the TVA ‘‘invisible.’’ This suggests that recombinase-independent expression of ‘‘invisible’’ TVA and not oG is responsible for the exclusively green cells at the injection site in our control experiments.
Of note, in our control experiments we observed low-intensity mCherry labeling that barely overlapped with the EGFP signal. However, when we injected AAV-TVA-mCh into Vgat-Cre/PV-Flp animals, we found that about 96.6% ± 3.89% (n = 4 mice, 11 sections) of TVA-mCherry-positive cells were co-labeled with PV immunostaining, indicating high specificity of the virus (Figure 3B). We do not have a clear explanation for this discrepancy but assume that in experimental conditions, mCherry labeling is directed mostly to PV cells.
Figure 3. Identification of Starter Cells in Vgat-Cre/PV-Flp Mice.

(A) Coronal section through an injection site in right barrel cortex (scale bar, 1,000 μm).
(B) Inset in (A). Cells marked by white arrowheads are AAV-TVA-mCh and RV-EGFP co-transduced, putative starter cells. They are almost entirely positive for PV protein (scale bar, 100 μm).
(C) Distribution of putative starter cells across cortical layers (n = 12 mice; mean ± SD).
In sum, these control experiments indicate that our intersectional viruses allow the specific tracing of long-range projections to GABAergic PV cells. Tracing of local circuits is slightly confounded because transsynaptically labeled, RV-EGFP-positive cells are indistinguishable from cells directly transduced by RV-EGFP because of ‘‘invisible’’ TVA leak.
PV Starter Cells Occur in LII–VI
Vgat-Cre/PV-Flp mice (n = 12) were injected with AAV-TVA-mCh and AAV-oG into the C2 column of the right barrel cortex and 2 weeks later with RV-EGFP at the same location. After 1 more week, animals were sacrificed, and the brain was sectioned coronally (Figure 3A). Cells double-labeled with mCherry and EGFP were considered putative starter cells (Figure 3B). They were present in all cortical layers, except LI (Figure 3C), and their distribution mirrored the distribution of PV cells across layers (Almási et al., 2019).
It is important to mention that we very likely overestimate the number of starter cells, for three reasons. First, because AAV-oG did not carry a fluorescent tag, we cannot say with absolute certainty that all double-labeled cells contained oG. Staining with oG antibody revealed that on average 86.1% ± 8.4% of TVA- and EGFP-positive starter cells co-expressed oG (Figures S4A and S4B; two mice, eight sections). Second, oG needs to build up to a critical concentration to allow the assembly of retrogradely infectious particles, so that the mere presence of oG does not necessarily guarantee transsynaptic spread (Weible et al., 2010). Third, PV cells are highly interconnected among one another (Karnani et al., 2016; Pfeffer et al., 2013). Therefore, PV cells that took up TVA-mCherry can either be directly transduced by RV-EGFP or retrogradely if they connect to a real starter PV cell. Because of these confounding factors, we abstained from calculating a ratio between starter cells and presynaptic cells as a means of normalization but instead calculated proportions of inputs from different layers and areas.
The Population of PV Cells Receives Predominantly Local, Excitatory Inputs
We manually counted all transsynaptically labeled cells on all sections throughout the rostro-caudal extent of the brain, from bregma +3 to –4.5 mm. Each section was overlaid with the corresponding section of the Paxinos mouse atlas (Paxinos and Franklin, 2001). EGFP-positive cells were assigned to specific areas, on the basis of the overlay and cytoarchitectonic features discernable with nuclear stain. Absolute input cell numbers are reported in Table S1. All inputs within barrel cortex were classified as local. They made up 91.2% ± 4.8% of total inputs, which suggests that the intra-areal activity within the barrel cortex exerts greater influence on PV cells than long-range inputs. We calculated the proportion of local inputs in each layer, as defined by the soma position of the presynaptic neuron (Figure 4A). Almost half of the presynaptic cells were located in LIV, where cells mostly lacked an apical dendrite, suggesting that they were spiny stellate cells.
Figure 4. Local Inputs to PV Cells.

(A) Distribution of RV-EGFP-positive cells across cortical layers (n = 12 mice; mean ± SD).
(B) Coronal section through the injection site that underwent fluorescence in situ hybridization (FISH) for the excitatory neuron marker vGluT1 (scale bar, 200 μm).
(C) Inset in (B). White arrowheads mark RV-EGFP-positive cells co-localizing vGluT1 probe-derived fluorescence (scale bar, 50 μm).
(D) Fraction of vGLuT1-positive inputs in each layer (n = 4 mice, 16 sections; mean ± SD).
(E) Fraction of vGluT1-positive inputs among all local inputs in each layer (n = 4 mice, 16 sections; mean ± SD).
To study the balance of excitatory and inhibitory inputs to PV cells, we performed fluorescent in situ hybridization for vGluT1, SST, and VIP on sections spanning the injection site. A total of 68.2% ± 7.0% of local inputs were positive for the excitatory marker vGluT1 (Figure 4B), which was roughly the same for each layer individually (Figure 4D). This means that PV neurons, as a population, are dominated by excitatory inputs. These excitatory inputs originated mostly from LIV (Figure 4E). The staining for SST and VIP yielded such small numbers of co-localization rates with EGFP-positive cells (1.9% for VIP and 1.0% for SST) that we did not analyze them further.
LI Interneurons Inhibit PV Neurons in Upper LII/III
To investigate which cell types provide inhibition on PV cells, other than PV cells themselves (Pfeffer et al., 2013), we focused on LI interneurons that made up 5.5% ± 5.5% of local inputs and were confirmed to be exclusively inhibitory by in situ hybridization for GAD1 (Figure S5A). The axonal outreach of most LI neurons is confined predominantly to LI but does extend into deeper layers (Abs et al., 2018; Jiang et al., 2015; Schuman et al., 2019). On the basis of this previous work, we hypothesized that PV cells in LII/III could be a major target of LI neurons. We switched to glutamate uncaging experiments to provide independent evidence for a direct connection of LI neurons to PV cells in LII/III. We generated thalamocortical slices through barrel cortex in which PV cells were labeled with tdTomato. While recording inhibitory postsynaptic currents from single PV cells throughout the depth of LII/III, we aimed to activate inhibitory cells in LI–LIV with photolysis of caged glutamate. Before each experiment, we adjusted the laser power to LI cells to make sure they were activated by our optical stimulation. An activation map of an example cell is depicted in Figures S5C and S5D. Six of ten LII/III PV cells showed inhibitory synaptic responses upon stimulation of LI. Therefore, the population of PV cells in LII/III receives reliable input from LI interneurons (Figure S5E). The closer the PV cell was to the pial surface, the more stimulated fields in LI caused a response (number of activated fields in LI = −9.3 × depth + 313.9, R2 = 0.47; Figure S5F). These experiments demonstrate a functional connection between LII/III PV cells and LI inhibitory neurons, revealing another potential disinhibitory motif in barrel cortex.
PV Cells Receive Long-Range Cortical and Subcortical Input
Next, we analyzed the fraction of long-range inputs originating outside the barrel cortex. The main sources of long-range input were secondary somatosensory cortex, visual cortex, auditory cortex, and the thalamus (Figures 5A–5D). For quantification, we distinguished cortical (64.4% ± 13.6% of total long-range inputs) and subcortical (35.6% ± 13.6% of total long-range inputs). We calculated the percentage of inputs from each area as a fraction of the total cortical or subcortical inputs, respectively (Figure 5E). The most numerous cortical input stemmed from secondary somatosensory cortex, which made up almost 40% of all cortical inputs. The dominant subcortical input was with approximately 72% the ventral posteromedial nucleus of the thalamus (VPM).
Figure 5. Long-Range Inputs to PV Cells.

(A–D) Images with corresponding Paxinos mouse atlas section showing the most prominent location of long-range inputs to PV cells in barrel cortex. Examples are from secondary somatosensory cortex (S2; A), secondary auditory cortex ventral area (AuV; B), primary and secondary visual cortex (V1, V2L; C), and ventral posteromedial nucleus and posteromedial complex of the thalamus (VPM, POm; D). Cortical neurons predominantly had a pyramidal morphology, suggesting an excitatory nature of the cortical long-range inputs (scale bars: overview, 1,000 μm; inset, 200 μm).
(E) Proportion of cortical and subcortical long-range input areas. Cells in areas of similar functionality (i.e., primary and secondary visual cortex) were pooled together. Numbers in brackets indicate in how many brains (from the total sample of n = 12) in this area contained labeled cells.
LIV Visual Cortex Projects to PV Neurons in the Barrel Cortex
Subsequently, we analyzed the distribution of cortical inputs across layers, excluding inputs from motor cortex because of the nearly absent LIV. We calculated the proportion of transsynaptically labeled, long-range projection neurons localized in LII/III (18.4% ± 5.3%), LIV (46.3% ± 12.8%) and LV/VI (35.3% ± 10.6%) (Figure 6A). The number of projection neurons was significantly different among the three layer compartments (ANOVA, F = 23.5, p < 0.001). In fact, LIV had a higher number of projection neurons than upper or deep layers (Tukey test, p < 0.001 for LIV versus LII/III and p < 0.05 LIV versus LV/VI). Next, we calculated the proportion of projection neurons in each layer compartment for the main input areas individually. In no area, LIV contained fewer projection neurons than upper or deep layers but instead tended to contain more projection neurons that the ‘‘associative’’ LII/III. In visual cortex, LIV even stood out as the dominant projection layer (LII/III, 25.8% ± 11.1%; LIV, 57.5% ± 14.6%; LV/VI, 11.7% ± 3.4%; Tukey test, p < 0.001 for both LIV versus LII/III and LIV versus LV/VI).
Figure 6. Laminar Analysis of Cortical Long-Range Inputs to PV Cells.

(A) Fraction of long-range inputs by layer compartment from all cortical areas, except motor cortex (ANOVA, F = 23.48, p < 0.001, post hoc Tukey analysis; mean ± SD).
(B–E) Fraction of long-range inputs by layer compartment from secondary somatosensory cortex (S2; B), visual cortex (C), auditory cortex (D), and primary somatosensory cortex (S1) body representation (E). LIV always contained a larger or an equal number of projection neurons than upper or deep layers. In visual cortex, it even contained the largest number of projection neurons.
*p < 0.05, **p < 0.01, and ***p < 0.001.
We found that retrogradely labeled projection neurons in visual cortex LIV were often at the border between LIII and IV, opening the possibility that these are deep LIII cells (Figure S6A). To check if actual LIV cells in visual cortex project to barrel cortex, we performed a series of experiments. First, we performed additional RV-tracing experiments and stained for the LIV marker RorB on sections of visual cortex that contained transsynaptically labeled cells (Figure S6B). The band of RorB cells was even thicker than the higher cell density we delineated with DAPI as LIV and contained all transsynaptically labeled cells we assigned to LIV. This assured us that we correctly assigned these border cells to the extent of LIV.
Next, we injected the anterograde tracer AAV2/1-FLEX-tdTomato into visual cortex of LIV-specific Scnn1a-Cre mice (n = 2 mice; Figures S6C and S6D), to visualize fibers from LIV cells reaching barrel cortex. The fiber density was highest in LII/III of barrel cortex, but we could find putative synaptic contacts between fibers and PV neurons throughout all layers of barrel cortex (Figures S6E–S6H). This experiment adds complementary evidence that LIV cells in visual cortex maintain prominent long-range connections to barrel cortex.
Because these layer IV cells seem to contact many neurons other than PV, too, we wanted to find out if this layer in general sends more fibers to barrel cortex than upper or deep layers. We injected non-cell-type-specific retrograde tracers into the barrel cortex and counted the number of labeled neurons in visual cortex in the different layer compartments. Because different tracers could have different tropism for certain neurons (Sun et al., 2019), we used Alexa 488-conjugated cholera toxin subunit B (CTb Alexa 488), AAV-retro-EGFP, and RV-SADΔG-EGFP (SAD-G) (Figures S6I–S6N; n = 8 mice) to not solely rely on one tracer. Because we found no particular bias for any tracer, we pooled them. LII/III and LIV of visual cortex contained the same proportion of projection neurons (Figure S6P; LII/III, 40.3% ± 15.9%; LIV, 40.3% ± 14.3%; LV/VI, 19.4% ± 11.9%). The dominant LIV input to PV cells is thus not reflected in the general inputs from visual cortex.
Of note, also the non-cell-type-specific tracers often labeled LIV neurons close to the LIII border. Again, we wanted to investigate if these LIV cells carry the molecular makeup of LIV. We injected RV-SADΔG-EGFP (SAD-G) in barrel cortex of Scnn1a-Cre/tdTomato mice (Figures S6M–S6O; n = 2 mice), as this was the only tracer whose signal was bright enough to distinguish labeled neurons from the green bleed-through background of the very strong tdTomato signal. We identified retrogradely labeled neurons in visual cortex. Surprisingly, just 35.5% of putative LIV neurons co-localized with tdTomato signal, although they were within the borders of the LIV delineated by tdTomato. In consequence, there is the possibility that the scnn1a-negative cells we ascribed to LIV do not share the molecular fate of LIV cells. This might be especially the case for deep LIII cells that reside at the LIV border.
In sum, these experiments show that LIV cells in visual cortex form long-range projections. Both scnn1a-positive and scnn1a-negative cells within the borders of LIV constitute this population of projection neurons. It seems that PV cells sample more input from these LIV cells than the general population of cells in barrel cortex.
DISCUSSION
Retrograde RV tracing has been established as the state-of-the-art technique for visualizing brain-wide inputs to a certain cell type. Here we present intersectional RV tracing to target specifically GABAergic PV neurons. We developed this approach to exclude the small, excitatory PV population that has been found by us and others (Madisen et al., 2015; Wall et al., 2010). Previous attempts to isolate a GABAergic subpopulation of neurons have used viruses with promoters or enhancers specific to inhibitory neurons (Dimidschstein et al., 2016; Liu et al., 2013). Our intersectional strategy proved to be very successful in abolishing the excitatory PV population. Using intersectional viruses in combination with the Vgat-Cre/PV-Flp mouse line, we mapped local and long-range inputs to GABAergic PV cells in barrel cortex.
Confounders of RV Tracing
RV tracing appears to be the ideal method to label both local and long-range inputs. However, both kinds of inputs are subject to distorting factors, which should be taken into consideration when interpreting the results.
Local input can be distorted by leak of TVA (DeNardo et al., 2015; Do et al., 2016; Faget et al., 2016; Miyamichi et al., 2013; Watabe-Uchida et al., 2012; Weissbourd et al., 2014; Zhang et al., 2016). Low-level leak of TVA, in the absence of recombinases, allows RV to enter cells because of the high affinity of its EnvA-pseudotyped envelope to the receptor. These cells display no detectable mCherry signal, making their TVA leak ‘‘invisible.’’ Upon RV uptake they appear as transsynaptically labeled cells, leading to an overestimation of the true count of presynaptic cells. However, we expect that proportions of local inputs among layers are unaffected by this error because the leak seems to be a random phenomenon. We emphasize the importance of conducting additional experiments to verify local connections revealed by RV tracing, as we have done with glutamate uncaging for the LI input.
The main error when analyzing long-range input stems from its incompleteness. The spread of RV to presynaptic neurons is dependent largely on the amount of glycoprotein present to reconstitute infectious particles (Callaway and Luo, 2015; Weible et al., 2010). Because our numbers of retrogradely labeled cells are lower than reported by others performing Cre-dependent tracing of PV cells (Miyamichi et al., 2013; Wall et al., 2016), we assume that the requirement for double-dependent recombination of oG exacerbates its buildup of high levels. Higher titer of AAV-oG as well as use of different AAV serotypes might improve the efficacy of the tracing.
Furthermore, RV is not inherently designed to jump at every synapse (Ghanem and Conzelmann, 2016; Luo et al., 2008). Individual PV neurons in the rat hippocampus receive up to 16,000 synapses (Gulyás et al., 1999), while LIII pyramidal cells in mouse visual cortex have about 4,400 spines to receive input (Gilman et al., 2017). Considering that we counted on average 3,000 inputs for our whole starter population, it becomes obvious that this technique can reveal only a small fraction of the whole connectivity scheme. In consequence, it has become a habit for rabies tracing studies to report ratios with which different inputs are labeled. However, these ratios rest on the assumption that RV spreads to all presynaptic neurons with equal probability. This might not be the case. If a population of presynaptic cells establishes more synaptic contacts, their probability of being traced might increase. Furthermore, RV could preferentially avoid or cross certain synapses dependent on their receptor’s affinity for glycoprotein. It has been speculated that RV has greater affinity toward the limbic system (Ghanem and Conzelmann, 2016). On the contrary, RV seems to be less likely to trace inputs from prefrontal cortex (Sun et al., 2019), from somatostatin-expressing cells (Ährlund-Richter et al., 2019), or from mitral cells in the olfactory bulb (Deshpande et al., 2013). Although RV can reveal synaptic connections, the connection’s relative impact on a cell type should be determined by functional experiments (Callaway and Luo, 2015).
Local Inputs Are Predominantly Excitatory and Contain a Disinhibitory Motif
The local input to PV neurons outweighed the long-range input by about 10-fold. In fact, 91% of total inputs to PV cells originated from the ipsilateral barrel cortex. This number is a slight overestimation because of the confounder caused by leak of TVA and subsequent direct transduction of cells by RV at the injection site, as discussed above. Nevertheless, this proportion is comparable with the 79% of inputs within barrel cortex to excitatory LV cells (DeNardo et al., 2015). Barrel cortex seems to be a highly interconnected area in which local inputs dominate.
LIV provided the majority of inputs to PV neurons within barrel cortex, also being the hub of excitatory inputs. This fits with the finding that LIV drives the activity of fast spiking cells to sharpen sensory responses (Pluta et al., 2015). Among inhibitory inputs, we focused on the fraction of inputs from LI. Although there are relatively few cells in LI, they made up about 5% of all local inputs to PV cells. We could show that LI cells target LII/III PV cells. The postsynaptic, excitatory targets of PV cells innervated by LI interneurons are pyramidal neurons in LII/III and LV (Lee et al., 2015). This disinhibitory motif from LI IN → LII/III PV → LII/III/V pyramidal neurons could provide the anatomical basis for a gating mechanism, releasing inhibition of excitatory cells upon cortico-cortical input (De Marco García et al., 2015), higher order thalamic input (Cruikshank et al., 2012), or other subcortical inputs (Letzkus et al., 2011) arriving in LI. That this connection has behavioral relevance has been shown for the auditory cortex, where disinhibition of LII/III pyramidal neurons by the LI-LII/III PV cell connection mediated associative learning (Letzkus et al., 2011). Similarly, it has been speculated that LI interneurons affect the firing rate of PV cells in barrel cortex during a whisker-based stimulus detection task (Sachidhanandam et al., 2016).
We must emphasize that our approach did not allow to assess the proportion of local PV inputs among one another, although this might be the major drive of inhibition (Pfeffer et al., 2013). RV can spread among the highly interconnected PV cells because they contain oG. As a result, starter cells and transsynaptically labeled PV cells become indistinguishable. Because PV cells that appear as starter cells constitute an unknown fraction of inhibitory inputs converging on PV cells, the proportion of PV inputs is missing in our local connectivity profile.
Other Sensory Areas Are Major Input Sources of PV Cells in Barrel Cortex
When analyzing the long-range input to PV cells in the barrel cortex, we found that about two-thirds of the total long-range input originated from cortical and the remaining third from subcortical sources. Cortical input originated mainly from other sensory areas such as visual and auditory cortex, as well as S2, indicating a direct role of PV neurons in crossmodal sensory integration, as has already been shown for the integration of auditory and visual information (Song et al., 2017).
A previous study traced long-range inputs to PV cells in the barrel cortex using a PV-Cre line (Wall et al., 2016). We found a qualitatively almost identical set of inputs, but relative contributions from input areas were different. We saw a higher proportion of long-range inputs from visual cortex and a smaller from motor cortex. Moreover, input from the contralateral hemisphere was almost absent in our study, whereas it was a major input source in Wall et al. (2016). These differences must not necessarily be due to the potential contamination with excitatory cells in their PV-Cre line. Instead, already different volumes and titers of viruses could cause substantial differences in input maps (Guo et al., 2015). Furthermore, the barrel field is very large, and our injection site was more posterior than that of Wall et al. (2016). In general, different types of cortical excitatory and inhibitory neurons receive qualitatively similar inputs; only the convergence ratios and relative input proportions seem to differ among cell types (DeNardo et al., 2015; Wall et al., 2016). Therefore, future studies need very specific and sensitive techniques to assess subtle cell-type-specific differences. Hence, intersectional approaches might prove valuable in dissecting the relative impact of clearly defined neuronal populations (Yetman et al., 2019).
LIV Contains a Significant Part of Long-Range Projection Neurons
Our layer-dependent analysis of cortical long-range input revealed that LIV contributes substantially to long-range projections and in visual cortex even more than upper or deep layers. Research on the interconnectivity of primate cortical areas led to the dogma that LIV neurons receive thalamic and lower order area input but do not maintain feedforward projections, fostering a picture of LIV as an input layer (Felleman and Van Essen, 1991). Instead, LII/III has been ascribed the role of the major source of projections to higher order areas. LIV was not investigated in the study of Wall et al. (2016). In our experiments, the projection neurons in visual cortex were often localized at the border of LIII and LIV.
To check if indeed LIV cells in visual cortex project to barrel cortex, we performed anterograde and retrograde tracing experiments. We showed that LIV neurons in visual cortex labeled by the Scnn1a-Cre line target PV neurons in barrel cortex in all layers. However, this mouse line does not exclusively label LIV cells but also a few LV/VI cells. Although we expect that these LV/VI neurons maintain projections to barrel cortex, too, it is highly unlikely for them to be exclusively responsible for the innervation of PV cells in barrel cortex.
Retrograde tracing with non-cell-type-specific tracers showed an equal contribution of LIV and LII/III to the projections from visual to barrel cortex. Unlike in a previous tracing study with CTb only, we found only a minor fraction of projection neurons in LV/VI of visual cortex (Masséet al., 2017). Although the retrograde tracing does not suggest a dominant innervation of barrel cortex by LIV visual cortex in general, PV cells might receive more input from cells within LIV than the general population of neurons.
However, only a minority of LIV projection neurons expressed the LIV marker scnn1a. Although scnn1a is not an exhaustive marker of all LIV cells (Harris et al., 2014), it is possible that these scnn1a-negative projection neurons appear in the boundaries of LIV but have a closer functional similarity to cells in neighboring layers (Narayanan et al., 2015). This might especially be the case for deep LIII cells, because the LIII-LIV border has a fuzzy transition zone (Staiger et al., 2015). Perhaps these border neurons constitute a unique population that receives strong thalamic input while maintaining associate fibers to other cortical areas, which could serve the fast propagation of visual information for crossmodal integration. LIV might have a unique role as a projection layer in the visual cortex because its composition of excitatory cells is dominated by neurons with a pronounced apical dendritic tuft, mirroring the morphology of typical projection neurons (Gouwens et al., 2019). The physiological properties and relevance of this projection from visual to barrel cortex remain to be investigated further. Interestingly, for S2, a strong projection from LIV to barrel cortex, which carries information about whisker orientation, has been reported recently (Minamisawa et al., 2018).
Thalamic Projections Dominate Subcortical Long-Range Input
Subcortical input consisted almost exclusively of thalamic projections. The main thalamic input was from the VPM. Although PV neurons seem not to receive more thalamic input per cell than other interneuron types (Wall et al., 2016), they seem to be recruited the strongest (Cruikshank et al., 2010; Ji et al., 2016). In addition, they are highly abundant in the major thalamorecipient LIV, so that they have been ascribed the role as the major mediators of feedforward inhibition (Feldmeyer et al., 2018). This role is supported by our finding of a high proportion of thalamic inputs, comparable with proportions reported for excitatory cells in barrel cortex (DeNardo et al., 2015).
In summary, we showed that GABAergic PV cells receive a dense local innervation and long-range inputs mainly from other sensory areas and the thalamus. We focused on two circuit motifs: (1) the local connection from LI interneurons to LII/III PV cells, suggesting a disinhibitory circuit for precise gating of information processing, and (2) a long-range connection from the thalamorecipient LIV in visual cortex to barrel cortex, a possible highway for fast relay of visual information. We introduced intersectional RV tracing as a tool to target subpopulations of neurons. This technique will allow further dissection of the circuits of neuronal subtypes because it can be applied to any combination of cell types for which Cre/Flp mouse lines are available (He et al., 2016; Madisen et al., 2015).
STAR★METHODS
LEAD CONTACT AND MATERIALS AVAILABILITY
Requests and further information for resources and reagents should be directed to and will be fulfilled by the Lead Contact, Jochen F. Staiger (jochen.staiger@med.uni-goettingen.de).
Plasmids for intersectional tracing generated in this study have been deposited to Addgene [AAV-Ef1a-Con/Fon-oG-WPRE as plasmid #131778; AAV-nEF-Con/Fon-TVA-mCherry-WPRE as plasmid #131779]. The intersectional viruses will be available for order either from the Stanford virus core or Addgene.
EXPERIMENTAL MODEL AND SUBJECT DETAILS
Mice
We crossed Vgat-ires-Cre mice (Slc32a1tm2(cre)Lowl/J, The Jackson Laboratory, Bar Harbor, USA) with Pvalb-T2A-FlpO-D mice (B6.Cg-Pvalbtm4.1(flpo)Hze/J, The Jackson Laboratory) to generate Vgat-Cre/PV-Flp mice for intersectional RV tracing. For control experiments, we used Vgat-Cre, PV-Flp and C57BL/6J wild-type mice (The Jackson Laboratory). For Cre-dependent tracing experiments we used B6 PV-Cre mice (B6;129P2-Pvalbtm1(cre)Arbr/J, The Jackson Laboratory). For anterograde tracing of LIV cells, we used Scnn1a-Tg3-Cre (B6;C3-Tg(Scnn1a-cre)3Aibs/J, The Jackson Laboratory). For tracing experiments with non-cell-type-specific retrograde tracers we used VIP-ires-Cre (VIPtm1(cre)Zjh, The Jackson Laboratory) or SST-ires-Cre (Ssttm2.1(cre)Zjh/J, The Jackson Laboratory) mice but not utilizing the Cre-expression. All tracing experiments were performed with 12–20 weeks-old mice of either sex.
We crossed Vgat-Cre/PV-Flp mice with the Cre- and Flp-dependent Ai65 tdTomato reporter line (B6;129S-Gt(ROSA) 26Sortm65.1(CAG-tdTomato)Hze/J, The Jackson Laboratory), to visualize the intersectional population. To visualize LIV cells, Scnn1a-Tg3-Cre mice were crossed to the Ai9 tdTomato reporter line (B6.Cg-Gt(ROSA)26Sortm9(CAG-tdTomato)Hze/J, The Jackson Laboratory).
For glutamate uncaging, we used 3–6 weeks-old offspring of PV-Cre mice crossed to Ai9 tdTomato reporter mice.
All mice were kept in standard cages in a 12h light/dark cycle and with ad libitum access to food and water. We used mice of either sex. All experimental procedures were performed in accordance with German laws on animal research (TierSchG und TierSchVersV 2013).
Cell Lines
HEK293FT cells (Invitrogen) were grown in 24-well tissue culture plates at 37°C in incubators supplemented with 5% CO2, in DMEM supplemented with 10% FBS and 1% Penicillin-Streptomycin (GIBCO). Cells were passaged at 90% confluence using enzymatic digestion (TrypLE, GIBCO). HEK cells were not routinely screened for Mycoplasma.
Primary cultured hippocampal neurons were prepared from P0 Sprague-Dawley rat pups of either sex (Charles River). CA1 and CA3 were isolated, digested with 0.4mg/ml papain (Worthington), and plated onto glass coverslips precoated with 1:30 Matrigel (Becton Dickinson Labware). Cultures were maintained in a 5% CO2 humid incubator with Neurobasal-A medium (Invitrogen) containing 1.25% FBS (HyClone), 4% B-27 supplement (GIBCO), 2mM Glutamax (GIBCO) and 2mg/ml fluorodeoxyuridine (FUDR, Sigma), and grown on coverslips in a 24-well plate at a density of 65000 cells per well.
METHOD DETAILS
Molecular Cloning
Cre-AND-Flp-dependent versions of oG and TVA-mCherry were produced using previously described methods (Fenno et al., 2014, 2017). Briefly, likely splice sites were identified in the open reading frame (ORF) of oG (Kim et al., 2016) TVA (Wickersham et al., 2007) and mCherry in two steps: first, searching for the motif CAGG, which represents a consensus exon splice sequence. Second, inserting introns and appropriate recombinase sites into these motifs (molecular design using VectorNTI and SnapGene), and analyzing the designed molecules for proper splicing in silico using an online splice prediction algorithm (http://www.cbs.dtu.dk/services/NetGene2/) (Brunak et al., 1991) to ensure that the introduced exon/intron junctions were highly predicted to be splice sites. Standard cloning approaches were used to fuse intron, recombinase recognition sites, and ORF sequences together and produce Con/Fon variants. Con/Fon-oG is driven by the EF1-alpha promoter while Con/Fon-TVA-mCherry is driven by the shorter hybrid EF1-alpha/HTLV promoter nEF. Both were sub-cloned into a standard AAV backbone, including 3′ WPRE. oG exon expression plasmids were cloned in an AAV expression vector under the Ef1a promoter. All cloning was done in Stbl3 E. coli (ThermoFisher) and positive colonies were scaled up and purified using an endotoxin-reducing plasmid purification kit (QIAGEN endotoxin-free MaxiPrep). All constructs are freely available (https://web.stanford.edu/group/dlab/optogenetics/).
mRNA Isolation and cDNA Synthesis
HEK293FT cells at 90% confluence were transfected with endotoxin-free DNA using Lipofectamine 2000 (Invitrogen) following the manufacturer protocol. Five days post-transfection, RNA extraction was performed (QIAGEN RNeasy Mini). Cells were disrupted with lysis buffer and homogenized (QIAGEN QiaShredder). Combined first-strand cDNA/PCR (Invitrogen SuperScript III One-Step RT-PCR) was performed with the following reaction conditions and primers (all sequences 5′ -> 3′): oG: 50°C × 30 min, 94°C × 2 min followed by 40 cycles of 94°C × 20 s, 50°C × 30 s, 68°C × 1.5 min, ending with 68°C × 5 min. TVA-mCherry: 55°C × 30 min, 94°C × 2 min, followed by 40 cycles 94°C × 20 s, 55°C × 30 s, 68°C × 1.5 min, ending with 68°C × 5 min. oG primers: Exon 1 Forward (1F): gctatgaggaaagcctgcac; Exon 1 Reverse (1R): gtgcaggctttcctcatagc; Exon 2 Forward (2F): aagagcgtgagcttcag gag; Exon 2 Reverse (2R): ctcctgaagctcacgctctt. TVA-mCherry primers: TVA-mCherry Exon 1 Forward (1F): gtcagttccgctgctcggag; Exon 3 Reverse (3R): cttgtacagctcgtccatgc. The PCR product was gel purified and sequenced to determine splice junctions.
Flow Cytometry
HEK293FT cells at 90% confluence were transfected in replicate with maximum 800 ng total DNA with Lipofectamine 2000 (Invitrogen) following the manufacturer protocol. Five days post-transfection, cells were removed by enzymatic dissociation (TrypLE, GIBCO), resuspended in 1xPBS, and pelleted at 2000 g for 5 min. TVA-mCherry samples were resuspended in 500 μL 1xPBS supplemented with 1 μg/mL propidium iodide (PI; Sigma), and then placed on ice under aluminum foil until analysis. oG samples were resuspended in 100 μL 1xPBS with Zombie Violet fixable viability dye (BioLegend 423113, 1:100) for 30 min at RT, fixed with 4% PFA for 10 min at RT, then stained overnight at 4°C with anti-rabies glycoprotein (abcam, 1:500) conjugated to DyLight 488 (abcam DyLight 488 Conjugation Kit, 1:10), and placed on ice under aluminum foil until analysis. Flow cytometry was completed on a DxP FACSCAN analyzer at the Stanford Shared FACS Facility using settings optimized for side scatter (SS), forward scatter (FS), viability indicator (Zombie Violet or PI), and expression indicator (DyLight 488 or mCherry). Flow cytometer gain parameters were set using positive (non-recombinase-dependent expression construct for oG or TVA-mCherry), negative (empty transfection), and dead (heatkilled; 95°C for 2 min) samples. 30,000 individual data points were collected for each sample. Relative (AU) quantitative expression levels were determined in live cells by (i) positively gating for the high-density population observed when plotting FS versus SS and then (ii) negatively gating for cells with high PI or Zombie Violet expression.
Surgery and Viral Injection
All animals subjected to retrograde tracing experiments in barrel cortex underwent surgery for intrinsic signal optical imaging, with subsequent mapping of the C2 whisker-related column. All other animals underwent stereotaxic surgery based on Atlas coordinates (Paxinos and Franklin, 2001).
For sedation and analgesia, the mouse was injected intraperitoneally with 10 μg/g xylazine (Xylariem, Ecuphar) and 0.065 μg/g buprenorphine (Temgesic, Individor UK Limited) in sterile saline, respectively. Anesthesia was induced with 3% isoflurane (vol/vol) and maintained between 0.5 and 1% throughout the surgery (Harvard Apparatus, USA). The mouse was mounted on a custom-built frame with rigid earbars. A mixture of 2 μg/g bupivacaine/lidocaine (Astra Zeneca) was injected subcutaneously under the scalp for local anesthesia. Body temperature was maintained at 37°C with a heating pad (ATC 1000, World Precision Instruments, Florida). A small incision was made in the scalp to expose the right hemisphere of the skull. The bone over the somatosensory area was thinned to transparency with a dental drill (OS-40, Osada Electric Company, Japan). Then the location of the C2-related column was determined and mapped on the blood vessel pattern as described below. The bone above the target area was removed with a syringe tip. A glass injection pipette cut to 20 μm tip diameter (Drummond Scientific Co, USA) was backfilled with mineral oil (Sigma-Aldrich) and front filled with a 1:1 mixture of AAV8-nEF-Con/Fon-TVA-mCherry and AAV8-Ef1a-Con/Fon-oG (5*10^12 IU/ml). The pipette was fitted into a Nanoject III (Drummond Scientific Co, USA), which was attached to a micromanipulator (Luigs & Neumann, Germany). The pipette was inserted at the target location into the brain in an approximately 45° angle, following the curvature of the cortex. 200–300 nL of AAV mixture was injected portioned across three depths (750 μm, 500 μm, and 250 μm below pia). The needle was left in place at each depth for at least three minutes to reduce backflow. The scalp was sutured and the mouse received a subcutaneous injection of 5 μg/g Carprofen (Pfizer) for prolonged pain relief. 15–21 days later, the mouse was injected with RV-EGFP (1*10^7 IU/ml) without prior imaging. The injection was guided based on the blood vessel pattern and landmarks from the previous surgery.
For injection of non-cell-type-specific tracers, mice were injected either with100 nL of 0.5% cholera toxin subunit B, Alexa Fluor 488 conjugate (ThermoFisher Scientific), 100nl of AAV retrograde-hSyn-EGFP (Addgene) at a titer of 1.5*10^13 IU/ml or 150nl of SAD-ΔG-eGFP (SAD-G) at titer of 6.5*10^8 IU/ml.
For control injections in barrel cortex and for visual cortex injections, mice underwent stereotaxic surgery. The surgery was performed as for ISOI, with the following changes. The mouse was mounted on a stereotaxic frame (Kopf, Germany). The injection pipette was targeted at 3.3 mm lateral and –1.55 mm caudal from Bregma for barrel cortex and at 2.0 and 2.8 mm lateral and 3.5 caudal from Bregma for visual cortex. 300 nL of AAV2/1-CAG-FLEX-tdTomato was used for visual cortex injections at a titer of 1*10^13 IU/ml.
Intrinsic Signal Optical Imaging
The whiskers on the left side of the snout were clipped, sparing solely C2. This whisker was inserted into a glass capillary glued to a piezo actuator, which was connected to a computer-controlled amplifier (E-650 LVPZT, Physik Instrumente, Germany). The optical system consisted of a CCD camera (Adimec-1000 m, Adimec, Netherlands) attached to an objective (Nikon, Japan) composed of two lenses, a 50 mm bottom lens and a 135 mm top lens. This system yielded a magnification of 2.7-fold. The camera had a resolution of 1000×1000 pixels each sized 2.8×2.8 μm. The Imager 3001 data acquisition system (Optical Imaging, Israel) was connected to the optical system, the piezo amplifier and a computer, controlling the timing of stimulation and data acquisition. Localization of the C2 column was performed similar to Guy et al. (2015). The thinned skull was moistened with a 0.9% saline and covered with a glass coverslip (Thermo Scientific Menzel-Gläser, Germany). The camera was focused on the pial surface and the skull was evenly illuminated with green light at 546 nm wavelength from a 100 W halogen lamp (Kepco ATE 15–15 M, Kepco, Japan) to visualize the blood vessel pattern. For functional imaging, the plane of focus was moved 300 μm below the pial surface, the illumination was switched to red light at 630 nm wavelength by changing the filter, and the light intensity was adjusted to almost saturate the camera. Stimulation of the C2 whisker was achieved by bending a piezo element 5 times per second for 10 ms with an amplitude of approximately 1 mm. 40 ms long frames were acquired after stimulus onset for 3 s. 30 trials were averaged to improve signal to noise ratio. The blood vessel pattern and the intrinsic signal were overlaid to guide the subsequent injection. The peak of the signal was assumed to correspond to the center of the cortical C2 representation.
Fixation and Tissue Processing
Eight to ten days after RV injection, mice were sacrificed with an overdose of ketamine (100 μg/g; Medistar) and perfused transcardially with 10% sucrose solution followed by 4% paraformaldehyde (PFA) in 0.1M phosphate buffer saline (PB). The brain was post-fixed in 4% PFA for 4 h and drowned in 20% sucrose in 0.1M PBS overnight. Fixed brains were quick-frozen in –40°C-cold isopentan and stored at –80°C, until they were embedded in Tissue-Tek O.C.T. compound (Sakura Finetek) and sectioned on a cryostat (CM3050S, Leica). Whole brains were cut into 100 μm-thick coronal sections rostral and caudal to barrel cortex, while barrel cortex was cut into 40 μm-thick sections. All sections spanning the barrel cortex were subjected to immunohistochemistry or fluorescence in situ hybridization, while all other sections were stained for 4’,6-diamidino-2-phenylindole (DAPI) only.
Immunohistochemistry on Tissue Sections
Barrel cortex sections were washed in TRIS buffer (TB) for 15 min, TRIS-buffered saline (TBS) for 15 min and TBS + 0.5% Triton X-100 (TBST) for 2×15 min, all at pH 7.6. Blocking was done for 90 min at room temperature in 0.25% bovine serum albumin/10% goat serum/TBST (Jackson Immuno Research). Sections were incubated for 48–72 h at 4°C with primary antibodies (i) chicken anti-GFP (Aves) diluted 1:1000, (ii) mouse anti-RFP (Rockland) diluted 1:1000, and (iii) rabbit anti-PV (Swant) diluted 1:5000 in blocking solution. After washing 4×15 min with TBST, secondary antibodies (i) Alexa Fluor 488-conjugated goat anti-chicken IgG, (ii) Alexa Fluor 568-conjugated goat anti-mouse IgG2a, and (iii) Alexa Fluor 633-conjugated goat anti-rabbit (Molecular Probes) were diluted 1:500 in TBST and sections were incubated for 4h at room temperature. After washing 2×15 min with TBST and 1×15 min with TBS, sections were stained with DAPI, diluted 1:1000 in TBS. After several washes in TB, sections were mounted in Aqua-Poly-Mount (Polysciences).
For staining against oG, blocking solution was prepared with 3% bovine serum albumin/10% goat serum/TBST. Guinea pig anti-rabies glycoprotein antibody (kindly donated by A. Lüthi) was diluted 1:500 in blocking solution and combined with Alexa Fluor 633-conjugated goat anti-guinea pig IgG (Molecular Probes).
Fluorescence In Situ Hybridization
RNA probes were generated as described in (Prönneke et al., 2015), based on published primers: GAD67 (glutamic acid decarboxylase 1; Weissbourd et al., 2014), RorB (RAR-related orphan receptor beta; Wagener et al., 2010), Slc17a7(vGluT1, vesicular glutamate transporter 1), SST (somatostatin), and VIP (vasoactive, intestinal polypeptide) (Prönneke et al., 2015).
Sections spanning the injection site were selected and treated with 1% H2O2 in methanol for 20 min, rinsed in PBS, quenched in 0.2M HCl for 8 min, rinsed with PBS, incubated in Proteinase K (10 μg/mL, Roche) in TRIS–HCl/EDTA (5 mM/5mM, pH 8.0) for 8 min, rinsed with PBS and fixed again in 4% PFA for 20 min. Sections were directly transferred to 0.25% acetic anhydride (2.4/μL per mL 0.1M triethanolamine/HCl) for 10 min, rinsed twice in 2 × standard saline citrate (1 × SSC: 0.15M NaCl, 0.015M sodium citrate, pH 7.0) and pretreated in hybridization buffer (HB; 50%formamide, 4 × SSC, 250 μg/mL of denatured salmon sperm DNA, 100 μg/mL of tRNA, 5% dextransulfate, and 1% Denhardt’s solution) diluted 1:2 with 2 × SSC for 15 min followed by 1 h of prehybridization at 55°C in pure HB. DIG-labeled RNA probes (200 ng/mL) were heated to 95°C for 5 min and added to each well. After hybridization over night at 55°C, section were washed in 2 × SSC for 15 min at RT, 2 × SSC containing 50% formamide for 30 min at 65°C, and 2 × SSC for 5 min at 65°C, always twice, followed by RNase A treatment (Roche, 4 μg/mL) and washes in 2 × SSC for 5 min at RT, 2 × SSC containing 50% formamide for 30 min at 65°C, 0.1 × SSC containing 50% formamide for 15 min at 65°C, and finally 0.1 × SSC for 2 × 15 min at 65°C. The hybridized probe was detected using a using a Tyramide Signal Amplification Kit (TSA Biotin System NEL700001KT; PerkinElmer). First, sections were blocked in 0.5% blocking agent and 4% sheep serum in 0.01M TBS, pH7.5, followed by incubation with sheep anti-DIG-POD FAB fragments, conjugated to peroxidase (Roche) diluted 1:2000 in blocking agent overnight. After biotinylation in biotinyl tyramide working solution for 2 h, rinsing in TBS, Streptavidin Alexa Fluor 633 (Life technologies; diluted 1:400 in TBS, 15min) was used, to fluorescently label the mRNA of interest.
Subsequent immunoamplification of the GFP and mCherry signals was done with goat anti-GFP (Abcam) diluted 1:1000 and rabbit anti-RFP (Rockland) diluted 1:250, following the protocol for immunohistochemistry as outlined above. The only differences were the exclusion of Triton-X and the use of Alexa Fluor 488-conjugated donkey anti-goat IgG (Molecular Probes) and Alexa Fluor 594-conjugated donkey anti-rabbit (Molecular Probes) diluted 1:500 as secondary antibody.
Hippocampal Neuron Histology
Primary hippocampal neurons were prepared in 24-well plates as described above. Growth medium was removed and replaced with prewarmed minimal essential medium (MEM). 2μg total DNA of mixture of INTRSECT and recombinase-expression plasmids (YFP-IRES-FlpO, BFP-IRES-Cre, mCherry-IRES-Cre) was mixed with 1.875 μL 2M CaCl2 (final Ca2+ concentration 250 mM) in 15 μL H2O. To DNA-CaCl2 we added 15 μL of 2 × HEPES-buffered saline (pH 7.05). After 20 min at room temperature (20–22°C), the mix was added dropwise into each cell culture well and transfection proceeded for 45–60 min at 37°C, after which each well was washed with 3 × 1 mL warm MEM before the original growth medium was returned. After 5 d expression, coverslips were fixed for 5 min at RT in 4% PFA. TVA-mCherry samples were rinsed twice in 1x PBS, then mounted on slides with Fluoromount-G (ThermoFisher). oG samples were fixed with 4% PFA, stained with anti-rabies glycoprotein primary antibody (abcam, 1:500) overnight at 4°C, and stained with Cy5 anti-mouse secondary antibody (Jackson ImmunoResearch, 1:500) for 3 hours prior to being mounted. Images were obtained on a Leica confocal microscope using 40 × and 63 × objectives.
Slice Electrophysiology and Glutamate Uncaging
For glutamate uncaging experiments, animals were deeply anesthetized with isoflurane and sacrificed by decapitation. Thalamocortical slices of 300 mm thickness containing the barrel cortex were prepared with a vibratome (VT1200S; Leica, Germany). The cooled (4°C) and oxygenated (95% O2 and 5% CO2) cutting solution containing the following (in mM) was used: 75 sucrose, 87 NaCl, 2.5 KCl, 0.5 CaCl2, 7.0 MgCl2, 26 NaHCO3, 1.25 NaH2PO4, and 10 glucose, pH 7.4. Slices were incubated in oxygenated artificial cerebrospinal fluid (ACSF) (in mM):125 NaCl, 2.5 KCl, 2 CaCl2,1 MgCl2, 26 NaHCO3, 1.25 NaH2PO4 and 25 glucose, pH 7.4) for 0.5–1h at 32°C and kept at room temperature until further processing. Slices were transferred to a fixed-stage recording chamber in an upright microscope (Axio Examiner, Zeiss, Germany) and continuously perfused at a rate of 2 ml/min at 32°C with ACSF. Whole-cell patchclamp recordings from PV interneurons in LII/III, identified by tdTomato fluorescence, of the barrel cortex were performed in current clamp as well as voltage clamp. Filamented borosilicate glass capillaries (Science Products, Germany) of 5–8 MΩ resistance were filled with a cesium-based internal solution (in mM): 135 CsMeSO4, 5 CsCl, 0.5 EGTA, 10 HEPES, 4 Mg-ATP, 0.3 Na-GTP, 10 Na-phosphocreatine phosphate; pH: 7.4 and 0.3%–0.5% biocytin. For photostimulation, a 405 nm diode laser (DL-405, Rapp OptoElectronic, Wedel, Germany) was coupled via a 200 μm liquid fiber to the epifluorescence path of the microscope and guided into the 40x water immersion objective (Olympus, Germany). The laser beam was focused on a 50×50 μm2 area on the plane of the brain slice. Caged glutamate (CNB-caged-L-glutamate, Molecular Probes, Carlsbad, USA) was added to the ACSF perfusion with a final concentration of 330 μM. To reduce detection errors of IPSCs, laser stimulus (6 ms duration) was repeated three times per field at an interval of 10 s. In principle, glutamate release could activate all types of neurons, which could lead to disynaptically evoked inhibitory inputs. In a previous study (Walker et al., 2016), we set up a series of calibration experiments to determine an energy level at which the laser, with its beam centered on the soma, generated spikes in the recorded cell. Here, we performed additional current clamp recordings of LI neurons in each slice, with potassium-based internal solution (in mmol: 135 K-gluconate, 5 KCl, 0.5 EGTA, 10 HEPES, 4 Mg-ATP, 0.3 Na-GTP, 10 Na-phosphocreatine phosphate; pH: 7.4) and induced spiking by glutamate uncaging. A laser energy level of ~120 μJ triggered spikes in all recorded L1 neurons, which is the same level as for other interneurons in the barrel cortex (Walker et al., 2016). In subsequent mapping experiments, the PV cells were held at +10 mV and IPSCs were only accepted as stimulus-evoked if their amplitude exceeded the mean baseline ± 3SD, they were detected in at least two out of three stimulus repetitions and they appeared within a 10–20 ms time window after stimulus offset. The laser was moved from pia to LIV over an area covering three adjacent barrel-related columns (the middle one containing the recorded PV cell). Scanning was carried out systematically along rows with alternating directions (50 μm per step) controlled by the Morgentau M1 software (Morgentau Solutions GmbH, Germany). Thus up to 162 different fields were stimulated without any intermittent gaps. Layer and column borders were estimated from the brightfield overview picture (2.5x) and aligned with the scanned cortical area. Inhibitory maps were created, representing the average IPSC amplitude in fields containing sources of presynaptic inhibitory cells for the recorded LII/III PV cell. These maps were then converted into binary ones and aligned in relation to the layer borders and horizontal position of the recorded cell. From the overlay of all individual binary maps we calculated an average map depicting the confidence level (‘‘1’’ responses in all individual maps, ‘‘0’’ no responses in all individual maps) for the position of inhibitory fields only in LI, for better visualization. Data were acquired using a SEC-05L amplifier (NPI Electronics, Germany) in discontinuous mode with a switching frequency of 50–60 kHz. The signals were filtered at 3 kHz and digitized at 10–25 kHz using a CED Power1401 (CED Limited, England). Data were collected, stored, and analyzed with Signal 5 software (CED Limited).
Image Acquisition and Processing
Overviews of tissue sections were acquired at an upright epifluorescence microscope (AxioImager.M2, Zeiss, Germany) with a 10x objective (NA = 0.3). The system was controlled by Neurolucida software (MBF Bioscience, USA). Tiles were stitched automatically during imaging. Tiles outside the brain section that were not illuminated during imaging were included as black tiles into the pictures to maintain their rectangular shape. Section order was maintained along the rostro-caudal axis. Injection sites were imaged on an inverted confocal microscope (TCS Sp5, Leica, Germany) at 20x magnification (NA = 0.75). High resolution images to probe putative synaptic contacts between fibers and cell somata were acquired on an inverted microscope (LSM 880, Zeiss, Germany) at 63x magnification (NA = 1.4) in Airy Scan mode. Images were processed using Fiji software (Schindelin et al., 2012), to enhance contrast and brightness.
QUANTIFICATION AND STATISTICAL ANALYSIS
Brain regions were identified using the Paxinos mouse atlas (Paxinos and Franklin, 2001) and based on cytoarchitectonic landmarks visible in nuclear staining and by autofluorescence. Retrogradely labeled cells on all sections spanning from Bregma +3 to –4.5 mm were counted manually in Neurolucida (MBF Bioscience). Layers were identified based on (i) the different cell densities and (ii) their relative thickness as measured in published data (Lefort et al., 2009; Prönneke et al., 2015). Cell counts were exported with Neurolucida Explorer to Excel. Statistical analysis was carried out in Sigma Plot (Systat Software Inc, Germany) or R (www.R-project.org). Data were tested for normality (Shapiro–Wilk test) and equal variance (Brown-Forsythe test). Dependent on the distribution, we used parametric (ANOVA) or non-parametric tests (Kruskal-Wallis test) as indicated. All values are given as mean ± SD. Graphs were produced using Origin software (Origin Lab, USA). Adobe Illustrator and Indesign were used for arrangement of pictures.
Supplementary Material
KEY RESOURCES TABLE
| REAGENT or RESOURCE | SOURCE | IDENTIFIER |
|---|---|---|
| Antibodies | ||
| chicken anti-GFP | Aves | Cat#GFP-1020, RRID:AB_10000240 |
| goat anti-GFP | Abcam | Cat#ab5450, RRID:AB_304897 |
| mouse anti-RFP | Rockland | Cat#200–301-379S, RRID:AB_2611064 |
| rabbit anti-PV | Swant | Cat#PV25, RRID:AB_10000344 |
| rabbit anti-RFP | Rockland | Cat#600–401-379, RRID:AB_2209751 |
| Mouse anti-Rabies glycoprotein | Abcam | Cat#ab82460, RRID:AB_1658373 |
| Mouse anti-Rabies glycoprotein | Millipore | Cat#MAB8727, RRID:AB_571110 |
| Guinea pig anti-Rabies glycoprotein | Andreas Lüthi (Friedrich Miescher Institute), (Xu et al., 2016) | N/A |
| Donkey anti-goat IgG, Alexa Fluor 488 | Molecular Probes | Cat#A11055 |
| Donkey anti-rabbit, Alexa Fluor 594 | Molecular Probes | Cat#A21207 |
| Goat anti-chicken IgY, Alexa Fluor 488 | Molecular Probes | Cat#A11039 |
| Goat anti-mouse IgG2a, Alexa Fluor 568 | Molecular Probes | Cat#A21134 |
| Goat anti-rabbit IgG, Alex Fluor 633 | Molecular Probes | Cat#A21070 |
| Streptavidin Alexa Fluor 633 | Life technologies | Cat#S21375 |
| Anti-DIG-POD, FAB fragments | Roche | Cat#11207733910 |
| DyLight 488 antibody conjugation kit | Abcam | Cat#ab201799 |
| Zombie Violet fixable viability dye | BioLegend | Cat#423113 |
| Anti-mouse Cy5 secondary antibody | Jackson ImmunoResearch | Cat#715–175-151 |
| Bacterial and Virus Strains | ||
| AAV2/1-CAG-FLEX-tdTomato | PEN Vector Core | Cat#AV-1-ALL864 |
| AAV8-nEF-Con/Fon-TVA-mCherry | This paper | N/A |
| AAV8-EF1a-Con/Fon-oG | This paper | N/A |
| AAV-retro-hSyn-EGFP | Addgene, depositor Bryan Roth | Addgene Plasmid #50465 |
| RV-SADΔG-GFP-SC (EnvA) | Karl-Klaus Conzelmann (LMU Munich) | N/A |
| RV-SADΔG-EGFP (SAD-G) | Karl-Klaus Conzelmann (LMU Munich) | N/A |
| Cholera toxin subunit B, Alexa Fluor 488 conjugate | ThermoFisher | Cat#C22841 |
| Stabl3 E. coli | ThermoFisher | Cat#C737303 |
| Chemicals, Peptides, and Recombinant Proteins | ||
| Acetic anhydrid | Sigma-Aldrich | Cat#320102 |
| Adenosine triphosphate magnesium salt | Sigma | Cat#A9187 |
| Aqua Poly/Mount | Polysciences | Cat #18606 |
| Biocytin | Sigma | Cat#B4261 |
| Bupivacaine | Astra Zeneca | N/A |
| Caged-glutamate | Invitrogen | Cat#G7055 |
| Calcium chloride dihydrate | Sigma-Aldrich | Cat#223506 |
| Carprofen | Pfizer | N/A |
| Cesium chloride | Sigma | Cat#C3032 |
| Cesium methansulfonate | Sigma | Cat#C1426 |
| Denaturated salmon sperm DNA | Roche | Cat#11467140001 |
| Denhardt’s solution | Sigma-Aldrich | Cat#D2532 |
| Dextransulfate | Sigma | Cat#D8906 |
| Di-sodium hydrogen phosphate anhydrous | PanReac AppliChem | Cat#MO4077532001000 |
| EGTA | Sigma-Aldrich | Cat#E4378 |
| Formamide | Roth | Cat#6749.2 |
| Glucose | Merck | Cat#104074 |
| Goat serum | Jackson Immuno Research | Cat#005–000-121 |
| Guanosine triphosphate sodium salt | Sigma | Cat#G8877 |
| HEPES | Sigma | Cat#H3375 |
| Hydrocholoric acid | Roth | Cat#4625.1 |
| Hydrogen peroxidase 30% | Merck | Cat#1072090250 |
| Ketamin | Medistar | N/A |
| Lidocaine | Astra Zeneca | N/A |
| Lipofectamine 2000 | ThermoFisher | Cat#11668027 |
| Magnesium chloride hexahydrate | Sigma | Cat#M2670 |
| Methanol | Roth | Cat#4627.5 |
| 2-Methylbutane | Roth | Cat#3926.1 |
| Paraformaldehyde | PanReac AppliChem | Cat#A3813 |
| Phosphocreatin disodium salt hydrate | Sigma | Cat#P7936 |
| Potassium chloride | Merck | Cat#104936 |
| Proteinase K | Roche | Cat#03115879001 |
| RNaseA | Roche | Cat#R4875 |
| Sheep serum | Jackson Immuno Research | Cat#013–000-121 |
| Sodium chloride | Sigma-Aldrich | Cat#S9888 |
| Sodium dihydrogen phosphate monohydrate | Merck | Cat#106346 |
| Sodium hydrogen carbonate | Merck | Cat#106329 |
| Sucrose | Sigma | Cat#S9378 |
| Temgesic | Individor UK | N/A |
| Tissue Tek O.C.T | Sakura Finetek | Cat#4583 |
| Tri-Sodium citrate dihydrate | Roth | Cat#3580.1 |
| Triton X-100 | Roth | Cat#3051.2 |
| Trizma hypochloride | Sigma | Cat#T3253 |
| Trizma base | Sigma | Cat#T1503 |
| tRNA | Roche | Cat#10109541001 |
| TrypLE | GIBCO | Cat#12604–013 |
| Xylariem | Ecuphar | N/A |
| Critical Commercial Assays | ||
| TSA Biotin System | PerkinElmer | Cat#NEL700001KT |
| Experimental Models: Cell Lines | ||
| HEK293FT | Invitrogen | Cat#R70007 |
| Rat primary hippocampal neurons | Derived in-house from P0 Sprague-Dawley rats | N/A |
| Experimental Models: Organisms/Strains | ||
| Mouse: Ai9 tdTomato reporter | The Jackson Laboratory, Bar Harbor, USA | B6.Cg-GT(ROSA)26Sor-tm9(CAG-tdTomato)Hze/J IMSR Cat# JAX:007909, RRID:IMSR_JAX:007909 |
| Mouse: Ai65 tdTomato reporter | The Jackson Laboratory, Bar Harbor, USA | B6;129S-Gt(ROSA)26Sortm65.1(CAG-tdTomato)Hze/J IMSR Cat# JAX:021875, RRID:IMSR_JAX:021875 |
| Mouse: C57BL/6J | The Jackson Laboratory, Bar Harbor, USA | C57BL/6J IMSR Cat# JAX:000664, RRID:IMSR_JAX:000664 |
| Mouse: B6 PV-Cre | The Jackson Laboratory, Bar Harbor, USA | B6;129P2-Pvalbtm1(cre)Arbr/J IMSR Cat# JAX:017320, RRID:IMSR_JAX:017320 |
| Mouse: SST-ires-Cre | The Jackson Laboratory, Bar Harbor, USA | SSTtm2.1(cre)Zjh/J IMSR Cat# JAX:013044, RRID:IMSR_JAX:013044 |
| Mouse: VIP-ires-Cre | The Jackson Laboratory, Bar Harbor, USA | VIPtm1(cre)Zjh/J IMSR Cat# JAX:010908, RRID:IMSR_JAX:010908 |
| Mouse: Pvalb-T2A-FlpO-D | The Jackson Laboratory, Bar Harbor, USA | B6.Cg-Pvalbtm4.1(flpo)Hze/J IMSR Cat# JAX:022730, RRID:IMSR_JAX:022730 |
| Mouse: Scnn1a-Tg3-Cre mouse | The Jackson Laboratory, Bar Harbor, USA | B6;C3-Tg(Scnn1a-cre)3Aibs/J IMSR Cat# JAX:009613, RRID:IMSR_JAX:009613 |
| Mouse: Vgat-ires-Cre | The Jackson Laboratory, Bar Harbor, USA | Slc32a1tm2(cre)Lowl/J IMSR Cat# JAX:016962, RRID:IMSR_JAX:016962 |
| Oligonucleotides | ||
| GAD1 riboprobe (for primers see Table S2) | (Weissbourd et al., 2014) | N/A |
| RorB riboprobe (for primers see Table S2) | (Wagener et al., 2010) | N/A |
| SST riboprobe (for primers see Table S2) | (Prönneke et al., 2015) | Allen BrainAtlas Riboprobe RP_081204_01_A03 |
| vGluT1 riboprobe (for primers see Table S2) | (Prönneke et al., 2015) | N/A |
| VIP riboprobe (for primers see Table S2) | (Prönneke et al., 2015) | N/A |
| RT and PCR primers for Con/Fon-oG, see Table S2 | This Publication | N/A |
| RT and PCR primers for Con/Fon-TVA-mCherry, see Table S2 | This Publication | N/A |
| Recombinant DNA | ||
| AAV-Ef1a-Con/Fon-oG-WPRE | This Publication | Addgene Plasmid #131778 |
| AAV-Ef1a-oG-WPRE | This Publication, originally (Kim et al., 2016) | N/A |
| AAV-EF1a-oG [exon 1]-WPRE | This Publication | N/A |
| AAV-EF1a-oG [exon 2]-WPRE | This Publication | N/A |
| AAV-nEF-Con/Fon-TVA-mCherry-WPRE | This Publication | Addgene Plasmid #131779 |
| AAV-nEF-TVA-mCherry-WPRE | This Publication, originally (Wickersham et al., 2007) | N/A |
| AAV-EF1a-YFP-IRES-FlpO-WPRE | (Fenno et al., 2014) | N/A |
| AAV-EF1a-BFP-IRES-Cre-WPRE | This Publication | N/A |
| AAV-EF1a-mCherry-IRES-Cre-WPRE | This Publication | N/A |
| AAV-EF1a-FlpO-WPRE | (Fenno et al., 2014) | N/A |
| AAV-EF1a-Cre-WPRE | (Fenno et al., 2014) | N/A |
| pAAV-hSyn-EGFP | Addgene, depositor Bryan Roth | Addgene Plasmid #50465 |
| Software and Algorithms | ||
| Fiji | (Schindelin et al., 2012) | https://imagej.net/Fiji |
| MATLAB+Image Processing Toolbox | MathWorks, USA | https://de.mathworks.com/products/image.html |
| Morgentau M1 | Morgentau Solutions GmbH, Germany | N/A |
| NetGene2 | (Brunak et al., 1991) | http://www.cbs.dtu.dk/services/NetGene2/ |
| Neurolucida | MBF Bioscience, USA | https://www.mbfbioscience.com/ |
| Origin | Origin Lab, USA | N/A |
| Sigma Plot | Systat Software Inc., Germany | N/A |
| Signal 5 | CED Limited, England | N/A |
| SnapGene | GSL Biotech | N/A |
| VectorNTI | ThermoFisher | N/A |
| Other | ||
| DxP FACSCAN | Cytek Development | N/A |
| Nanoject III | Drummond Scientific Co, USA | Cat#3–000-207 |
| Paxinos Mouse Atlas | (Paxinos and Franklin, 2001) | N/A |
Highlights.
Intersectional strategy to target neurons defined by two molecular markers
Inputs to PV cells are mostly local and include inhibitory connections from layer I
PV cells receive long-range input from other sensory areas and the thalamus
Layer IV in visual cortex stands out as an important projection layer
ACKNOWLEDGMENTS
This work was supported by the Deutsche Forschungsgemeinschaft via CRC 889 (Cellular Mechanisms of Sensory Processing; TP C07 to J.F.S.) and CRC 870 (to K.K.C. and M.O.), NIH grants EY022577 and MH063912 (to E.M.C.), and a Bridging Fund of the Göttingen Graduate Center for Neurosciences, Biophysics, and Molecular Biosciences (to G.H.).
We thank Patricia Sprysch, Pavel Truschow, and Sandra Heinzl for excellent technical assistance; Sabine Krabbe and Andreas Lüthi for kindly donating the rabies glycoprotein antibody; Euiseok Kim for advice on viral tracing; Martin Möck for writing scripts to analyze electrophysiological data; and Alvar Proenneke for his help in preparing the figures.
Footnotes
SUPPLEMENTAL INFORMATION
Supplemental Information can be found online at https://doi.org/10.1016/j.celrep.2019.08.064.
DECLARATION OF INTERESTS
The authors declare no competing interests.
DATA AND CODE AVAILABILITY
All data and custom written code for analysis are available upon request.
REFERENCES
- Abs E, Poorthuis RB, Apelblat D, Muhammad K, Pardi MB, Enke L, Kushinsky D, Pu D-L, Eizinger MF, Conzelmann K-K, et al. (2018). Learning-related plasticity in dendrite-targeting layer 1 interneurons. Neuron 100, 684–699.e6. [DOI] [PMC free article] [PubMed] [Google Scholar]
- Ährlund-Richter S, Xuan Y, van Lunteren JA, Kim H, Ortiz C, Pollak Dorocic I, Meletis K, and Carleén M. (2019). A whole-brain atlas of monosynaptic input targeting four different cell types in the medial prefrontal cortex of the mouse. Nat. Neurosci 22, 657–668. [DOI] [PubMed] [Google Scholar]
- Almási Z, Dávid C, Witte M, and Staiger JF. (2019). Distribution patterns of three molecularly defined classes of GABAergic neurons across columnar compartments in mouse barrel cortex. Front. Neuroanat. 13, 45. [DOI] [PMC free article] [PubMed] [Google Scholar]
- Atallah BV, Bruns W, Carandini M, and Scanziani M. (2012). Parvalbumin-expressing interneurons linearly transform cortical responses to visual stimuli. Neuron 73, 159–170. [DOI] [PMC free article] [PubMed] [Google Scholar]
- Beierlein M, Gibson JR, and Connors BW. (2003). Two dynamically distinct inhibitory networks in layer 4 of the neocortex. J. Neurophysiol 90, 2987–3000. [DOI] [PubMed] [Google Scholar]
- Bortone DS, Olsen SR, and Scanziani M. (2014). Translaminar inhibitory cells recruited by layer 6 corticothalamic neurons suppress visual cortex. Neuron 82, 474–485. [DOI] [PMC free article] [PubMed] [Google Scholar]
- Brunak S, Engelbrecht J, and Knudsen S. (1991). Prediction of human mRNA donor and acceptor sites from the DNA sequence. J. Mol. Biol 220, 49–65. [DOI] [PubMed] [Google Scholar]
- Callaway EM. (2016). Inhibitory cell types, circuits and receptive fields in mouse visual cortex In Micro-, Meso- and Macro-Connectomics of the Brain, Kennedy H, Van Essen DC, and Christen Y, eds. (Springer; ), pp. 11–18. [PubMed] [Google Scholar]
- Callaway EM, and Luo L. (2015). Monosynaptic circuit tracing with glycoprotein-deleted rabies viruses. J. Neurosci. 35, 8979–8985. [DOI] [PMC free article] [PubMed] [Google Scholar]
- Cardin JA, Carleén M, Meletis K, Knoblich U, Zhang F, Deisseroth K, Tsai L-H, and Moore CI. (2009). Driving fast-spiking cells induces gamma rhythm and controls sensory responses. Nature 459, 663–667. [DOI] [PMC free article] [PubMed] [Google Scholar]
- Cruikshank SJ, Urabe H, Nurmikko AV, and Connors BW. (2010). Pathway-specific feedforward circuits between thalamus and neocortex revealed by selective optical stimulation of axons. Neuron 65, 230–245. [DOI] [PMC free article] [PubMed] [Google Scholar]
- Cruikshank SJ, Ahmed OJ, Stevens TR, Patrick SL, Gonzalez AN, Elmaleh M, and Connors BW. (2012). Thalamic control of layer 1 circuits in prefrontal cortex. J. Neurosci. 32, 17813–17823. [DOI] [PMC free article] [PubMed] [Google Scholar]
- D’Souza RD, Meier AM, Bista P, Wang Q, and Burkhalter A. (2016). Recruitment of inhibition and excitation across mouse visual cortex depend s on the hierarchy of interconnecting areas. eLife 5, e19332. [DOI] [PMC free article] [PubMed] [Google Scholar]
- De Marco García NV, Priya R, Tuncdemir SN, Fishell G, and Karayannis T. (2015). Sensory inputs control the integration of neurogliaform interneurons into cortical circuits. Nat. Neurosci 18, 393–401. [DOI] [PMC free article] [PubMed] [Google Scholar]
- DeNardo LA, Berns DS, DeLoach K, and Luo L. (2015). Connectivity of mouse somatosensory and prefrontal cortex examined with trans-synaptic tracing. Nat. Neurosci 18, 1687–1697. [DOI] [PMC free article] [PubMed] [Google Scholar]
- Deshpande A, Bergami M, Ghanem A, Conzelmann KK, Lepier A, Götz M, and Berninger B. (2013). Retrograde monosynaptic tracing reveals the temporal evolution of inputs onto new neurons in the adult dentate gyrus and olfactory bulb. Proc. Natl. Acad. Sci. U S A 110, E1152–E1161. [DOI] [PMC free article] [PubMed] [Google Scholar]
- Dimidschstein J, Chen Q, Tremblay R, Rogers SL, Saldi G-A, Guo L, Xu Q, Liu R, Lu C, Chu J, et al. (2016). A viral strategy for targeting and manipulating interneurons across vertebrate species. Nat. Neurosci 19, 1743–1749. [DOI] [PMC free article] [PubMed] [Google Scholar]
- Do JP, Xu M, Lee S-H, Chang W-C, Zhang S, Chung S, Yung TJ, Fan JL, Miyamichi K, Luo L, et al. (2016). Cell type-specific long-range connections of basal forebrain circuit. eLife 5, 1–17. [DOI] [PMC free article] [PubMed] [Google Scholar]
- Donato F, Rompani SB, and Caroni P. (2013). Parvalbumin-expressing basket-cell network plasticity induced by experience regulates adult learning. Nature 504, 272–276. [DOI] [PubMed] [Google Scholar]
- El-Boustani S, and Sur M. (2014). Response-dependent dynamics of cell-specific inhibition in cortical networks in vivo. Nat. Commun. 5, 5689. [DOI] [PMC free article] [PubMed] [Google Scholar]
- Faget L, Osakada F, Duan J, Ressler R, Johnson AB, Proudfoot JA, Yoo JH, Callaway EM, and Hnasko TS. (2016). Afferent inputs to neurotransmitter-defined cell types in the ventral tegmental area. Cell Rep. 15, 2796–2808. [DOI] [PMC free article] [PubMed] [Google Scholar]
- Feldmeyer D, Qi G, Emmenegger V, and Staiger JF. (2018). Inhibitory interneurons and their circuit motifs in the many layers of the barrel cortex. Neuroscience 368, 132–151. [DOI] [PubMed] [Google Scholar]
- Felleman DJ, and Van Essen DC. (1991). Distributed hierarchical processing in the primate cerebral cortex. Cereb. Cortex 1, 1–47. [DOI] [PubMed] [Google Scholar]
- Fenno LE, Mattis J, Ramakrishnan C, Hyun M, Lee SY, He M, Tucciarone J, Selimbeyoglu A, Berndt A, Grosenick L, et al. (2014). Targeting cells with single vectors using multiple-feature Boolean logic. Nat. Methods 11, 763–772. [DOI] [PMC free article] [PubMed] [Google Scholar]
- Fenno LE, Mattis J, Ramakrishnan C, and Deisseroth K. (2017). A guide to creating and testing new INTRSECT constructs. Curr. Protoc. Neurosci 80, 4.39.1–4.39.24. [DOI] [PMC free article] [PubMed] [Google Scholar]
- Freund TF, and Katona I. (2007). Perisomatic inhibition. Neuron 56, 33–42. [DOI] [PubMed] [Google Scholar]
- Ghanem A, and Conzelmann KK. (2016). G gene-deficient single-round rabies viruses for neuronal circuit analysis. Virus Res. 216, 41–54. [DOI] [PubMed] [Google Scholar]
- Gilman JP, Medalla M, and Luebke JI. (2017). Area-specific features of pyramidal neurons—a comparative study in mouse and rhesus monkey. Cereb. Cortex 27, 2078–2094. [DOI] [PMC free article] [PubMed] [Google Scholar]
- Gouwens NW, Sorensen SA, Berg J, Lee C, Jarsky T, Ting J, Sunkin SM, Feng D, Anastassiou CA, Barkan E, et al. (2019). Classification of electrophysiological and morphological neuron types in the mouse visual cortex. Nat. Neurosci 22, 1182–1195. [DOI] [PMC free article] [PubMed] [Google Scholar]
- Grinvald A, Lieke E, Frostig RD, Gilbert CD, and Wiesel TN. (1986). Functional architecture of cortex revealed by optical imaging of intrinsic signals. Nature 324, 361–364. [DOI] [PubMed] [Google Scholar]
- Gulyás AI, Megías M, Emri Z, and Freund TF. (1999). Total number and ratio of excitatory and inhibitory synapses converging onto single interneurons of different types in the CA1 area of the rat hippocampus. J. Neurosci 19, 10082–10097. [DOI] [PMC free article] [PubMed] [Google Scholar]
- Guo Q, Wang D, He X, Feng Q, Lin R, Xu F, Fu L, and Luo M. (2015). Whole-brain mapping of inputs to projection neurons and cholinergic interneurons in the dorsal striatum. PLoS ONE 10, e0123381. [DOI] [PMC free article] [PubMed] [Google Scholar]
- Guy J, Wagener RJ, Möck M, and Staiger JF. (2015). Persistence of functional sensory maps in the absence of cortical layers in the somsatosensory cortex of Reeler mice. Cereb. Cortex 25, 2517–2528. [DOI] [PMC free article] [PubMed] [Google Scholar]
- Harris JA, Hirokawa KE, Sorensen SA, Gu H, Mills M, Ng LL, Bohn P, Mortrud M, Ouellette B, Kidney J, et al. (2014). Anatomical characterization of Cre driver mice for neural circuit mapping and manipulation. Front. Neural Circuits 8, 76. [DOI] [PMC free article] [PubMed] [Google Scholar]
- He M, Tucciarone J, Lee S, Nigro MJ, Kim Y, Levine JM, Kelly SM, Krugikov I, Wu P, Chen Y, et al. (2016). Strategies and tools for combinatorial targeting of GABAergic neurons in mouse cerebral cortex. Neuron 91, 1228–1243. [DOI] [PMC free article] [PubMed] [Google Scholar]
- Helmstaedter M, Briggman KL, Turaga SC, Jain V, Seung HS, and Denk W. (2013). Connectomic reconstruction of the inner plexiform layer in the mouse retina. Nature 500, 168–174. [DOI] [PubMed] [Google Scholar]
- Hippenmeyer S, Vrieseling E, Sigrist M, Portmann T, Laengle C, Ladle DR, and Arber S. (2005). A developmental switch in the response of DRG neurons to ETS transcription factor signaling. PLoS Biol. 3, e159. [DOI] [PMC free article] [PubMed] [Google Scholar]
- Hu H, Gan J, and Jonas P. (2014). Interneurons. Fast-spiking, parvalbumin+ GABAergic interneurons: from cellular design to microcircuit function. Science 345, 1255263. [DOI] [PubMed] [Google Scholar]
- Isaacson JS, and Scanziani M. (2011). How inhibition shapes cortical activity. Neuron 72, 231–243. [DOI] [PMC free article] [PubMed] [Google Scholar]
- Ji X. y., Zingg B, Mesik L, Xiao Z, Zhang LI, and Tao HW. (2016). Thalamocortical innervation pattern in mouse auditory and visual cortex: laminar and cell-type specificity. Cereb. Cortex 26, 2612–2625. [DOI] [PMC free article] [PubMed] [Google Scholar]
- Jiang X, Shen S, Cadwell CR, Berens P, Sinz F, Ecker AS, Patel S, and Tolias AS. (2015). Principles of connectivity among morphologically defined cell types in adult neocortex. Science 350, aac9462. [DOI] [PMC free article] [PubMed] [Google Scholar]
- Karnani MM, Jackson J, Ayzenshtat I, Tucciarone J, Manoocheri K, Snider WG, and Yuste R. (2016). Cooperative subnetworks of molecularly similar interneurons in mouse neocortex. Neuron 90, 86–100. [DOI] [PMC free article] [PubMed] [Google Scholar]
- Kim EJ, Jacobs MW, Ito-Cole T, and Callaway EM. (2016). Improved monosynaptic neural circuit tracing using engineered rabies virus glycoproteins. Cell Rep. 15, 692–699. [DOI] [PMC free article] [PubMed] [Google Scholar]
- Koelbl C, Helmstaedter M, Lübke J, and Feldmeyer D. (2015). A barrel-related interneuron in layer 4 of rat somatosensory cortex with a high intrabarrel connectivity. Cereb. Cortex 25, 713–725. [DOI] [PMC free article] [PubMed] [Google Scholar]
- Kuhlman SJ, Olivas ND, Tring E, Ikrar T, Xu X, and Trachtenberg JT. (2013). A disinhibitory microcircuit initiates critical-period plasticity in the visual cortex. Nature 501, 543–546. [DOI] [PMC free article] [PubMed] [Google Scholar]
- Lee S, Hjerling-Leffler J, Zagha E, Fishell G, and Rudy B. (2010). The largest group of superficial neocortical GABAergic interneurons expresses ionotropic serotonin receptors. J. Neurosci 30, 16796–16808. [DOI] [PMC free article] [PubMed] [Google Scholar]
- Lee S-H, Kwan AC, Zhang S, Phoumthipphavong V, Flannery JG, Masmanidis SC, Taniguchi H, Huang ZJ, Zhang F, Boyden ES, et al. (2012). Activation of specific interneurons improves V1 feature selectivity and visual perception. Nature 488, 379–383. [DOI] [PMC free article] [PubMed] [Google Scholar]
- Lee AJ, Wang G, Jiang X, Johnson SM, Hoang ET, Lanté F, Stornetta RL, Beenhakker MP, Shen Y, and Julius Zhu J. (2015). Canonical organization of layer 1 neuron-led cortical inhibitory and disinhibitory interneuronal circuits. Cereb. Cortex 25, 2114–2126. [DOI] [PMC free article] [PubMed] [Google Scholar]
- Lefort S, Tomm C, Floyd Sarria JC, and Petersen CCH. (2009). The excitatory neuronal network of the C2 barrel column in mouse primary somatosensory cortex. Neuron 61, 301–316. [DOI] [PubMed] [Google Scholar]
- Letzkus JJ, Wolff SBE, Meyer EMM, Tovote P, Courtin J, Herry C, and Lüthi A. (2011). A disinhibitory microcircuit for associative fear learning in the auditory cortex. Nature 480, 331–335. [DOI] [PubMed] [Google Scholar]
- Liu YJ, Ehrengruber MU, Negwer M, Shao HJ, Cetin AH, and Lyon DC. (2013). Tracing inputs to inhibitory or excitatory neurons of mouse and cat visual cortex with a targeted rabies virus. Curr. Biol 23, 1746–1755. [DOI] [PMC free article] [PubMed] [Google Scholar]
- Luo L, Callaway EM, and Svoboda K. (2008). Genetic dissection of neural circuits. Neuron 57, 634–660. [DOI] [PMC free article] [PubMed] [Google Scholar]
- Luo L, Callaway EM, and Svoboda K. (2018). Genetic dissection of neural circuits: a decade of progress. Neuron 98, 256–281. [DOI] [PMC free article] [PubMed] [Google Scholar]
- Madisen L, Garner AR, Shimaoka D, Chuong AS, Klapoetke NC, Li L, van der Bourg A, Niino Y, Egolf L, Monetti C, et al. (2015). Transgenic mice for intersectional targeting of neural sensors and effectors with high specificity and performance. Neuron 85, 942–958. [DOI] [PMC free article] [PubMed] [Google Scholar]
- Massé IO, Ross S, Bronchti G, and Boire D. (2017). Asymmetric direct reciprocal connections between primary visual and somatosensory cortices of the mouse. Cereb. Cortex 27, 4361–4378. [DOI] [PubMed] [Google Scholar]
- Meyer HS, Egger R, Guest JM, Foerster R, Reissl S, and Oberlaender M. (2013). Cellular organization of cortical barrel columns is whisker-specific. Proc. Natl. Acad. Sci. U S A 110, 19113–19118. [DOI] [PMC free article] [PubMed] [Google Scholar]
- Minamisawa G, Kwon SE, Chevée M, Brown SP, and O’Connor DH. (2018). A non-canonical feedback circuit for rapid interactions between somatosensory cortices. Cell Rep. 23, 2718–2731. [DOI] [PMC free article] [PubMed] [Google Scholar]
- Miyamichi K, Shlomai-Fuchs Y, Shu M, Weissbourd BC, Luo L, and Mizrahi A. (2013). Dissecting local circuits: parvalbumin interneurons underlie broad feedback control of olfactory bulb output. Neuron 80, 1232–1245. [DOI] [PMC free article] [PubMed] [Google Scholar]
- Narayanan RT, Egger R, Johnson AS, Mansvelder HD, Sakmann B, de Kock CPJ, and Oberlaender M. (2015). Beyond columnar organization: cell type- and target layer-specific principles of horizontal axon projection patterns in rat vibrissal cortex. Cereb. Cortex 25, 4450–4468. [DOI] [PMC free article] [PubMed] [Google Scholar]
- Nassi JJ, Cepko CL, Born RT, and Beier KT. (2015). Neuroanatomy goes viral!. Front. Neuroanat 9, 80. [DOI] [PMC free article] [PubMed] [Google Scholar]
- Packer AM, and Yuste R. (2011). Dense, unspecific connectivity of neocortical parvalbumin-positive interneurons: a canonical microcircuit for inhibition? J. Neurosci 31, 13260–13271. [DOI] [PMC free article] [PubMed] [Google Scholar]
- Paxinos G, and Franklin KBJ. (2001). The Mouse Brain in Stereotaxic Coordinates, 2nd ed. (San Diego: Academic Press; ). [Google Scholar]
- Pfeffer CK. (2014). Inhibitory neurons: vip cells hit the brake on inhibition. Curr. Biol 24, R18–R20. [DOI] [PubMed] [Google Scholar]
- Pfeffer CK, Xue M, He M, Huang ZJ, and Scanziani M. (2013). Inhibition of inhibition in visual cortex: the logic of connections between molecularly distinct interneurons. Nat. Neurosci 16, 1068–1076. [DOI] [PMC free article] [PubMed] [Google Scholar]
- Pluta S, Naka A, Veit J, Telian G, Yao L, Hakim R, Taylor D, and Adesnik H. (2015). A direct translaminar inhibitory circuit tunes cortical output. Nat. Neurosci 18, 1631–1640. [DOI] [PMC free article] [PubMed] [Google Scholar]
- Pouille F, and Scanziani M. (2001). Enforcement of temporal fidelity in pyramidal cells by feed-forward somatic inhibition. Science 293, 325–331. [DOI] [PubMed] [Google Scholar]
- Pouille F, Marin-Burgin A, Adesnik H, Atallah BV, and Scanziani M. (2009). Input normalization by global feedforward inhibition expands cortical dynamic range. Nat. Neurosci 12, 1577–1585. [DOI] [PubMed] [Google Scholar]
- Prönneke A, Scheuer B, Wagener RJ, Möck M, Witte M, and Staiger JF. (2015). Characterizing VIP neurons in the barrel cortex of VIPcre/tdTomato mice reveals layer-specific differences. Cereb. Cortex 25, 4854–4868. [DOI] [PMC free article] [PubMed] [Google Scholar]
- Sachidhanandam S, Sermet BS, and Petersen CCH. (2016). Parvalbumin-expressing GABAergic neurons in mouse barrel cortex contribute to gating a goal-directed sensorimotor transformation. Cell Rep. 15, 700–706. [DOI] [PMC free article] [PubMed] [Google Scholar]
- Schindelin J, Arganda-Carreras I, Frise E, Kaynig V, Longair M, Pietzsch T, Preibisch S, Rueden C, Saalfeld S, Schmid B, et al. (2012). Fiji: an open-source platform for biological-image analysis. Nat. Methods 9, 676–682. [DOI] [PMC free article] [PubMed] [Google Scholar]
- Schuman B, Machold RP, Hashikawa Y, Fuzik J, Fishell GJ, and Rudy B. (2019). Four unique interneuron populations reside in neocortical layer 1. J. Neurosci 39, 125–139. [DOI] [PMC free article] [PubMed] [Google Scholar]
- Sohal VS, Zhang F, Yizhar O, and Deisseroth K. (2009). Parvalbumin neurons and gamma rhythms enhance cortical circuit performance. Nature 459, 698–702. [DOI] [PMC free article] [PubMed] [Google Scholar]
- Song YH, Kim JH, Jeong HW, Choi I, Jeong D, Kim K, and Lee SH. (2017). A neural circuit for auditory dominance over visual perception. Neuron 93, 940–954.e6. [DOI] [PubMed] [Google Scholar]
- Sparta DR, Hovelsø N, Mason AO, Kantak PA, Ung RL, Decot HK, and Stuber GD. (2014). Activation of prefrontal cortical parvalbumin interneurons facilitates extinction of reward-seeking behavior. J. Neurosci 34, 3699–3705. [DOI] [PMC free article] [PubMed] [Google Scholar]
- Staiger JF, Zilles K, and Freund TF. (1996). Distribution of GABAergic elements postsynaptic to ventroposteromedial thalamic projections in layer IV of rat barrel cortex. Eur. J. Neurosci 8, 2273–2285. [DOI] [PubMed] [Google Scholar]
- Staiger JF, Zuschratter W, Luhmann HJ, and Schubert D. (2009). Local circuits targeting parvalbumin-containing interneurons in layer IV of rat barrel cortex. Brain Struct. Funct 214, 1–13. [DOI] [PMC free article] [PubMed] [Google Scholar]
- Staiger JF, Bojak I, Miceli S, and Schubert D. (2015). A gradual depthdependent change in connectivity features of supragranular pyramidal cells in rat barrel cortex. Brain Struct. Funct 220, 1317–1337. [DOI] [PMC free article] [PubMed] [Google Scholar]
- Sun L, Tang Y, Yan K, Yu J, Zou Y, Xu W, Xiao K, Zhang Z, Li W, Wu B, et al. (2019). Differences in neurotropism and neurotoxicity among retrograde viral tracers. Mol. Neurodegener 14, 8. [DOI] [PMC free article] [PubMed] [Google Scholar]
- Tremblay R, Lee S, and Rudy B. (2016). GABAergic interneurons in the neocortex: from cellular properties to circuits. Neuron 91, 260–292. [DOI] [PMC free article] [PubMed] [Google Scholar]
- van Brederode JFM, Helliesen MK, and Hendrickson AE. (1991). Distribution of the calcium-binding proteins parvalbumin and calbindin-D28k in the sensorimotor cortex of the rat. Neuroscience 44, 157–171. [DOI] [PubMed] [Google Scholar]
- Wagener RJ, Dávid C, Zhao S, Haas CA, and Staiger JF. (2010). The somatosensory cortex of reeler mutant mice shows absent layering but intact formation and behavioral activation of columnar somatotopic maps. J. Neurosci 30, 15700–15709. [DOI] [PMC free article] [PubMed] [Google Scholar]
- Walker F, Möck M, Feyerabend M, Guy J, Wagener RJ, Schubert D, Staiger JF, and Witte M. (2016). Parvalbumin- and Vasoactive intestinal polypeptide-expressing neocortical interneurons impose differential inhibition on Martinotti cells. Nat. Commun 7, 1–8. [DOI] [PMC free article] [PubMed] [Google Scholar]
- Wall NR, Wickersham IR, Cetin A, De La Parra M, and Callaway EM. (2010). Monosynaptic circuit tracing in vivo through Cre-dependent targeting and complementation of modified rabies virus. Proc. Natl. Acad. Sci. U S A 107, 21848–21853. [DOI] [PMC free article] [PubMed] [Google Scholar]
- Wall NR, De La Parra M, Sorokin JM, Taniguchi H, Huang ZJ, and Callaway EM. (2016). Brain-wide maps of synaptic input to cortical interneurons. J. Neurosci 36, 4000–4009. [DOI] [PMC free article] [PubMed] [Google Scholar]
- Wang Y, Gupta A, Toledo-Rodriguez M, Wu CZ, and Markram H. (2002). Anatomical, physiological, molecular and circuit properties of nest basket cells in the developing somatosensory cortex. Cereb. Cortex 12, 395–410. [DOI] [PubMed] [Google Scholar]
- Watabe-Uchida M, Zhu L, Ogawa SK, Vamanrao A, and Uchida N. (2012). Whole-brain mapping of direct inputs to midbrain dopamine neurons. Neuron 74, 858–873. [DOI] [PubMed] [Google Scholar]
- Weible AP, Schwarcz L, Wickersham IR, Deblander L, Wu H, Callaway EM, Seung HS, and Kentros CG. (2010). Transgenic targeting of recombinant rabies virus reveals monosynaptic connectivity of specific neurons. J. Neurosci 30, 16509–16513. [DOI] [PMC free article] [PubMed] [Google Scholar]
- Weissbourd B, Ren J, DeLoach KE, Guenthner CJ, Miyamichi K, and Luo L. (2014). Presynaptic partners of dorsal raphe serotonergic and GABAergic neurons. Neuron 83, 645–662. [DOI] [PMC free article] [PubMed] [Google Scholar]
- Wickersham IR, Lyon DC, Barnard RJO, Mori T, Finke S, Conzelmann KK, Young JA, and Callaway EM. (2007). Monosynaptic restriction of transsynaptic tracing from single, genetically targeted neurons. Neuron 53, 639–647. [DOI] [PMC free article] [PubMed] [Google Scholar]
- Xu C, Krabbe S, Gründemann J, Botta P, Fadok JP, Osakada F, Saur D, Grewe BF, Schnitzer MJ, Callaway EM, and Lüthi A. (2016). Distinct hippocampal pathways mediate dissociable roles of context in memory retrieval. Cell 167, 961–972.e16. [DOI] [PMC free article] [PubMed] [Google Scholar]
- Yazaki-Sugiyama Y, Kang S, Câteau H, Fukai T, and Hensch TK. (2009). Bidirectional plasticity in fast-spiking GABA circuits by visual experience. Nature 462, 218–221. [DOI] [PubMed] [Google Scholar]
- Yetman MJ, Washburn E, Hyun JH, Osakada F, Hayano Y, Zeng H, Callaway EM, Kwon H-B, and Taniguchi H. (2019). Intersectional monosynaptic tracing for dissecting subtype-specific organization of GABAergic interneuron inputs. Nat. Neurosci 22, 492–502. [DOI] [PMC free article] [PubMed] [Google Scholar]
- Zhang S, Xu M, Chang W-C, Ma C, Hoang Do JP, Jeong D, Lei T, Fan JL, and Dan Y. (2016). Organization of long-range inputs and outputs of frontal cortex for top-down control. Nat. Neurosci 19, 1733–1742. [DOI] [PMC free article] [PubMed] [Google Scholar]
Associated Data
This section collects any data citations, data availability statements, or supplementary materials included in this article.